


, 전세계 일자리 파괴 가속화 “육체노동만 살아남나?”<br>")


<br>")


![삼성, 잃어버린 10년 [풀영상] | 창 458회 (KBS 24.03.12) by 인공지능](https://raptor-hw.net/xe/files/thumbnails/453/204/271x205.crop.jpg "삼성, 잃어버린 10년 [풀영상] | 창 458회 (KBS 24.03.12)<br>")


 ' alt='위대한 인류최대 수퍼로켓 '스타십(Spacex Starship)' 발사 성공 by 인공지능' />

’ 오픈<br>")
 다운로드 및 설치<br>")

<br>")


| AMD Ryzen SKUs | ||||||
| Cores/ Threads | Base/ Turbo | L3 | TDP | Cost | Launch Date | |
| Ryzen 7 1800X | 8/16 | 3.6/4.0 | 16 MB | 95 W | $499 | 3/2/2017 |
| Ryzen 7 1700X | 8/16 | 3.4/3.8 | 16 MB | 95 W | $399 | 3/2/2017 |
| Ryzen 7 1700 | 8/16 | 3.0/3.7 | 16 MB | 65 W | $329 | 3/2/2017 |
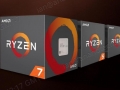
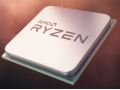
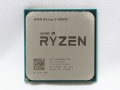
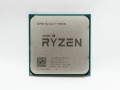
AMD가 마침내 신형 프로세서 "라이젠" 공식 발표
먼저 출시된 모델은 라이젠 7 시리즈 1800X, 1700X, 1700 3가지 모델로 각각 8코어 16스레드, 16MB의 L3 캐시 탑재
동작 클럭은 1800X가 베이스 3.6 - 터보 4.0, 1700X가 베이스 3.4 - 터보 3.8, 1700이 베이스 3.0 - 터보 3.7
TDP는 1800X / 1700X 95와트, 1700 모델이 65와트
| Comparison: Ryzen 7 1800X vs Core i7-6900K | ||
| AMD Ryzen 7 1800X | Features | Intel Core i7-6900K |
| 8 / 16 | Cores/Threads | 8 / 16 |
| 3.6 / 4.0 GHz | Base/Turbo | 3.2 / 3.7GHz |
| 16 | PCIe 3.0 Lanes | 40 |
| 16 MB | L3 Cache | 20 MB |
| 95 W | TDP | 140 W |
| $499 | Price (MSRP) | $1049 |
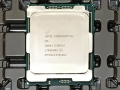
인텔의 8코어 16스레드 6900K와 라이젠 1800X 스펙비교
베이스 - 터보 클럭은 6900K가 3.2 / 3.7, 라이젠 1800X는 3.6 / 4.0
PCIE 3.0 레인수는 6900K가 40레인, 1800X가 16레인
L3 캐시는 6900K가 20MB, 1800X가 16MB
가격은 1800X가 499달러, 6900K 1049달러
| Comparison: Ryzen 7 1700 vs Core i7-7700K | ||
| AMD Ryzen 7 1700 | Features | Intel Core i7-7700K |
| 8 / 16 | Cores/Threads | 4 / 8 |
| 3.0 / 3.7 GHz | Base/Turbo | 4.2 / 4.5 GHz |
| 16 | PCIe 3.0 Lanes | 16 |
| 16 MB | L3 Cache | 8MB |
| 65 W | TDP | 91 W |
| $329 | Price (MSRP) | $350 |
라이젠 1700과 카비레이크 7700K 스펙비교
1700은 8코어 16스레드, 7700K는 4코어 8스레드
1700 클럭은 베이스 3.0 - 터보 3.7, 7700K 클럭은 베이스 4.2 - 터보 4.5
PCIE 레인수는 두 모델 모두 16레인
L3캐시는 1700이 16MB, 7700K가 8MB
TDP는 1700이 65와트, 7700K가 91와트
가격은 1700이 329달러, 7700K가 350달러
| CPU uArch Comparison | ||||
| AMD | Intel | |||
| Zen 8C/16T 2017 | Bulldozer 4M / 8T 2010 | Skylake Kaby Lake 4C / 8T 2015/7 | Broadwell 8C / 16T 2014 | |
| L1-I Size | 64KB/core | 64KB/module | 32KB/core | 32KB/core |
| L1-I Assoc | 4-way | 2-way | 8-way | 8-way |
| L1-D Size | 32KB/core | 16KB/thread | 32KB/core | 32KB/core |
| L1-D Assoc | 8-way | 4-way | 8-way | 8-way |
| L2 Size | 512KB/core | 1MB/thread | 256KB/core | 256KB/core |
| L2 Assoc | 8-way | 16-way | 4-way | 8-way |
| L3 Size | 2MB/core | 1MB/thread | >2MB/cire | 1.5-3MB/core |
| L3 Assoc | 16-way | 64-way | 16-way | 16/20-way |
| L3 Type | Victim | Victim | Write-back | Write-back |
| L0 ITLB Entry | 8 | - | - | - |
| L0 ITLB Assoc | ? | - | - | - |
| L1 ITLB Entry | 64 | 72 | 128 | 128 |
| L1 ITLB Assoc | ? | Full | 8-way | 4-way |
| L2 ITLB Entry | 512 | 512 | 1536 | 1536 |
| L2 ITLB Assoc | ? | 4-way | 12-way | 4-way |
| L1 DTLB Entry | 64 | 32 | 64 | 64 |
| L1 DTLB Assoc | ? | Full | 4-way | 4-way |
| L2 DTLB Entry | 1536 | 1024 | - | - |
| L2 DTLB Assoc | ? | 8-way | - | - |
| Decode | 4 uops/cycle | 4 Mops/cycle | 5 uops/cycle | 4 uops/cycle |
| uOp Cache Size | 2048 | - | 1536 | 1536 |
| uOp Cache Assoc | ? | - | 8-way | 8-way |
| uOp Queue Size | ? | - | 128 | 64 |
| Dispatch / cycle | 6 uops/cycle | 4 Mops/cycle | 6 uops/cycle | 4 uops/cycle |
| INT Registers | 168 | 160 | 180 | 168 |
| FP Registers | 160 | 96 | 168 | 168 |
| Retire Queue | 192 | 128 | 224 | 192 |
| Retire Rate | 8/cycle | 4/cycle | 8/cycle | 4/cycle |
| Load Queue | 72 | 40 | 72 | 72 |
| Store Queue | 44 | 24 | 56 | 42 |
| ALU | 4 | 2 | 4 | 4 |
| AGU | 2 | 2 | 2+2 | 2+2 |
| FMAC | 2x128-bit | 2x128-bit 2x MMX 128-bit | 2x256-bit | 2x256-bit |
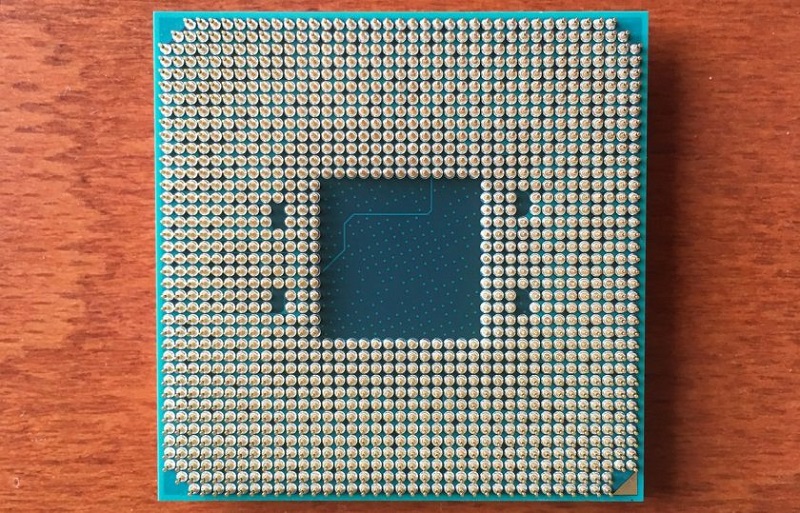
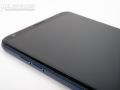
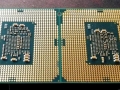
AM4 CPU
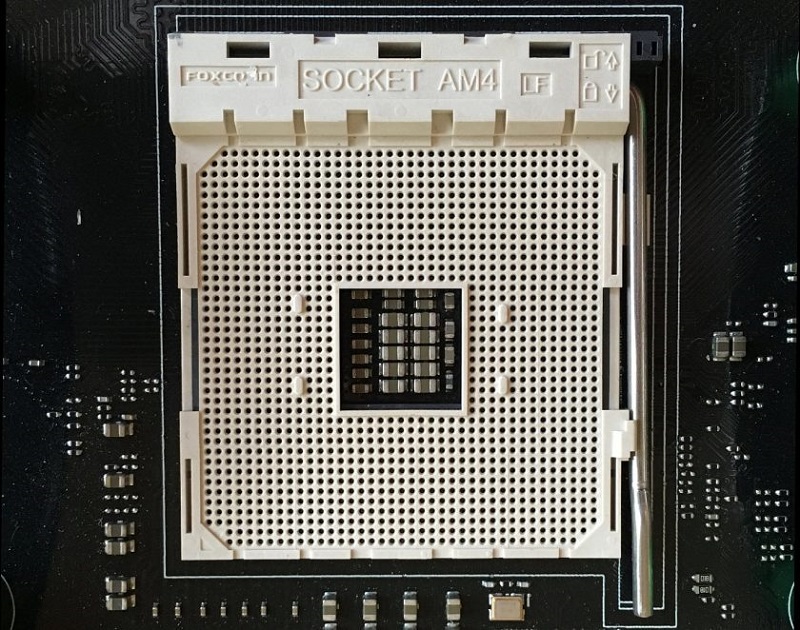
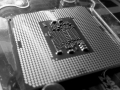
AM4 소켓
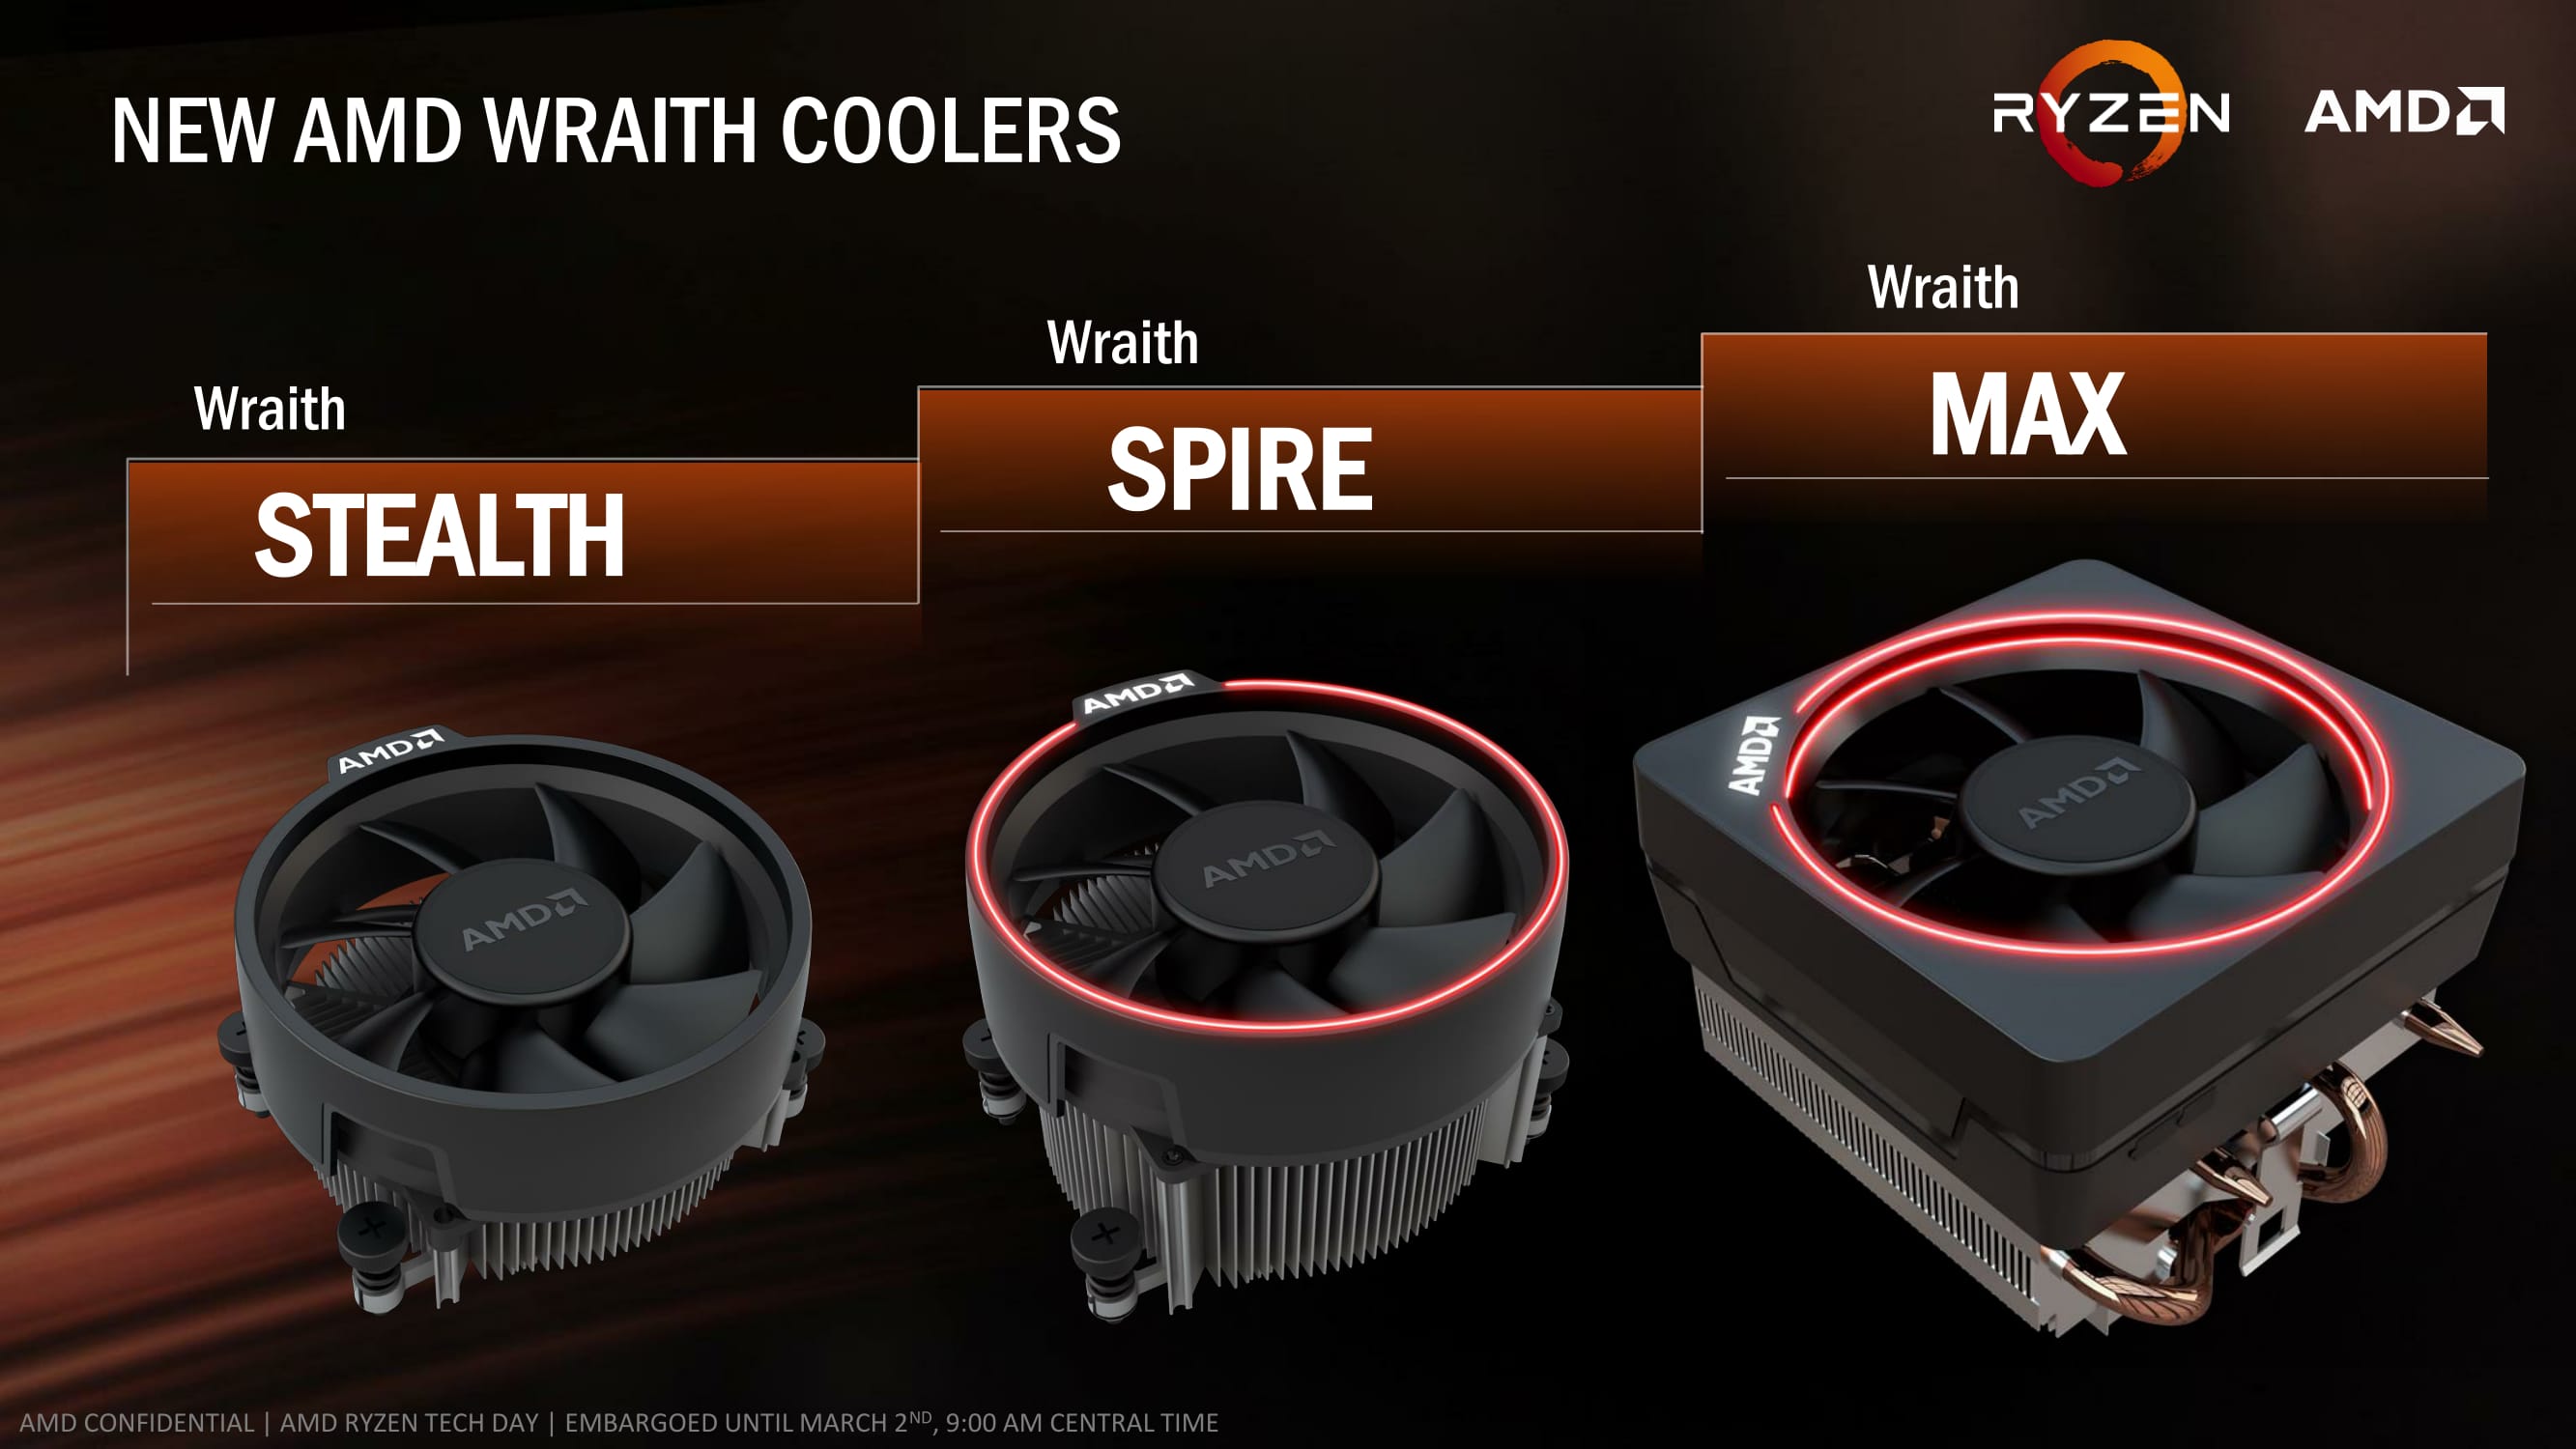
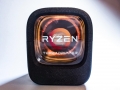
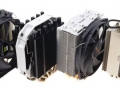
AMD 신형 레이스 쿨러
[ 테스트 시스템 ]
AMD Ryzen 7 1800X (8C/16T, 3.6-4.0 GHz, 95W, $499)
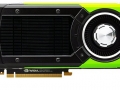
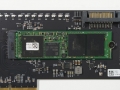
AMD Ryzen 7 1700X (8C/16T, , 95W, $399)AMD Ryzen 7 1700 (8C/16T, 3.0-3.7 GHz, 65W, $329)ASUS Crosshair VI Hero MotherboardCorsair Vengeance 2x8GB DDR4-3000 C16 running at DDR4-2400 C15Crucial MX200 1TB SSDRosewill SilentNight 500W Platinum PSUASUS GTX 950 Ti (95W)MSI GTX 1080 Gaming 8GBWindows 10 ProPDF Opening
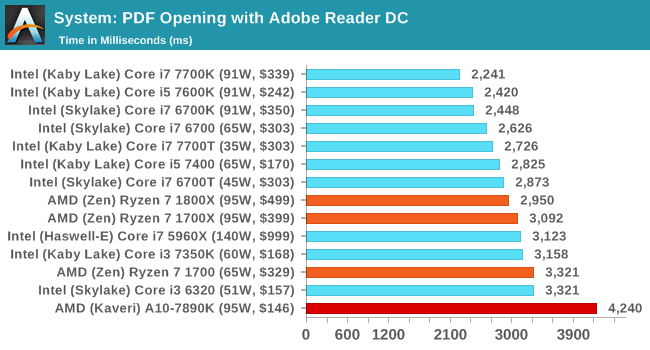
First up is a self-penned test using a monstrous PDF we once received in advance of attending an event. While the PDF was only a single page, it had so many high-quality layers embedded it was taking north of 15 seconds to open and to gain control on the mid-range notebook I was using at the time. This put it as a great candidate for our 'let's open an obnoxious PDF' test. Here we use Adobe Reader DC, and disable all the update functionality within. The benchmark sets the screen to 1080p, opens the PDF to in fit-to-screen mode, and measures the time from sending the command to open the PDF until it is fully displayed and the user can take control of the software again. The test is repeated ten times, and the average time taken. Results are in milliseconds.
FCAT Processing
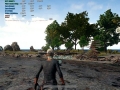
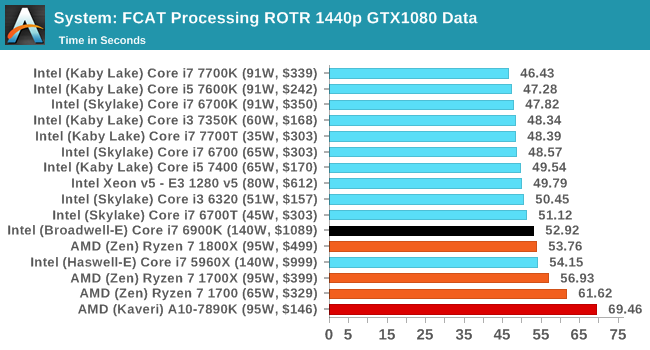
One of the more interesting workloads that has crossed our desks in recent quarters is FCAT - the tool we use to measure stuttering in gaming due to dropped or runt frames. The FCAT process requires enabling a color-based overlay onto a game, recording the gameplay, and then parsing the video file through the analysis software. The software is mostly single-threaded, however because the video is basically in a raw format, the file size is large and requires moving a lot of data around. For our test, we take a 90-second clip of the Rise of the Tomb Raider benchmark running on a GTX 980 Ti at 1440p, which comes in around 21 GB, and measure the time it takes to process through the visual analysis tool.
3D Particle Movement v2.1
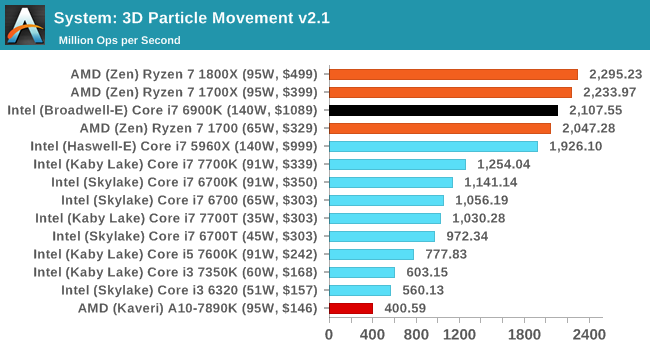
This is the latest version of the self-penned 3DPM benchmark. The goal of 3DPM is to simulate semi-optimized scientific algorithms taken directly from my doctorate thesis. Version 2.1 improves over 2.0 by passing the main particle structs by reference rather than by value, and decreasing the amount of double->float->double recasts the compiler was adding in. It affords a ~25% speed-up over v2.0, which means new data.
DigiCortex 1.16
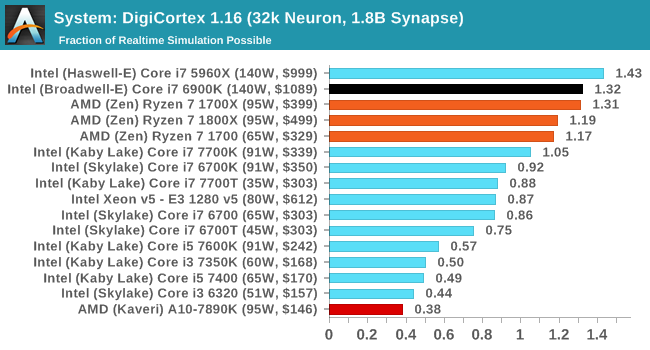
Despite being a couple of years old, the DigiCortex software is a pet project for the visualization of neuron and synapse activity in the brain. The software comes with a variety of benchmark modes, and we take the small benchmark which runs a 32k neuron/1.8B synapse simulation. The results on the output are given as a fraction of whether the system can simulate in real-time, so anything above a value of one is suitable for real-time work. The benchmark offers a 'no firing synapse' mode, which in essence detects DRAM and bus speed, however we take the firing mode which adds CPU work with every firing.
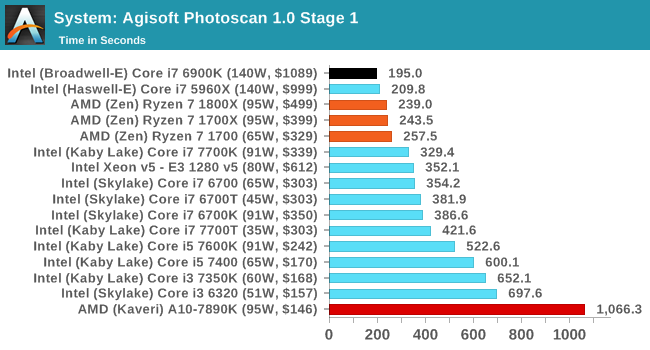
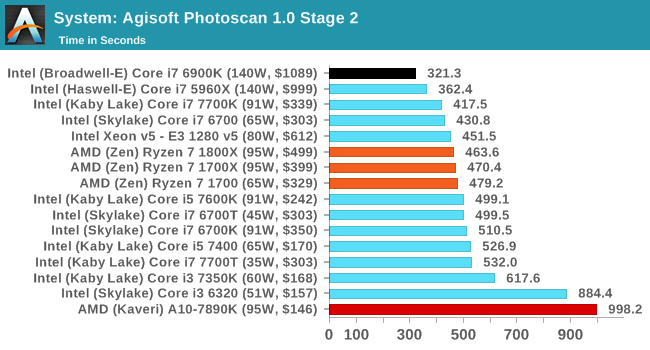
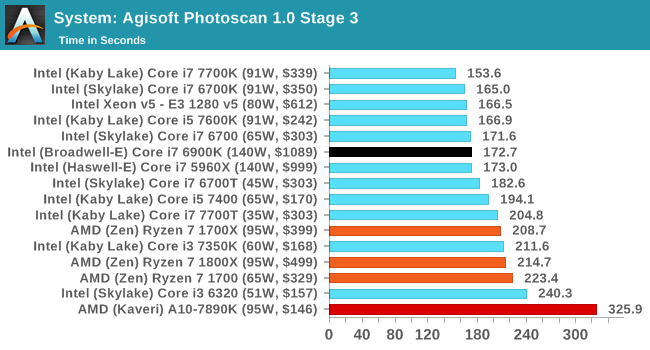
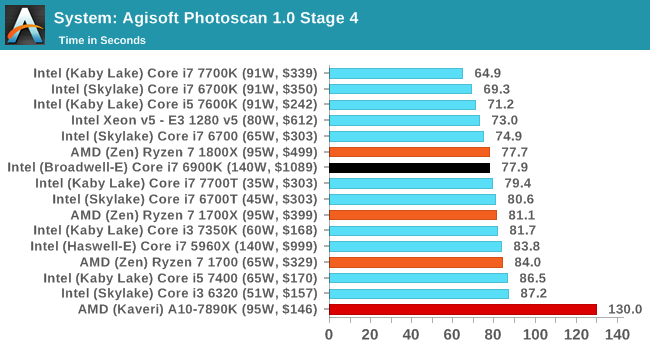
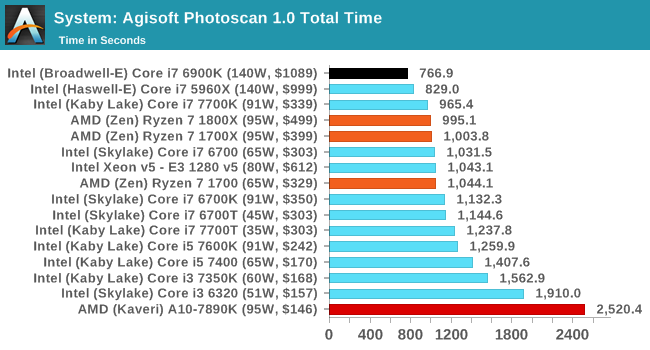
Agisoft Photoscan 1.0
Photoscan stays in our benchmark suite from the previous version, however now we are running on Windows 10 so features such as Speed Shift on the latest processors come into play. The concept of Photoscan is translating many 2D images into a 3D model - so the more detailed the images, and the more you have, the better the model. The algorithm has four stages, some single threaded and some multi-threaded, along with some cache/memory dependency in there as well. For some of the more variable threaded workload, features such as Speed Shift and XFR will be able to take advantage of CPU stalls or downtime, giving sizeable speedups on newer microarchitectures.
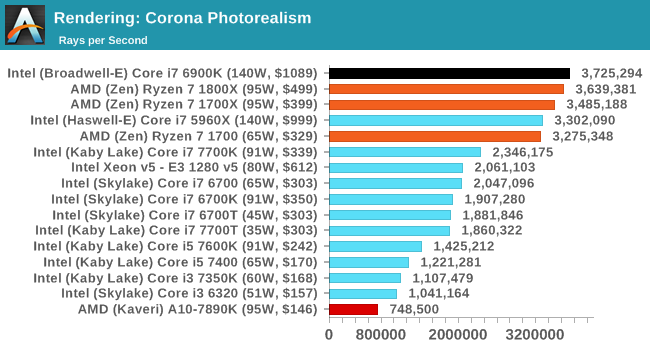
Corona 1.3
Corona is a standalone package designed to assist software like 3ds Max and Maya with photorealism via ray tracing. It's simple - shoot rays, get pixels. OK, it's more complicated than that, but the benchmark renders a fixed scene six times and offers results in terms of time and rays per second. The official benchmark tables list user submitted results in terms of time, however I feel rays per second is a better metric (in general, scores where higher is better seem to be easier to explain anyway). Corona likes to pile on the threads, so the results end up being very staggered based on thread count.
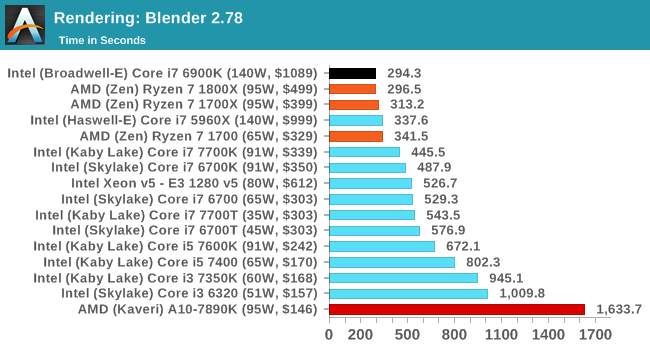
Blender 2.78
For a render that has been around for what seems like ages, Blender is still a highly popular tool. We managed to wrap up a standard workload into the February 5 nightly build of Blender and measure the time it takes to render the first frame of the scene. Being one of the bigger open source tools out there, it means both AMD and Intel work actively to help improve the codebase, for better or for worse on their own/each other's microarchitecture.
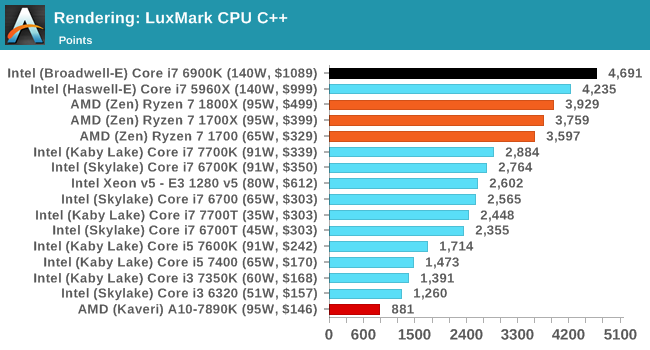
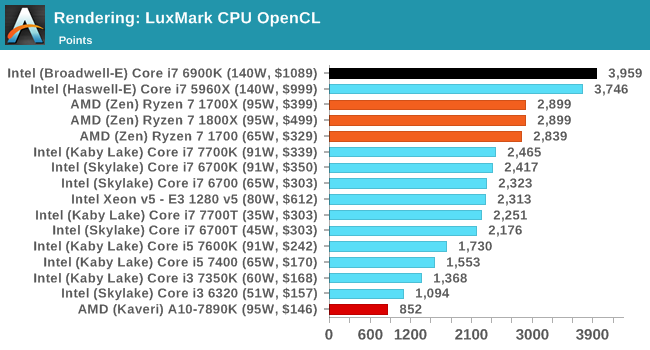
LuxMark
As a synthetic, LuxMark might come across as somewhat arbitrary as a renderer, given that it's mainly used to test GPUs, but it does offer both an OpenCL and a standard C++ mode. In this instance, aside from seeing the comparison in each coding mode for cores and IPC, we also get to see the difference in performance moving from a C++ based code-stack to an OpenCL one with a CPU as the main host.
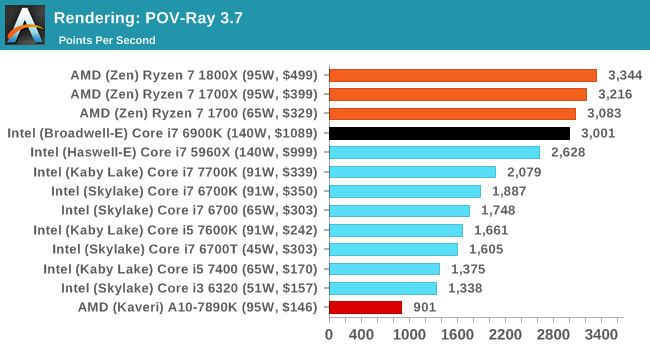
POV-Ray 3.7
Another regular benchmark in most suites, POV-Ray is another ray-tracer but has been around for many years. It just so happens that during the run up to AMD's Ryzen launch, the code base started to get active again with developers making changes to the code and pushing out updates. Our version and benchmarking started just before that was happening, but given time we will see where the POV-Ray code ends up and adjust in due course.
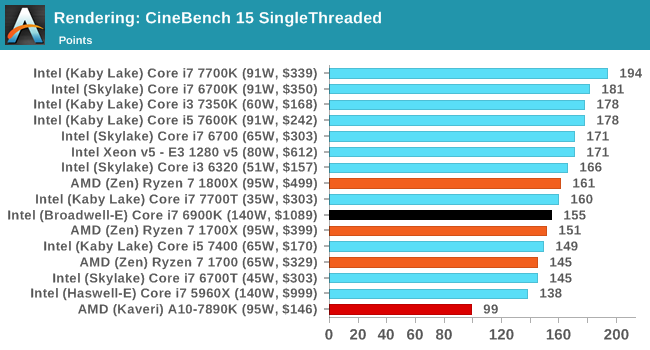
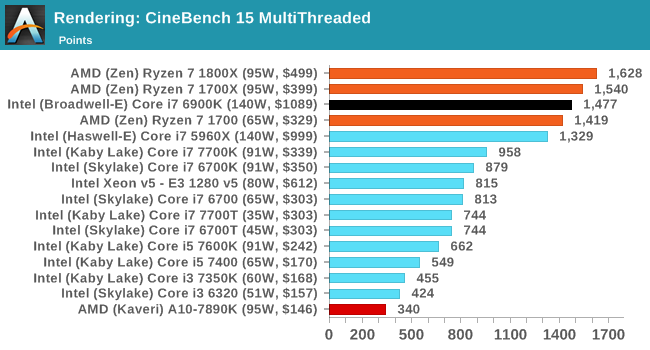
Cinebench R15
The latest version of CineBench has also become one of those 'used everywhere' benchmarks, particularly as an indicator of single thread performance. High IPC and high frequency gives performance in ST, whereas having good scaling and many cores is where the MT test wins out.
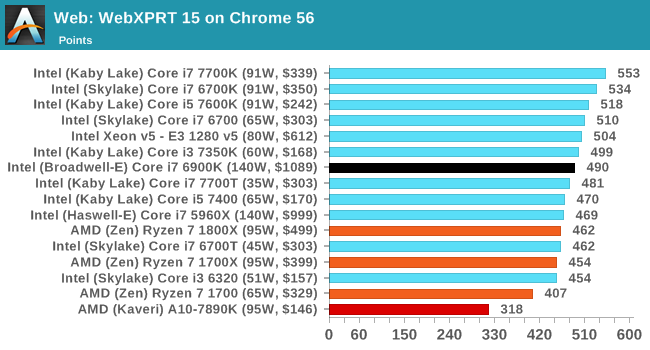
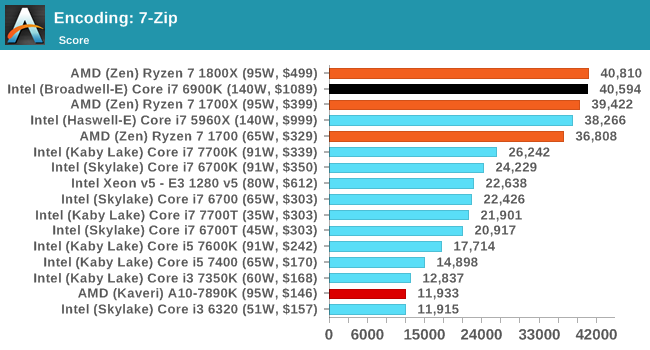
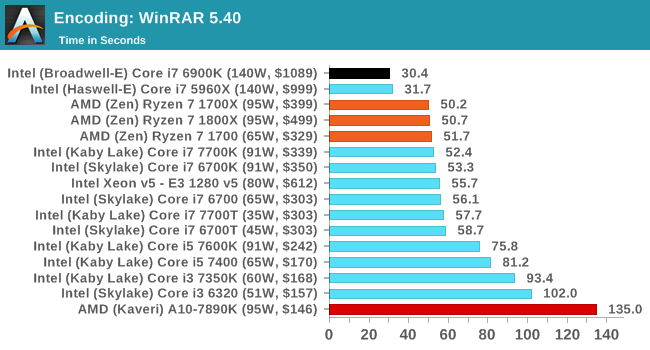
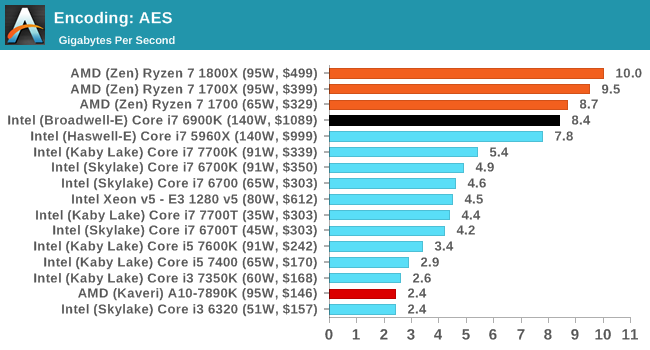
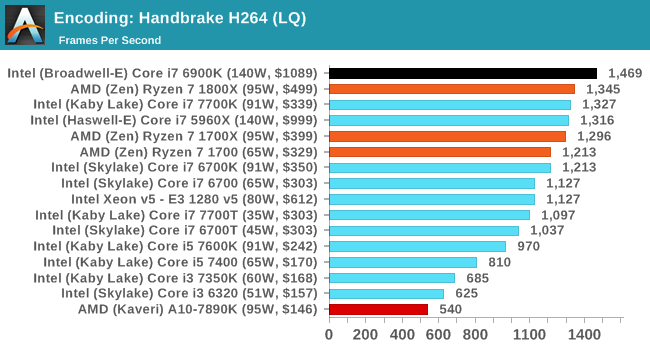
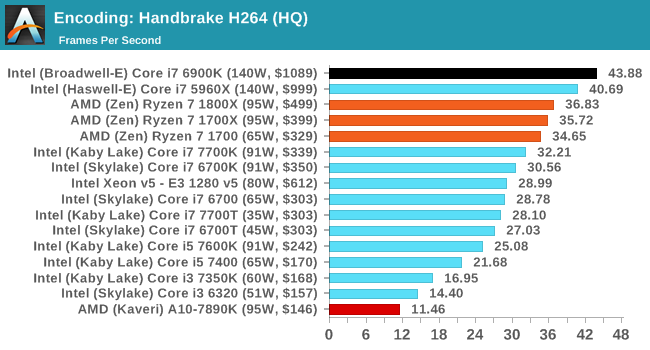
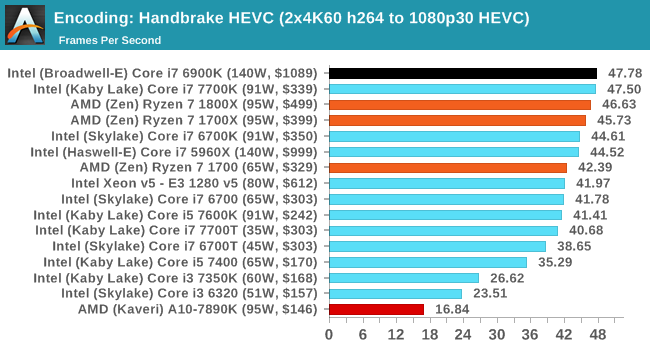
Benchmarking Performance: CPU Encoding Tests
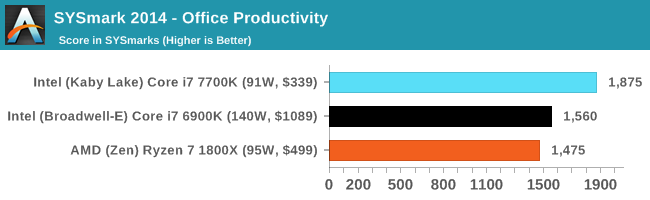
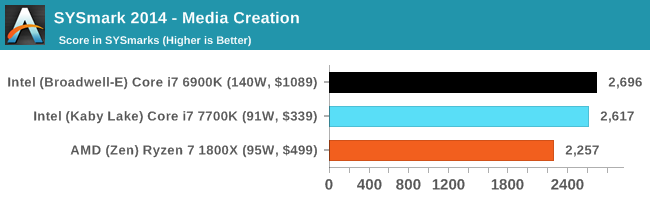
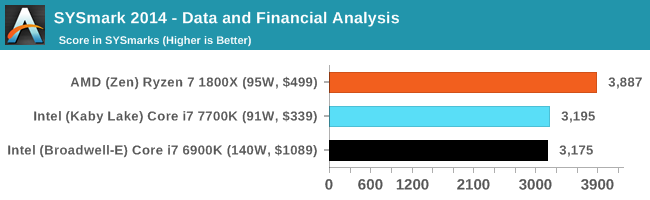
Benchmarking Performance: CPU Office Tests
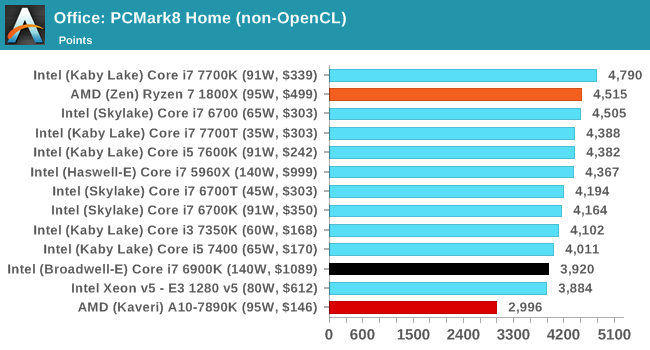
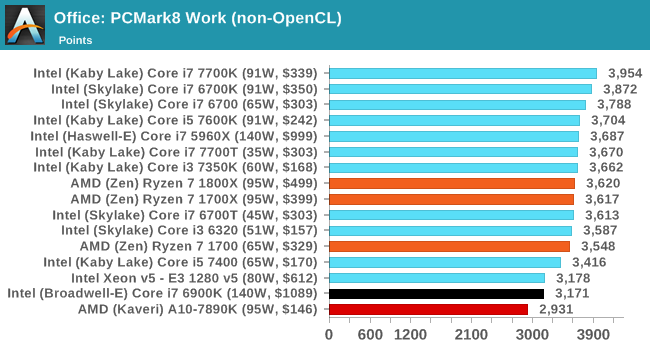
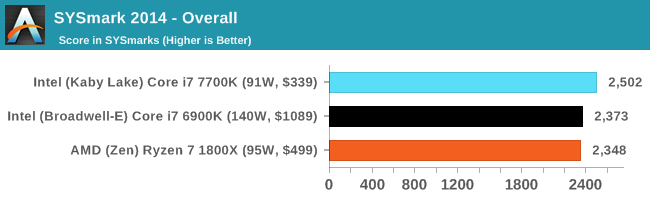
Sysmark is developed by Bapco, a consortium of industry CPU companies. AMD left Bapco in the last two years, due to differences of opinion on how the benchmarking suites were angled towards Intel processors and had optimizations to show bigger differences than what AMD felt was present. The following benchmarks are provided as data, but the conflict of opinion between the two companies on the validity of the benchmark is provided as context for the following numbers.
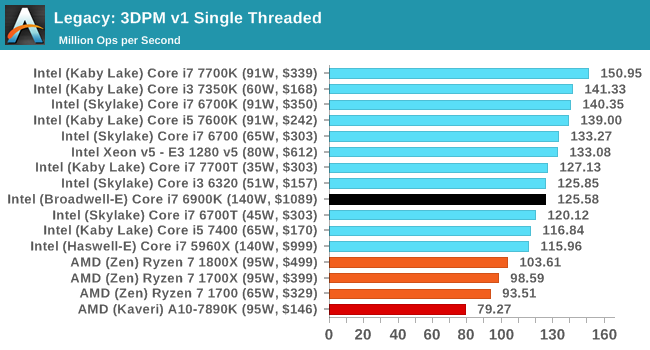
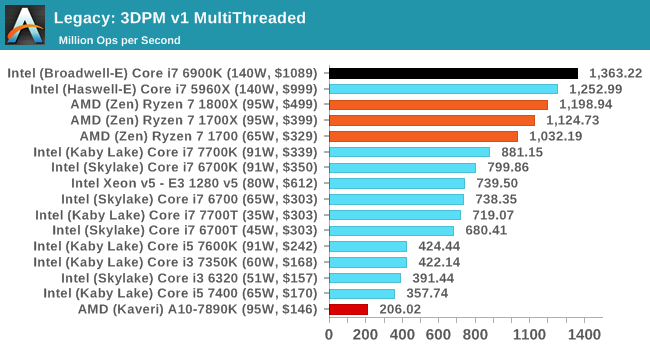
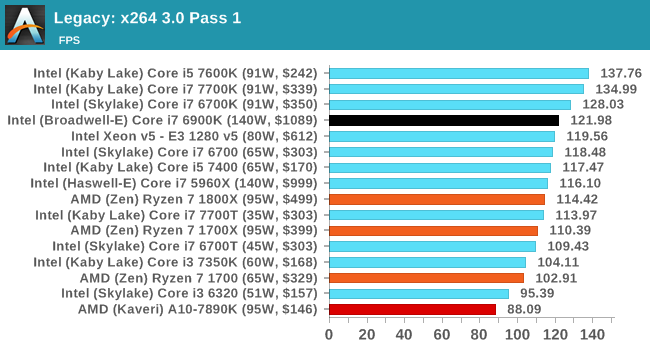
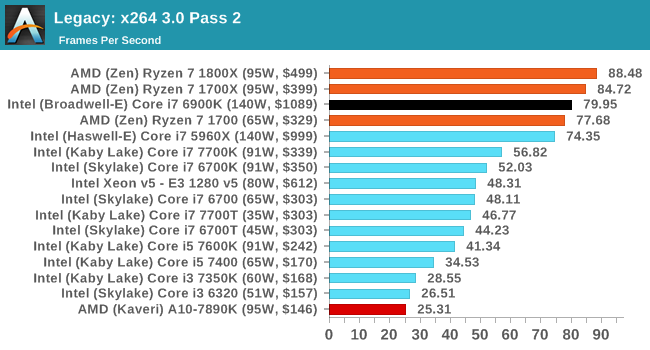
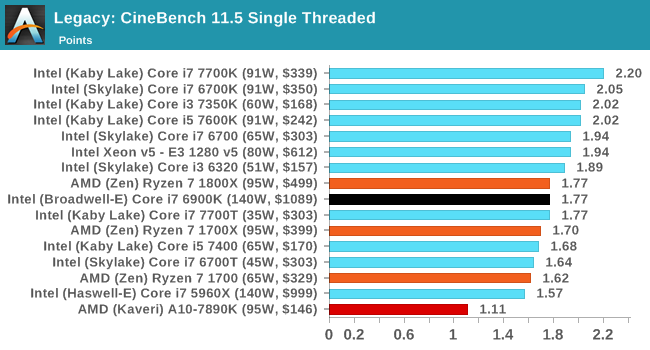
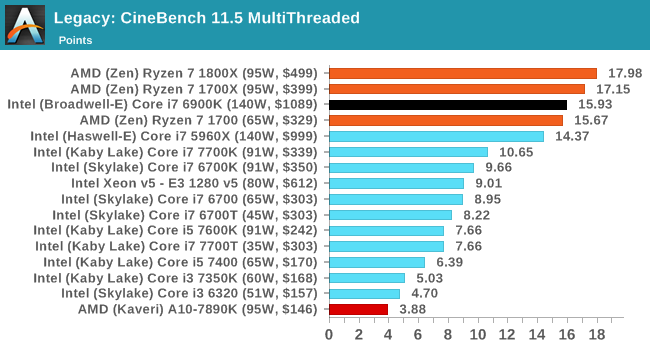
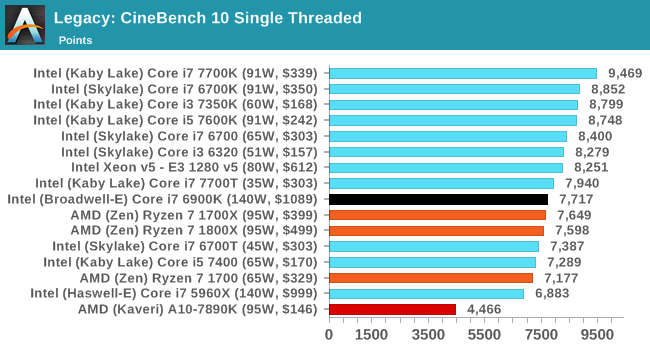
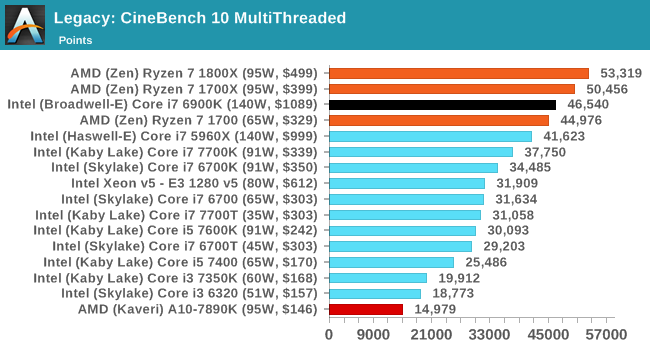
Benchmarking Performance: CPU Legacy Tests
출처 - http://www.anandtech.com
리뷰어 결론 - AMD 라이젠 CPU는 전통적인 uArch를 탑재하고 있으며 특히 지난 세대의 AMD와 비교할때 성능이 뛰어납니다. AMD가 싱글스레드와 멀티스레드에서 인텔의 HEDT와 동등하거나 그 이상인 벤치마크 결과도 많이 볼 수 있습니다. 그러나 AMD가 여전히 브로드웰 대비 10 - 20% 뒤떨어져있는 경우도 있습니다. 이러한 엣지 케이스는 예측하기 어렵고 최적화되지 않은 코드에서 비롯 될 수 있습니다. 인텔의 거대한 R&D 강점 중 하나는 프리페치, 메모리 알고리즘 및 광범위한 테스트를 통해 이러한 엣지 케이스를 처리 할 수 있다는 것입니다.
성능 대비 가격은 여전히 AMD의 강점 중 하나입니다. 499달러의 1800X가 1049달러의 i7-6900K와 비슷하거나 앞서는 수많은 테스트에서 가격 대비 성능이 2배로 변환됩니다. 우리는 라이젠 테스트를 위해 2부 - CPU 및 IPC 분석, 새로운 게임 및 그래픽 카드를 사용하는 DX12의 GPU 테스트를 계획하고 있습니다.
요약 - AMD 라이젠은 게임을 제외한 여러 연산 프로그램에서는 인텔의 최상위 모델과 비슷하거나 일부 앞서는 성능도 보이며 높은 가격 대비 성능을 어필. 어낸드텍은 벤치마크 2부로 게이밍 성능 벤치마크를 업데이트 할 예정