


, 전세계 일자리 파괴 가속화 “육체노동만 살아남나?”<br>")


 ' alt='위대한 인류최대 수퍼로켓 '스타십(Spacex Starship)' 발사 성공 by 인공지능' />
’ 오픈<br>")


 다운로드 및 설치<br>")

<br>")
![삼성, 잃어버린 10년 [풀영상] | 창 458회 (KBS 24.03.12) by 인공지능](https://raptor-hw.net/xe/files/thumbnails/453/204/271x205.crop.jpg "삼성, 잃어버린 10년 [풀영상] | 창 458회 (KBS 24.03.12)<br>")


<br>")


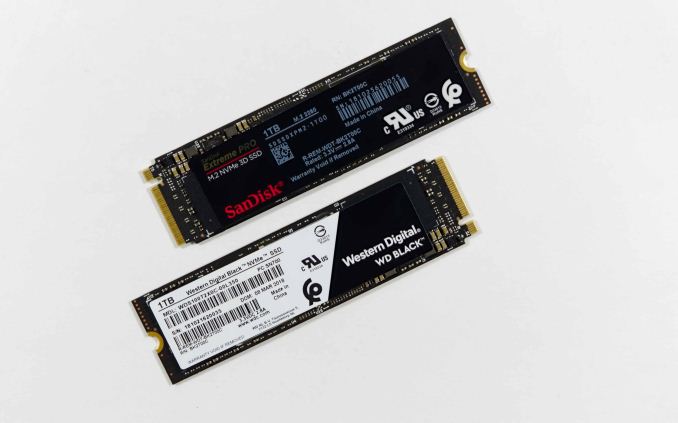
| Western Digital WD Black and SanDisk Extreme PRO Specifications | |||||
| Capacity | 250 GB | 500 GB | 1 TB | ||
| WD Black Model | WDS250G2X0C | WDS500G2X0C | WDS100T2X0C | ||
| SanDisk Extreme PRO Model | - | SDSSDXPM2-500G | SDSSDXPM2-1T00 | ||
| Form Factor | M.2 2280 Single-Sided | ||||
| Interface | NVMe PCIe 3 x4 | ||||
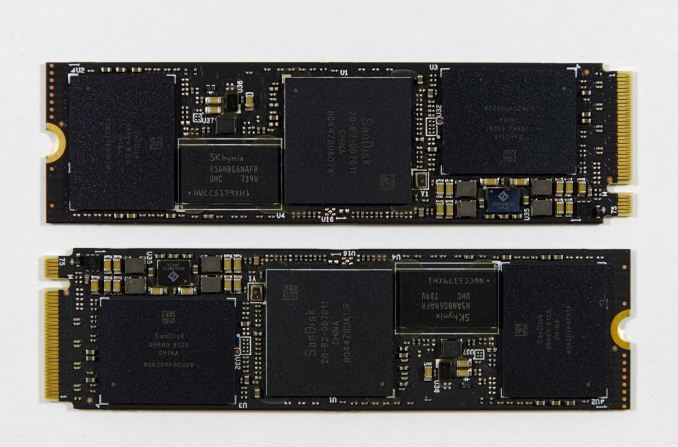
| Controller | Western Digital in-house | ||||
| NAND | SanDisk 64-layer 3D TLC | ||||
| DRAM | SK Hynix DDR4-2400 | ||||
| Sequential Read | 3000 MB/s | 3400 MB/s | 3400 MB/s | ||
| Sequential Write | 1600 MB/s | 2500 MB/s | 2800 MB/s | ||
| 4KB Random Read | 220k IOPS | 410k IOPS | 500k IOPS | ||
| 4KB Random Write | 170k IOPS | 330k IOPS | 400k IOPS | ||
| Power | Peak (10µs) | 9.24 W | 9.24 W | 9.24 W | |
| PS3 Idle | 70 mW | 70 mW | 100 mW | ||
| PS4 Idle | 2.5 mW | 2.5 mW | 2.5 mW | ||
| Write Endurance | 200 TBW 0.4 DWPD | 300 TBW 0.3 DWPD | 600 TBW 0.3 DWPD | ||
| Warranty | 5 years | ||||
| MSRP | $119.99 (48¢/GB) | $229.99 (46¢/GB) | $449.99 (45¢/GB) | ||
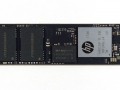
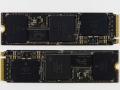
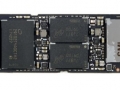
WD 블랙 SSD 라인업 : WDS250G2X0C(250GB) / WDS500G2X0C(500G) / WDS100T2X0C(1TB)
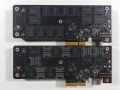
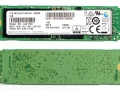
폼 팩터 : M.2 2280 싱글 사이드
인터페이스 : NVMe PCIe 3 x4
컨트롤러 : Western Digital in-house
낸드 플래시 : 샌디스크 64층 3D TLC
DRAM : SK 하이닉스 DDR4-2400
시퀀셜 읽기 : 3000MB/s ~ 3400MB/s
시퀀셜 쓰기 : 1600MB/s ~ 2800MB/s
랜덤 읽기 : 220k IOPS ~ 500k IOPS
랜덤 쓰기 : 170k IOPS ~ 400k IOPS
워런티 : 5년
가격 : $119.99 / $229.99 / $449.99

[ 테스트 시스템 ]
| AnandTech 2017/2018 Consumer SSD Testbed | |
| CPU | Intel Xeon E3 1240 v5 |
| Motherboard | ASRock Fatal1ty E3V5 Performance Gaming/OC |
| Chipset | Intel C232 |
| Memory | 4x 8GB G.SKILL Ripjaws DDR4-2400 CL15 |
| Graphics | AMD Radeon HD 5450, 1920x1200@60Hz |
| Software | Windows 10 x64, version 1709 |
| Linux kernel version 4.14, fio version 3.1 | |
AnandTech Storage Bench - The Destroyer
The Destroyer is an extremely long test replicating the access patterns of very IO-intensive desktop usage. A detailed breakdown can be found in this article. Like real-world usage, the drives do get the occasional break that allows for some background garbage collection and flushing caches, but those idle times are limited to 25ms so that it doesn't take all week to run the test. These AnandTech Storage Bench (ATSB) tests do not involve running the actual applications that generated the workloads, so the scores are relatively insensitive to changes in CPU performance and RAM from our new testbed, but the jump to a newer version of Windows and the newer storage drivers can have an impact.
We quantify performance on this test by reporting the drive's average data throughput, the average latency of the I/O operations, and the total energy used by the drive over the course of the test.
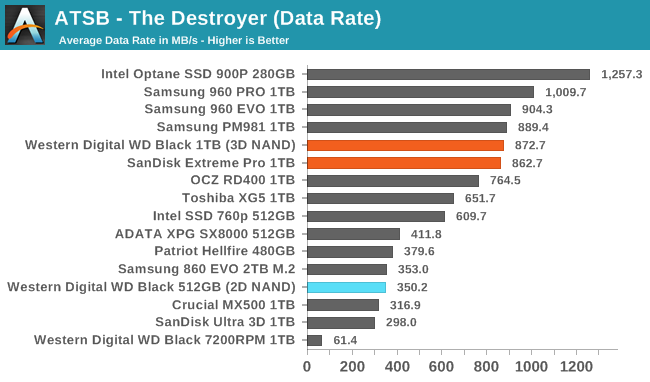
The average data rate from the new WD Black on The Destroyer is almost as fast as Samsung's TLC-based 960 EVO and their newer PM981 OEM drive. Where the original WD Black NVMe SSD was clearly a low-end NVMe drive and no faster than SATA SSDs on this test, the new WD Black is competitive at the high end.
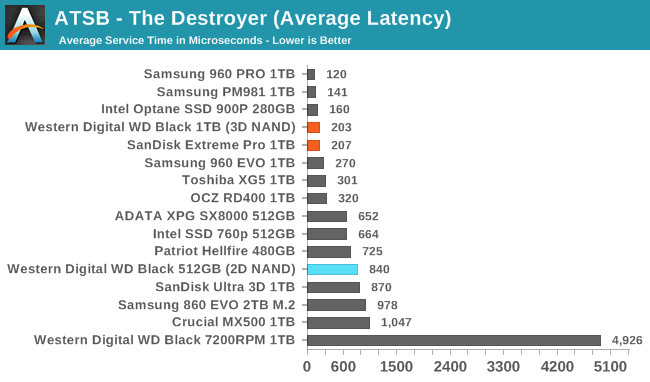
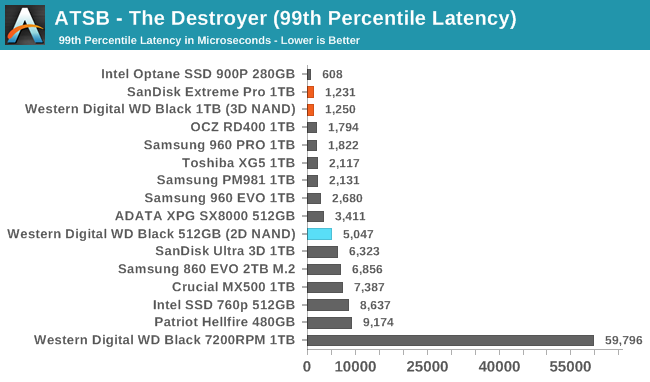
The average latencies from the WD Black are competitive with Samsung's TLC drives, and the 99th percentile latencies are the fastest we've seen from any flash-based SSD for this capacity class.
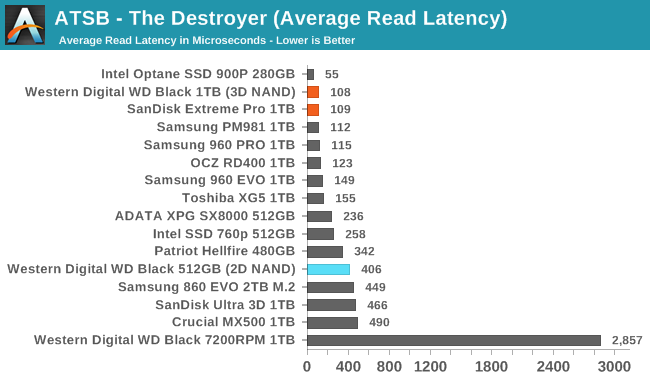
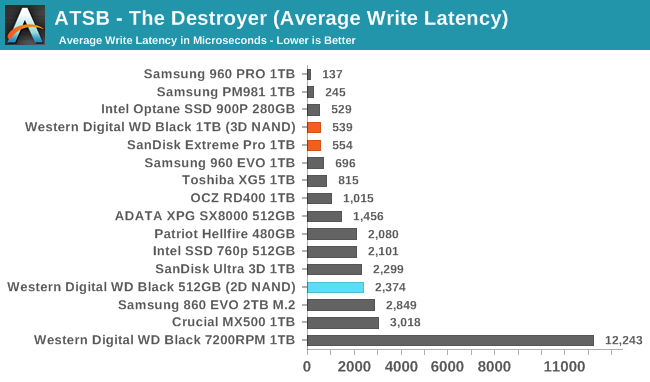
The average read latencies from the WD Black on The Destroyer are as good as any flash-based SSD we've tested. Average write latencies are great but Samsung's top drives are still clearly faster.
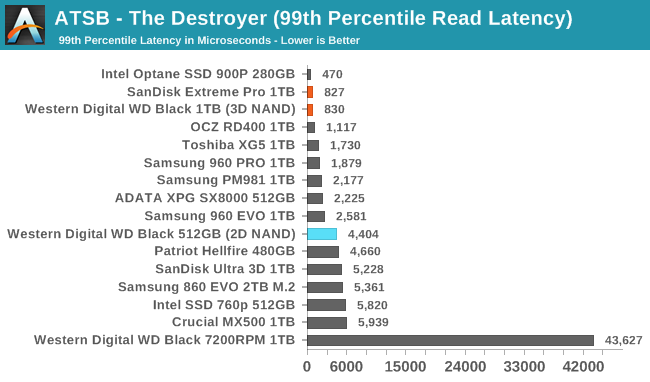
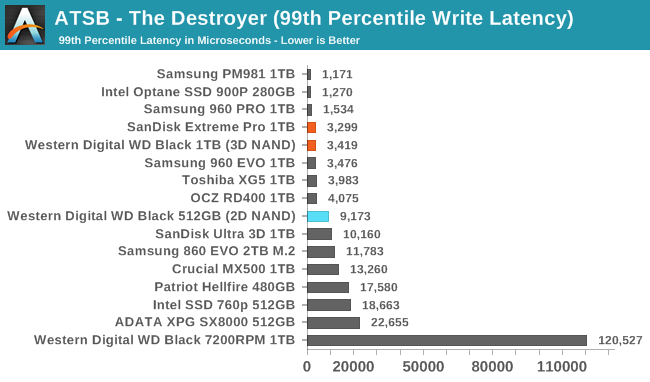
The WD Black has the best 99th percentile read latency scores aside from Intel's Optane SSD 900P, but the 99th percentile write latency scores are only in the second tier of drives.
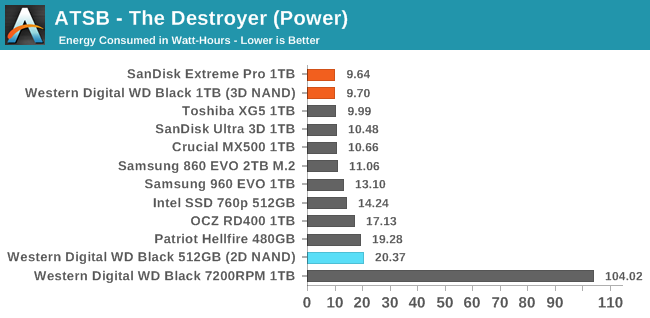
The load power consumption of the new WD Black is a huge improvement over the previous SSD to bear this name. The new model uses less than half as much energy over the course of The Destroyer, putting it in first place slightly ahead of the Toshiba XG5.
AnandTech Storage Bench - Heavy
Our Heavy storage benchmark is proportionally more write-heavy than The Destroyer, but much shorter overall. The total writes in the Heavy test aren't enough to fill the drive, so performance never drops down to steady state. This test is far more representative of a power user's day to day usage, and is heavily influenced by the drive's peak performance. The Heavy workload test details can be found here. This test is run twice, once on a freshly erased drive and once after filling the drive with sequential writes.
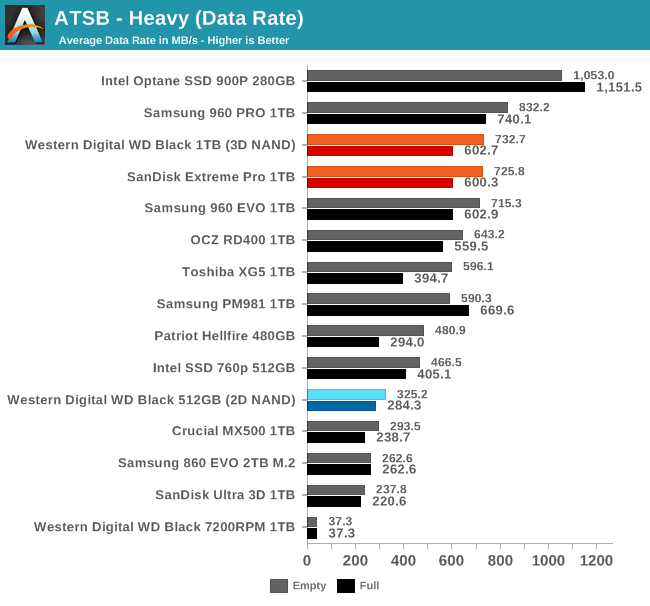
The average data rates from the new WD Black SSD on the Heavy test are essentially tied with the Samsung 960 EVO. Premium drives like the Samsung 960 PRO and Intel Optane SSD 900P are faster, but the WD Black and SanDisk Extreme PRO NVMe SSDs still clearly belong in the high-end market segment.
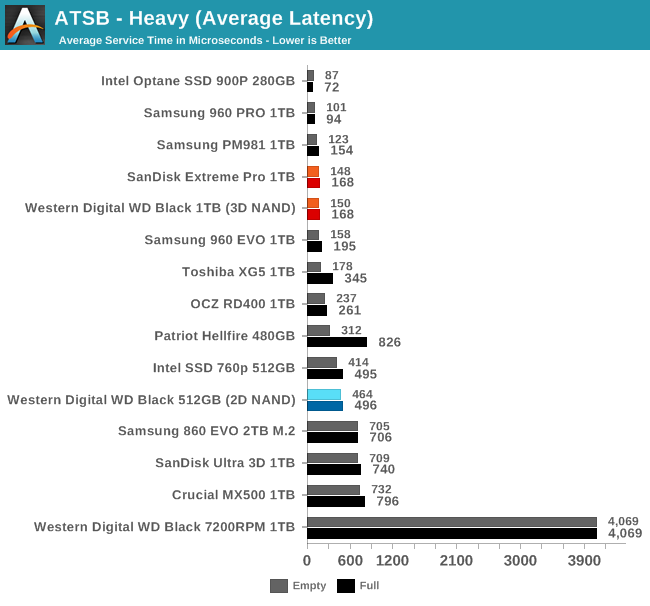

The average and 99th percentile latency scores from the WD Black on the Heavy test are among the best from any flash-based SSD. The 99th percentile write latency of the WD Black shows much less performance loss from a full drive than the Toshiba XG5 or Samsung 960 EVO.
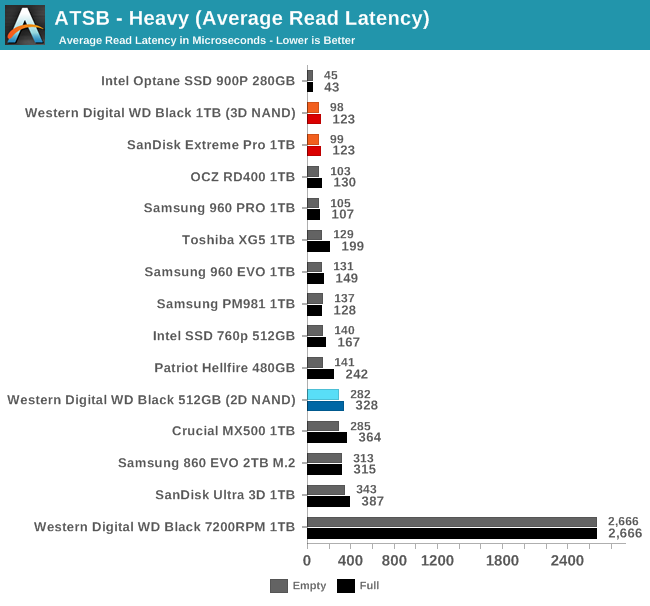
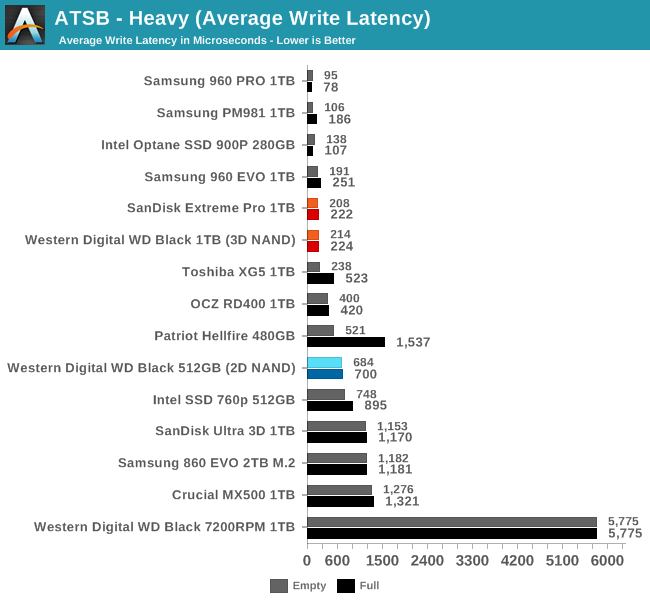
The WD Black is one of the top drives for average read latency, and the average write latency is only slightly higher than that of the Samsung 960 EVO. The performance hit when the test is run on a full drive is no worse than what most MLC-based drives suffer.
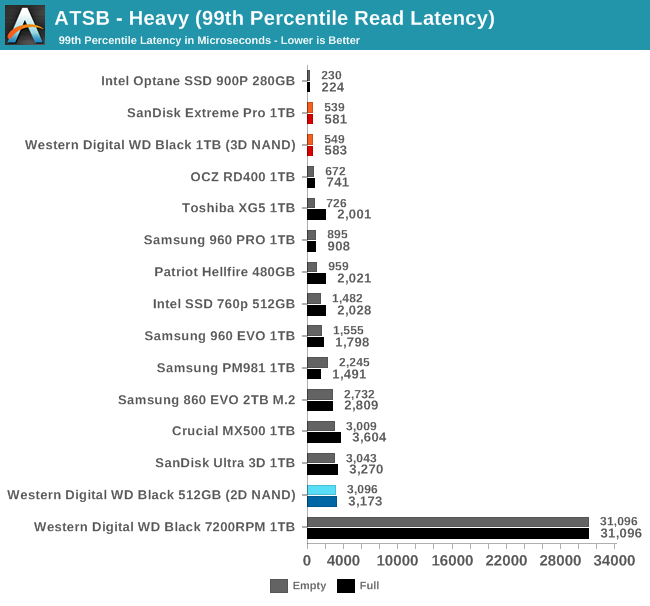
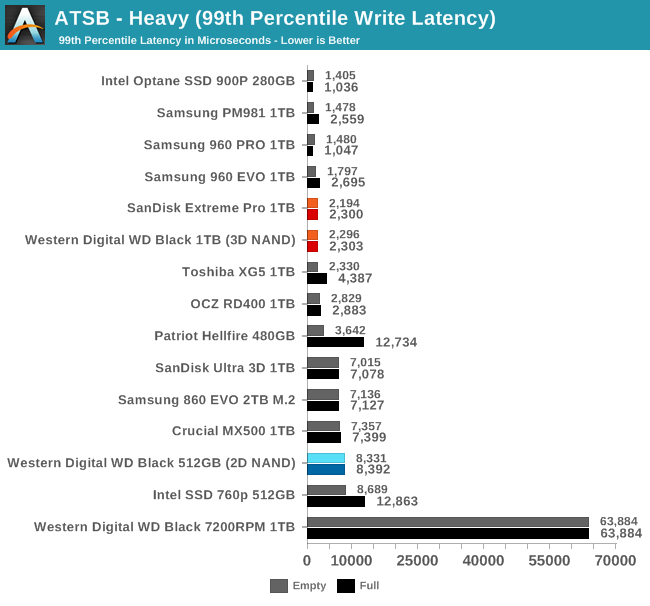
Western Digital's new controller architecture provides great QoS for read operations, with 99th percentile latencies lower than any of the competing flash-based SSDs. The 99th percentile write latencies are top notch but don't stand out from the crowd.
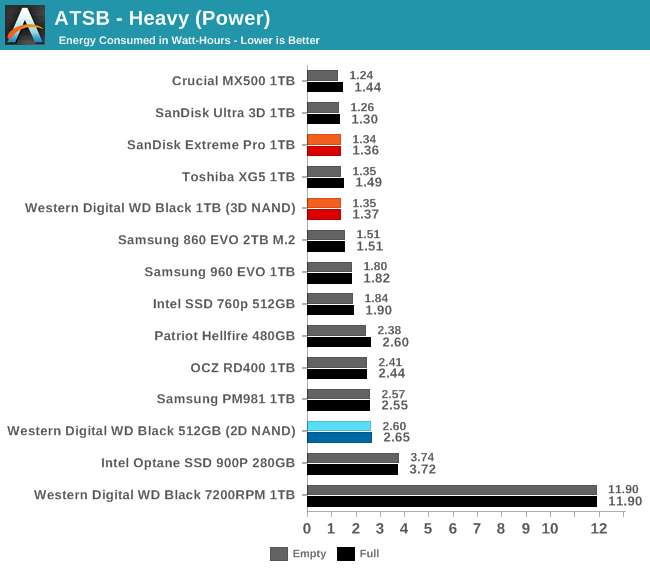
The WD Black and SanDisk Extreme PRO join the Toshiba XG5 as some of the few NVMe SSDs that offer load power efficiency comparable to good SATA SSDs. The total energy used during the heavy test is only slightly higher than the Crucial MX500 and Western Digital's own SATA drives with the same 64L 3D TLC NAND.
AnandTech Storage Bench - Light
Our Light storage test has relatively more sequential accesses and lower queue depths than The Destroyer or the Heavy test, and it's by far the shortest test overall. It's based largely on applications that aren't highly dependent on storage performance, so this is a test more of application launch times and file load times. This test can be seen as the sum of all the little delays in daily usage, but with the idle times trimmed to 25ms it takes less than half an hour to run. Details of the Light test can be found here. As with the ATSB Heavy test, this test is run with the drive both freshly erased and empty, and after filling the drive with sequential writes.
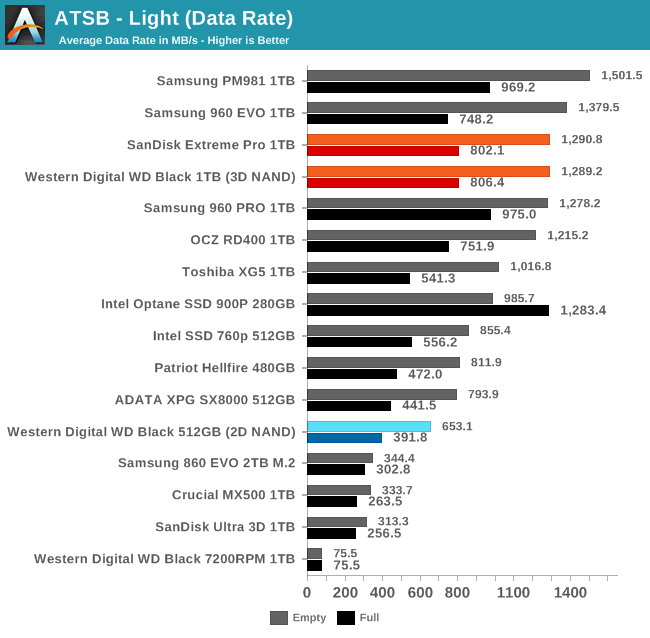
The WD Black's average data rates on the Light test are slightly slower than the Samsung 960 EVO when the test is run on an empty drive, and a bit faster when the drive is full. The Samsung PM981 is the only drive that has a clear lead in both cases, and even then it isn't a very big margin. The worst-case performance here from the new WD Black is substantially faster than the best-case from last year's WD Black.
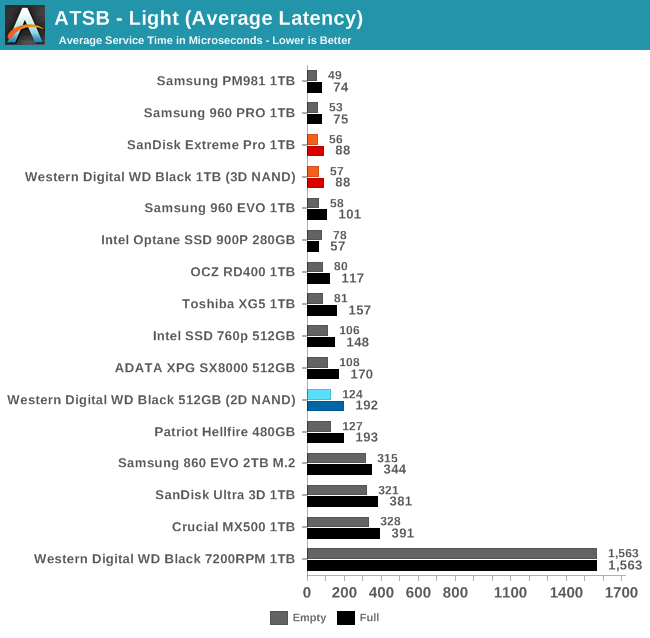
The average latencies from the WD Black during the Light test are as low as any SSD offers. The 99th percentile latencies are not quite as fast as Samsung's best drives offer, except that the full-drive performance is better than the 960 EVO.
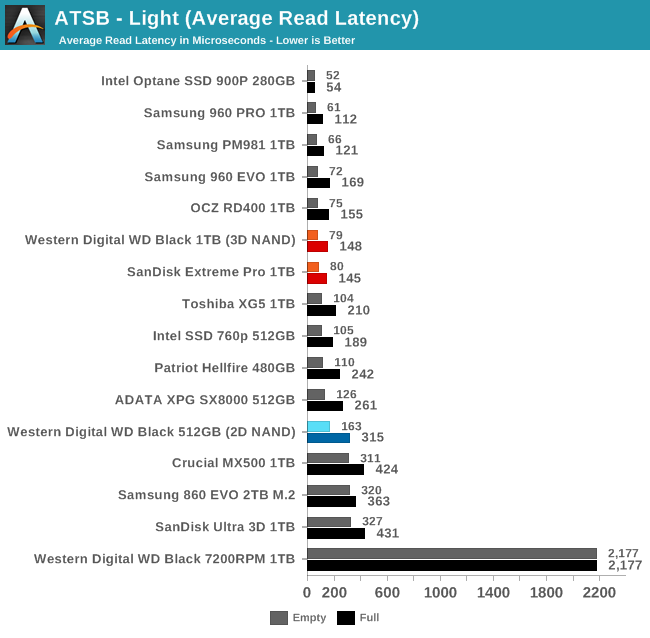
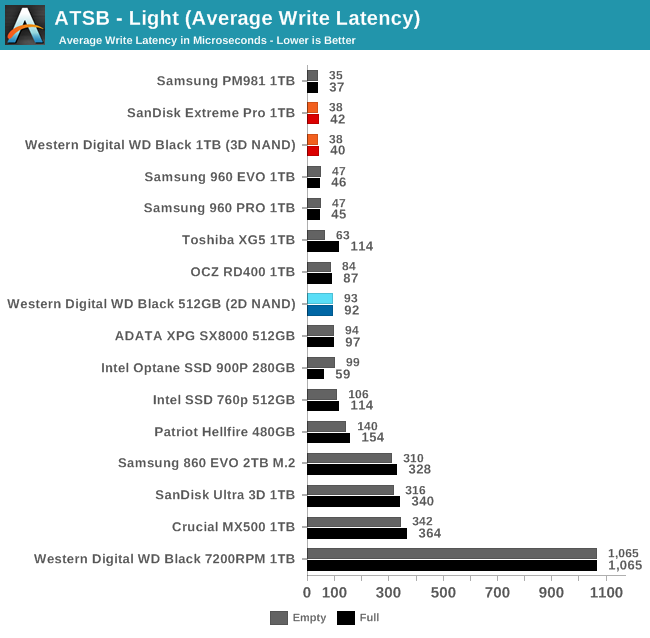
There are quite a few SSDs with average read latency scores that are close to or slightly better than the WD Black, and even the low-end NVMe SSDs keep the average read latency down to a fraction of a millisecond on the Light test. The average write latencies from the WD Black are essentially tied for first place with Samsung's drives.
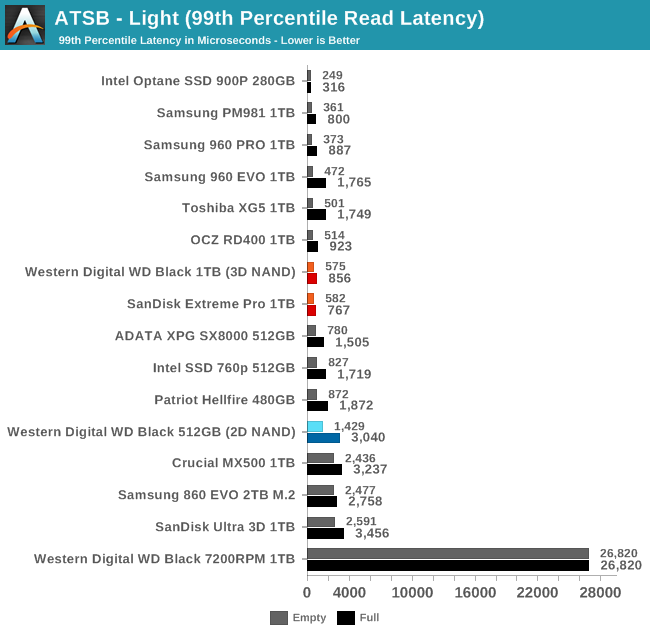
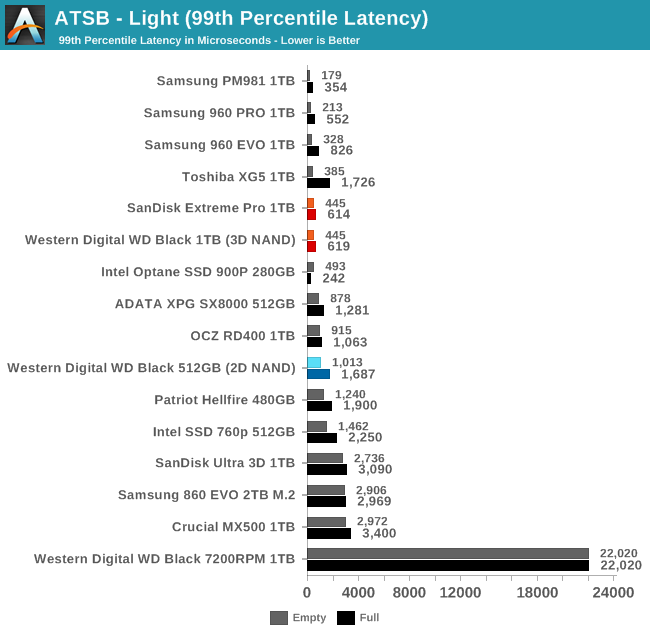
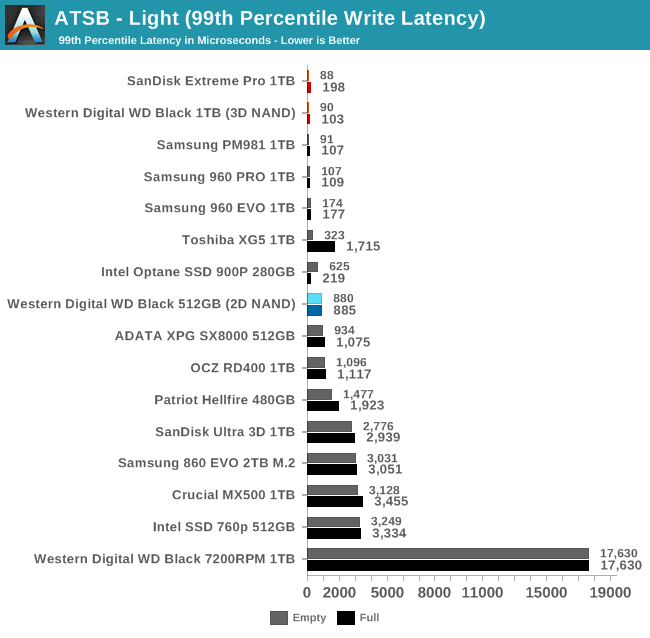 The WD Black offers great 99th percentile write latency on the Light test as its SLC cache never fills. The 99th percentile read latency doesn't rank quite as high, but the full-drive score is very good.
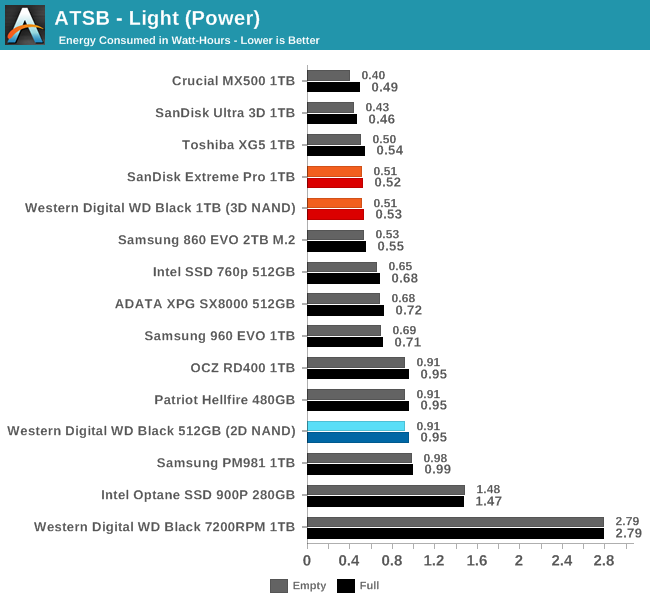
As with the Heavy test, the only NVMe SSD we've tested that can match the WD Black's power efficiency is the Toshiba XG5. These drives get the job done much faster than a SATA drive without using any more energy.
Random Read Performance
Our first test of random read performance uses very short bursts of operations issued one at a time with no queuing. The drives are given enough idle time between bursts to yield an overall duty cycle of 20%, so thermal throttling is impossible. Each burst consists of a total of 32MB of 4kB random reads, from a 16GB span of the disk. The total data read is 1GB.
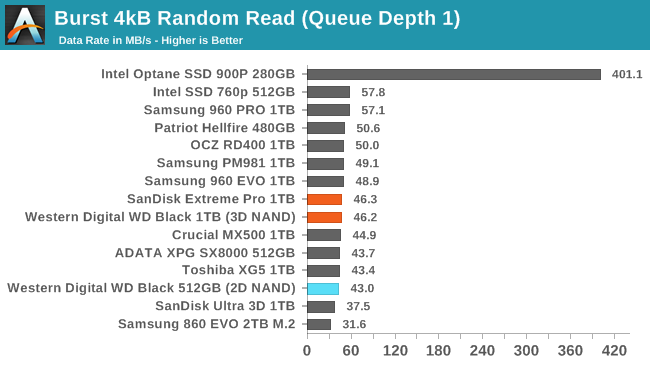
The burst random read performance of the WD Black isn't exceptional, but it is an improvement over the original WD Black SSD and is only slightly behind the Samsung 960 EVO.
Our sustained random read performance is similar to the random read test from our 2015 test suite: queue depths from 1 to 32 are tested, and the average performance and power efficiency across QD1, QD2 and QD4 are reported as the primary scores. Each queue depth is tested for one minute or 32GB of data transferred, whichever is shorter. After each queue depth is tested, the drive is given up to one minute to cool off so that the higher queue depths are unlikely to be affected by accumulated heat build-up. The individual read operations are again 4kB, and cover a 64GB span of the drive.
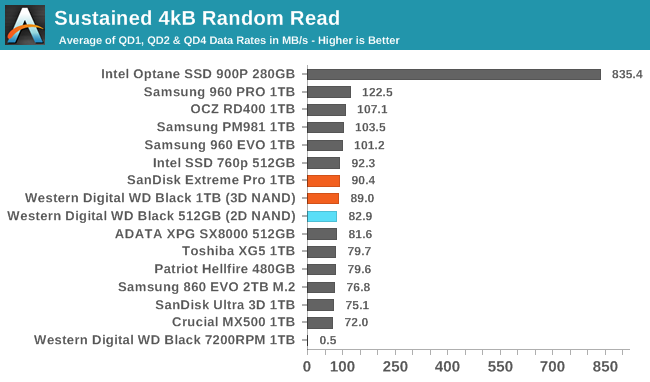
The sustained random read performance of the WD Black is a small improvement over last year's model, but not quite enough to catch up to Samsung. In addition, the recent Intel 760p also comes out slightly ahead of the WD Black.
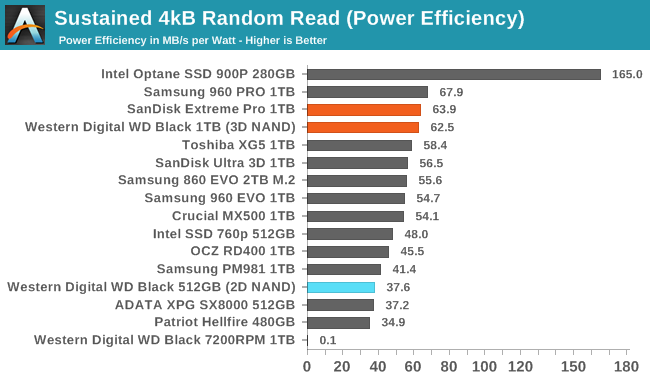 | |||||||||
| Power Efficiency in MB/s/W | Average Power in W | ||||||||
The power efficiency of the WD Black during random reads is better than any other TLC drive as it barely draws any more power than a SATA drive during this test.
Random Write Performance
Our test of random write burst performance is structured similarly to the random read burst test, but each burst is only 4MB and the total test length is 128MB. The 4kB random write operations are distributed over a 16GB span of the drive, and the operations are issued one at a time with no queuing.
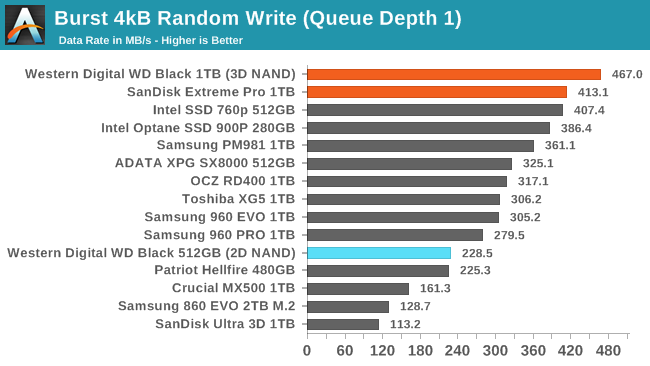
Our WD Black sample oddly returned a substantially better burst random write score than the SanDisk Extreme PRO that should be identical. Since both scores are at the top of the chart, unusually high variance doesn't actually present a problem.
As with the sustained random read test, our sustained 4kB random write test runs for up to one minute or 32GB per queue depth, covering a 64GB span of the drive and giving the drive up to 1 minute of idle time between queue depths to allow for write caches to be flushed and for the drive to cool down.
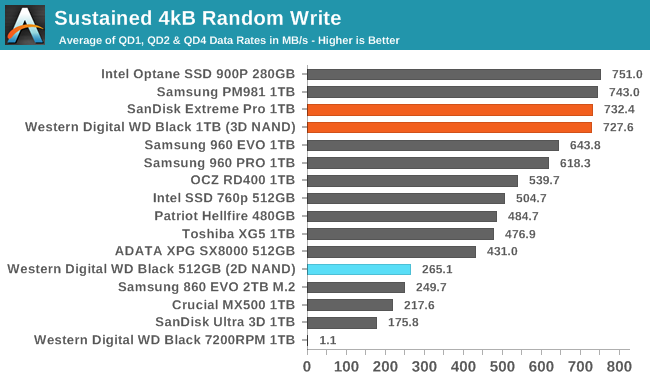
The new WD Black offers top-tier performance on the sustained random write test, well ahead of Samsung's current retail offerings and just barely behind the PM981 OEM drive that Samsung's next generation retail drives will be based upon. Last year's WD Black was just barely faster than SATA drives.
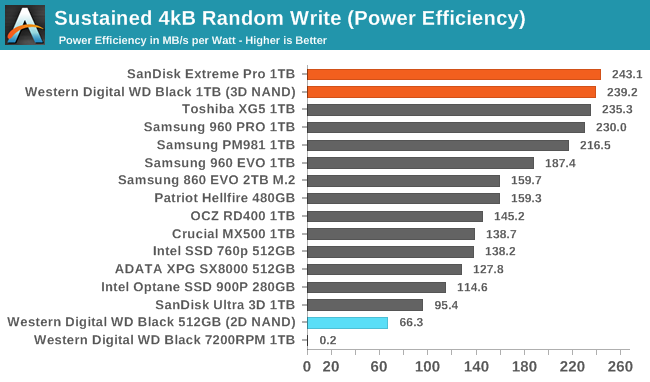 | |||||||||
| Power Efficiency in MB/s/W | Average Power in W | ||||||||
The overhaul of the NAND and the controller has taken the WD Black from the bottom of the efficiency chart with last year's model to the very top, where it has a small lead over the Toshiba XG5 and Samsung 960 PRO.
Sequential Read Performance
Our first test of sequential read performance uses short bursts of 128MB, issued as 128kB operations with no queuing. The test averages performance across eight bursts for a total of 1GB of data transferred from a drive containing 16GB of data. Between each burst the drive is given enough idle time to keep the overall duty cycle at 20%.
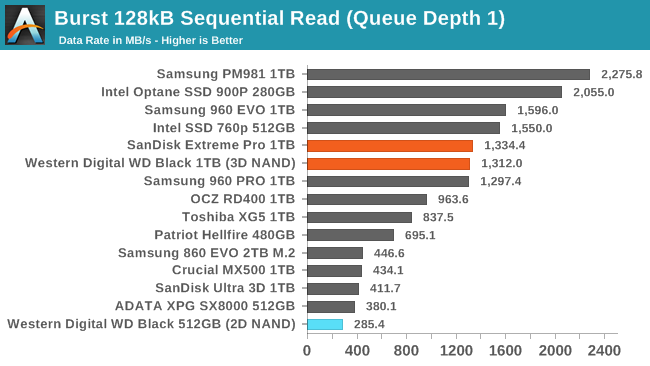
The burst sequential read performance of the WD Black is several times higher than last year's model, but doesn't come close to setting any records.
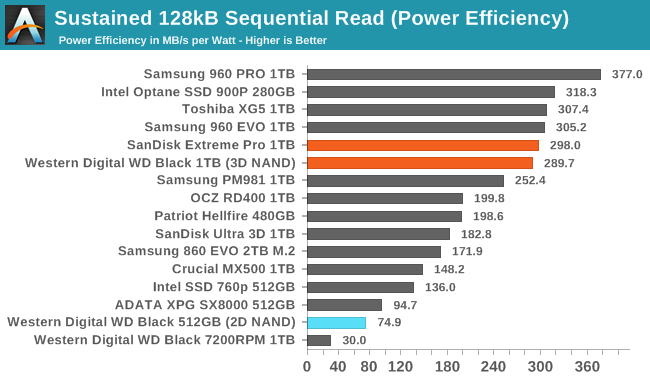
Our test of sustained sequential reads uses queue depths from 1 to 32, with the performance and power scores computed as the average of QD1, QD2 and QD4. Each queue depth is tested for up to one minute or 32GB transferred, from a drive containing 64GB of data.
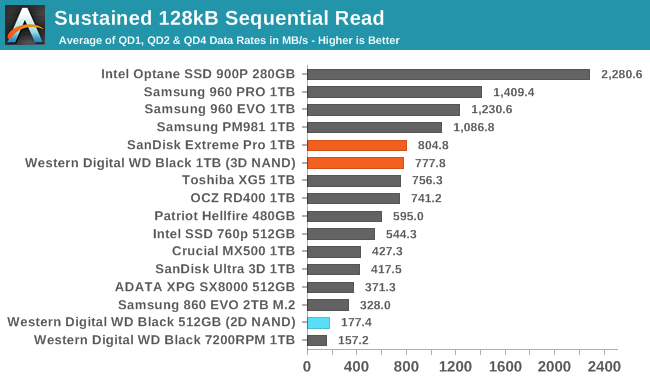
On the sustained sequential read test, the Samsung NVMe drives have a clear lead over the WD Black, which is tied with Toshiba's drives.
 | |||||||||
| Power Efficiency in MB/s/W | Average Power in W | ||||||||
In terms of power efficiency for sequential reads, the WD Black is much closer to the top drives, with the exception of the Samsung 960 PRO.
Sequential Write Performance
Our test of sequential write burst performance is structured identically to the sequential read burst performance test save for the direction of the data transfer. Each burst writes 128MB as 128kB operations issued at QD1, for a total of 1GB of data written to a drive containing 16GB of data.
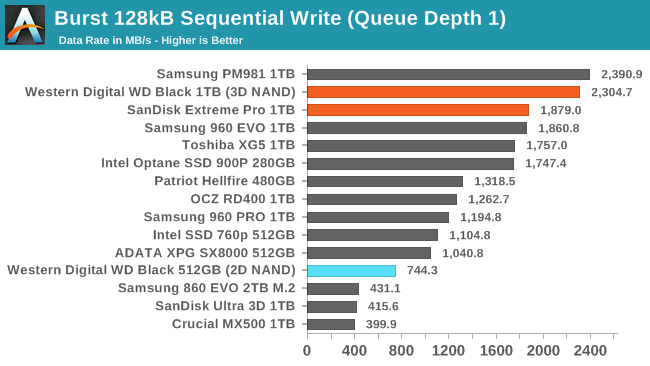
As with the burst random write test, our two samples show surprising differences in burst sequential write speeds. The difference amounts to the WD Black/SanDisk Extreme PRO either being tied for second place with the Samsung 960 EVO, or almost tied with the PM981 that the 960 EVO's replacement will be based on.
Our test of sustained sequential writes is structured identically to our sustained sequential read test, save for the direction of the data transfers. Queue depths range from 1 to 32 and each queue depth is tested for up to one minute or 32GB, followed by up to one minute of idle time for the drive to cool off and perform garbage collection. The test is confined to a 64GB span of the drive.
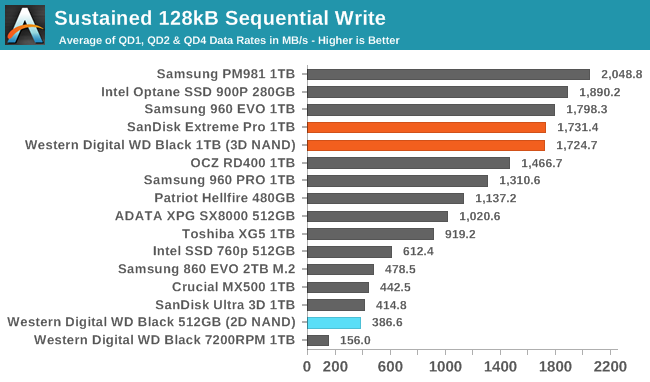
The sustained sequential write performance of the WD Black is not quite the best, but it is well ahead of everything except the best drives from Samsung and Intel. The WD Black is almost twice as fast as the Toshiba XG5 that uses essentially the same flash.
 | |||||||||
| Power Efficiency in MB/s/W | Average Power in W | ||||||||
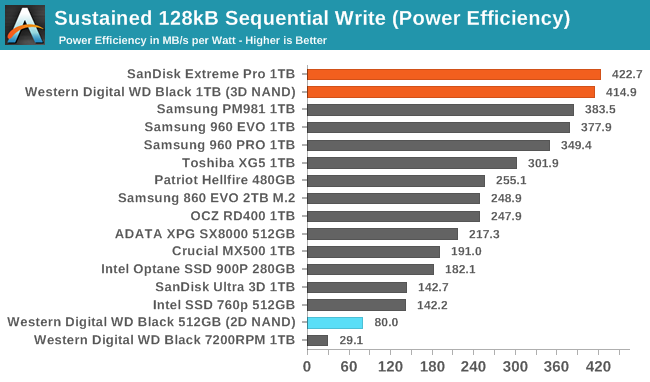
Despite not having the best performance on the sequential write test, the WD Black is the clear winner on the efficiency metric. With power draw of just over 4W it isn't close to being the least power-hungry drive, but it get so much done on that budget that the efficiency score beats everything else.
Mixed Random Performance
Our test of mixed random reads and writes covers mixes varying from pure reads to pure writes at 10% increments. Each mix is tested for up to 1 minute or 32GB of data transferred. The test is conducted with a queue depth of 4, and is limited to a 64GB span of the drive. In between each mix, the drive is given idle time of up to one minute so that the overall duty cycle is 50%.
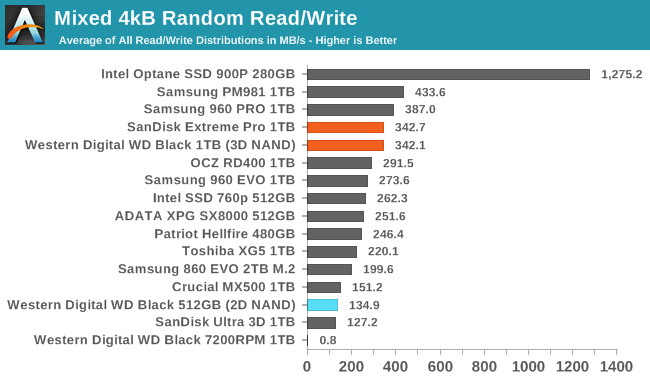
The WD Black offers great mixed random I/O performance, but it is still slightly slower overall than the best drives from Samsung, and the Optane SSD is in an entirely different league.
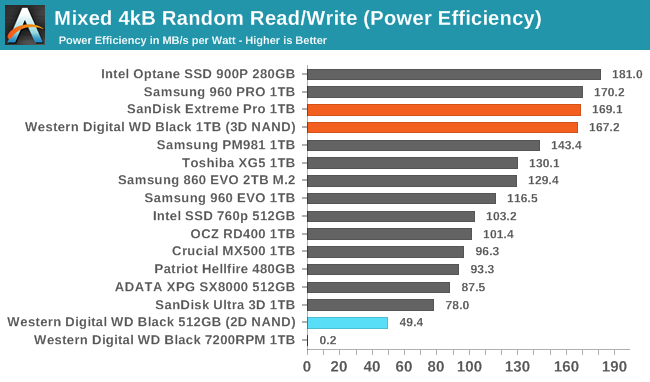 | |||||||||
| Power Efficiency in MB/s/W | Average Power in W | ||||||||
The WD Black's power efficiency on the mixed random I/O test is about the same as that of the Samsung 960 PRO, and close to the Optane SSD in spite of the vast difference in absolute performance level.
Mixed Sequential Performance
Our test of mixed sequential reads and writes differs from the mixed random I/O test by performing 128kB sequential accesses rather than 4kB accesses at random locations, and the sequential test is conducted at queue depth 1. The range of mixes tested is the same, and the timing and limits on data transfers are also the same as above.
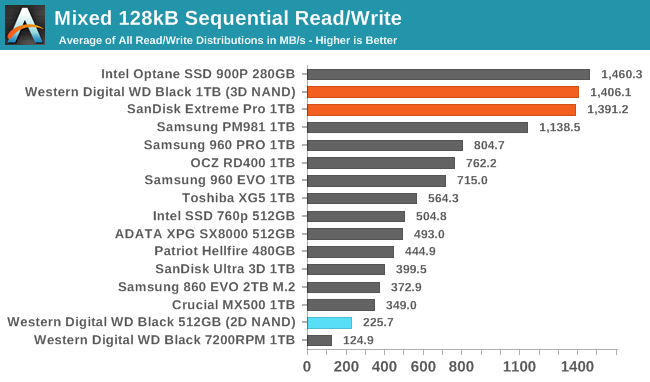
The mixed sequential workload performance of the WD Black is surprisingly good, just barely behind the Optane SSD and far ahead of almost all flash-based SSDs.
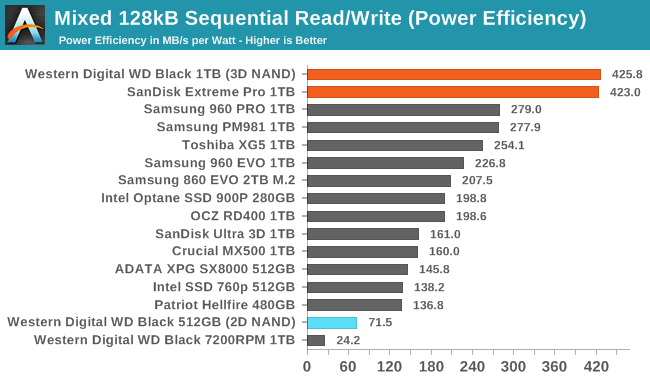 | |||||||||
| Power Efficiency in MB/s/W | Average Power in W | ||||||||
The WD Black draws about the same power as other SSDs during the mixed sequential test, and combined with the great performance that translates to a huge lead in power efficiency.
Power Management
Real-world client storage workloads leave SSDs idle most of the time, so the active power measurements presented earlier in this review only account for a small part of what determines a drive's suitability for battery-powered use. Especially under light use, the power efficiency of a SSD is determined mostly be how well it can save power when idle.
SATA SSDs are tested with SATA link power management disabled to measure their active idle power draw, and with it enabled for the deeper idle power consumption score and the idle wake-up latency test. Our testbed, like any ordinary desktop system, cannot trigger the deepest DevSleep idle state.
Idle power management for NVMe SSDs is far more complicated than for SATA SSDs. NVMe SSDs can support several different idle power states, and through the Autonomous Power State Transition (APST) feature the operating system can set a drive's policy for when to drop down to a lower power state. There is typically a tradeoff in that lower-power states take longer to enter and wake up from, so the choice about what power states to use may differ for desktop and notebooks.
We report two idle power measurements. Active idle is representative of a typical desktop, where none of the advanced PCIe link or NVMe power saving features are enabled and the drive is immediately ready to process new commands. The idle power consumption metric is measured with PCIe Active State Power Management L1.2 state enabled and NVMe APST enabled.
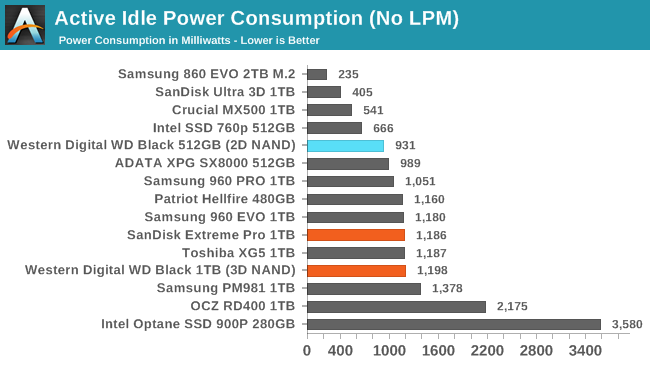
Like most NVMe SSDs, the WD Black has a fairly high active idle power draw—the cost of keeping a PCIe 3 x4 link active. The active idle power is a bit higher than the previous WD Black SSD but is in line with drives from Samsung, Toshiba and Phison.
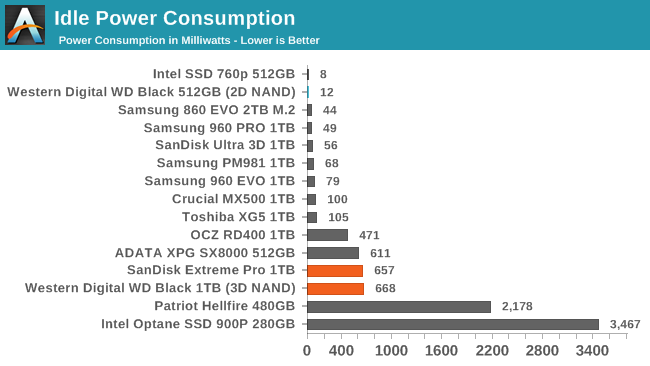
Enabling all the advanced PCIe and NVMe power management features doesn't have the desired effect on the WD Black SSD. The drops by almost half, but it should have dropped by at least an order of magnitude. The original WD Black SSD used aggressive power management whether or not the operating system requested it. The new WD Black seems to be unable to save much power when used on our desktop testbed, no matter what NVMe power states are requested. We will work with Western Digital to try to isolate the cause of this poor behavior. In the meantime, the WD Black is hardly the only NVMe drive where power management has problems out of the box, but Intel and Samsung have managed to produce drives that achieve very low idle power on our testbed with little or no tuning required.
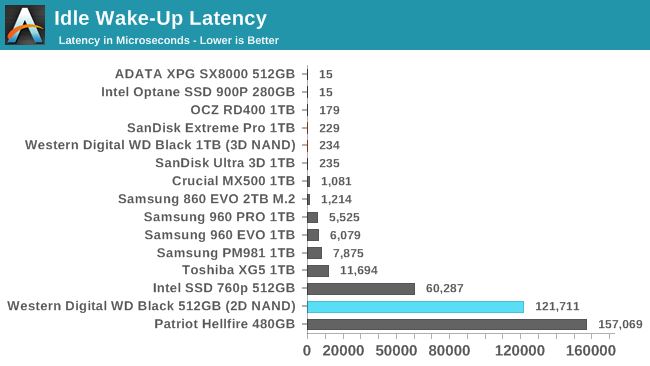
Since the WD Black is clearly unable to engage its full array of power management capabilities on our testbed, it is unsurprising to see that its wake-up latency is quite short. It is not the minimal ~15µs we usually observe from drives that aren't enabling any power savings at all, but ~230µs is still a very quick wake-up from sleep.
출처 - https://www.anandtech.com