


 ' alt='위대한 인류최대 수퍼로켓 '스타십(Spacex Starship)' 발사 성공 by 인공지능' />

’ 오픈<br>")


<br>")

, 전세계 일자리 파괴 가속화 “육체노동만 살아남나?”<br>")
<br>")

![삼성, 잃어버린 10년 [풀영상] | 창 458회 (KBS 24.03.12) by 인공지능](https://raptor-hw.net/xe/files/thumbnails/453/204/271x205.crop.jpg "삼성, 잃어버린 10년 [풀영상] | 창 458회 (KBS 24.03.12)<br>")
 다운로드 및 설치<br>")


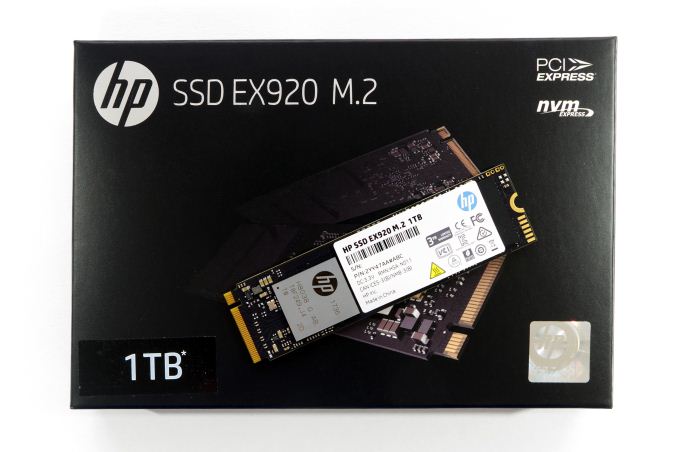
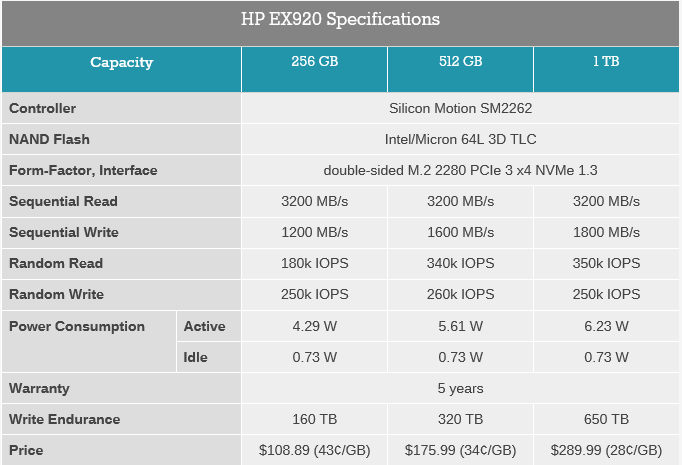
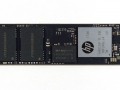
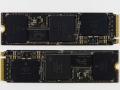
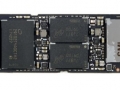
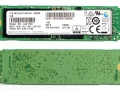
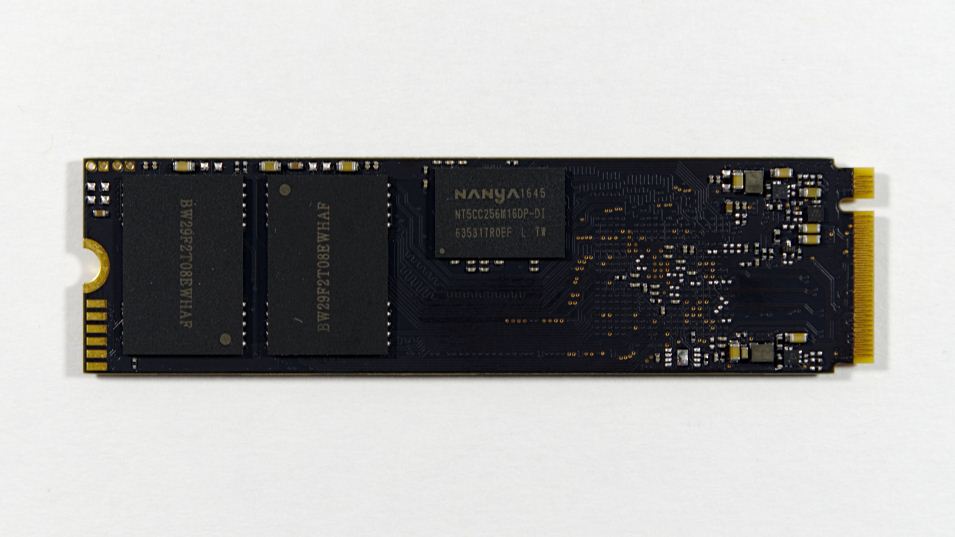
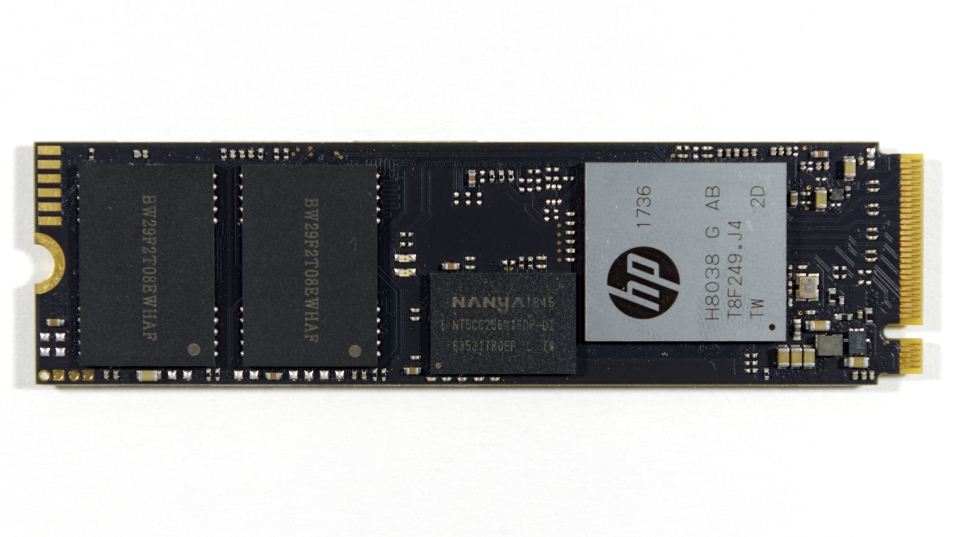
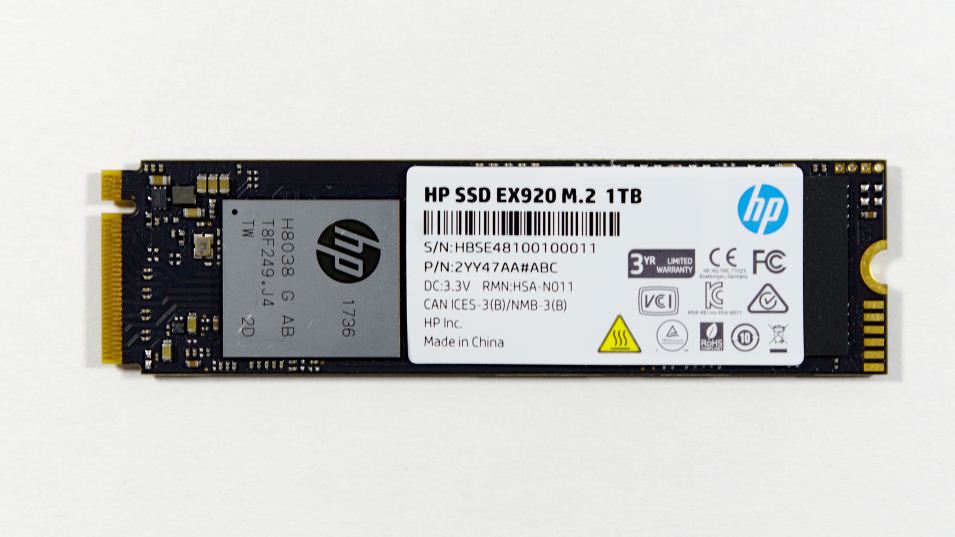
HP 브랜드 EX920 M.2 SSD 스펙
컨트롤러 : 실리콘 모션 SM2262
낸드플래시 : 인텔 마이크론 64층 3D TLC
시퀀셜 읽기 : 3200MB/s - 3200MB/s - 3200MB/s
시퀀셜 쓰기 : 1200MB/s - 1600MB/s - 1800MB/s
랜덤 읽기 : 180k IOPS - 340k IOPS - 350k IOPS
랜덤 쓰기 : 250k IOPS - 260k IOPS - 250k IOPS
벤치마크 테스트 시스템
| AnandTech 2018 Consumer SSD Testbed | |
| CPU | Intel Xeon E3 1240 v5 |
| Motherboard | ASRock Fatal1ty E3V5 Performance Gaming/OC |
| Chipset | Intel C232 |
| Memory | 4x 8GB G.SKILL Ripjaws DDR4-2400 CL15 |
| Graphics | AMD Radeon HD 5450, 1920x1200@60Hz |
| Software | Windows 10 x64, version 1709 |
| Linux kernel version 4.14, fio version 3.6 | |
| Spectre/Meltdown microcode and OS patches current as of May 2018 | |
AnandTech Storage Bench - The Destroyer
The Destroyer is an extremely long test replicating the access patterns of very IO-intensive desktop usage. A detailed breakdown can be found in this article. Like real-world usage, the drives do get the occasional break that allows for some background garbage collection and flushing caches, but those idle times are limited to 25ms so that it doesn't take all week to run the test. These AnandTech Storage Bench (ATSB) tests do not involve running the actual applications that generated the workloads, so the scores are relatively insensitive to changes in CPU performance and RAM from our new testbed, but the jump to a newer version of Windows and the newer storage drivers can have an impact.
We quantify performance on this test by reporting the drive's average data throughput, the average latency of the I/O operations, and the total energy used by the drive over the course of the test.
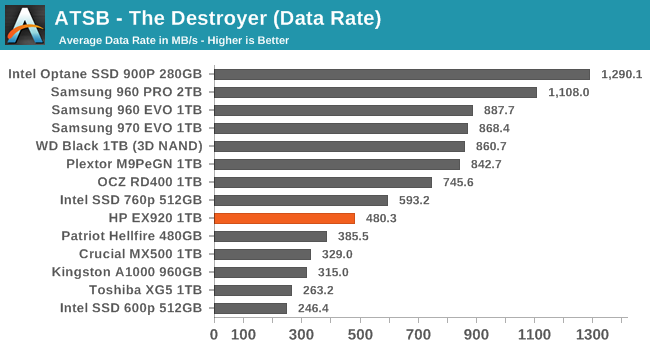
The average data rate from the 1TB HP EX920 on The Destroyer is a bit disappointing, falling below the lower-capacity Intel 760p and only a little over half as fast as current 1TB high-end NVMe SSDs. The EX920 is still substantially faster than SATA SSDs or low-end NVMe SSDs like the Phison E8-based Kingston A1000, but the EX920 is definitely not in the same league as Samsung's drives or the current WD Black.
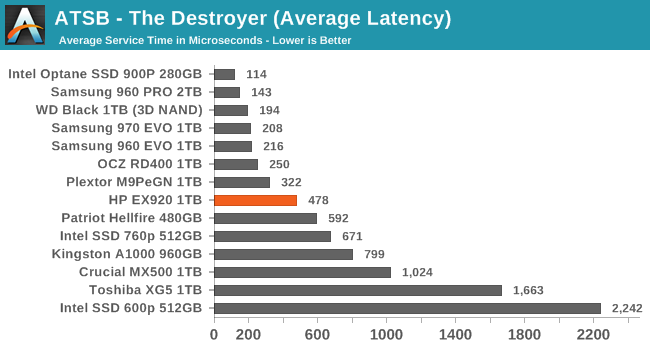
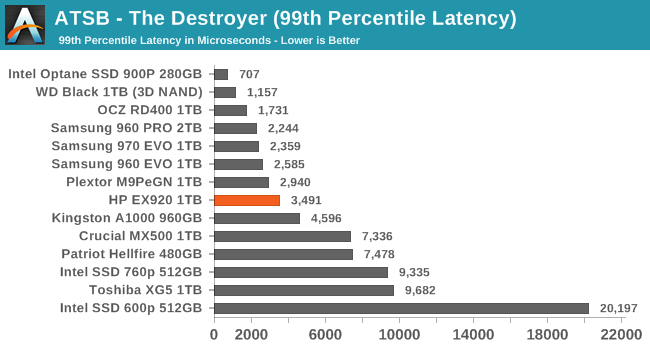
The average and 99th percentile latency scores from the HP EX920 cast the drive in a slightly better light than the average data rate did, but it is still falling short of the high-end NVMe drives. The EX920 scores better than the smaller Intel 760p on these two metrics, even though the Intel drive delivered a higher average data rate.
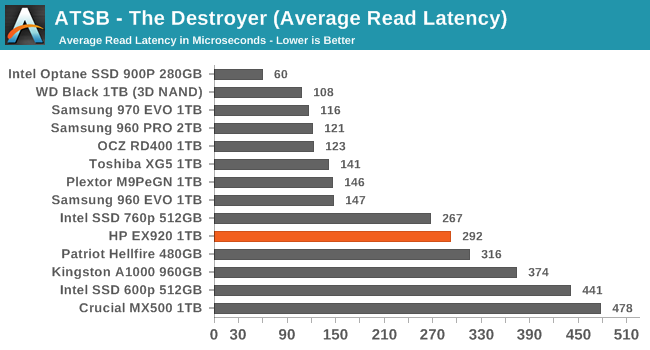
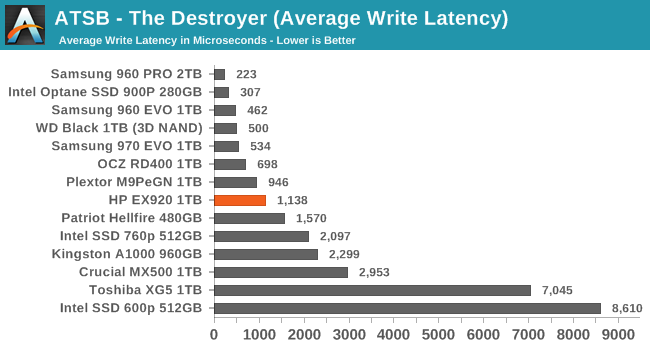
The HP EX920's average read latency is about twice as high as the high-end NVMe SSDs. The average write latency of the EX920 is also worse than the Samsung drives and WD Black by about the same factor, but the boundary for the top tier of drives is not as sharp since the Plextor M9Pe and the aging Toshiba OCZ RD400 are also lagging behind some.
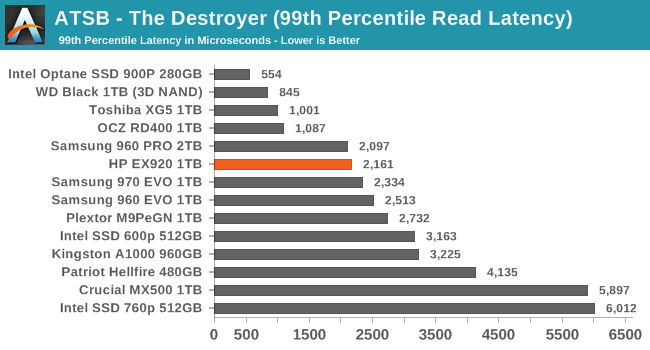
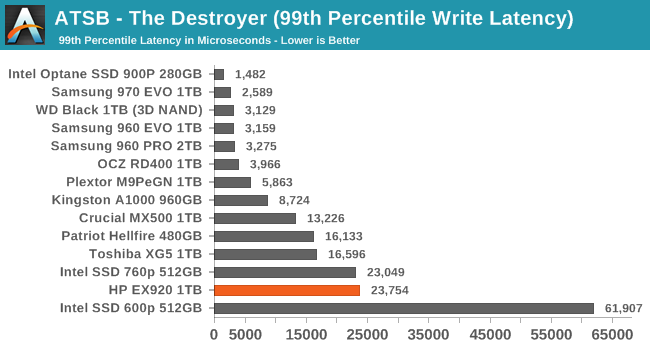
The 99th percentile read latency of the HP EX920 is decent, though it could also be said that this is simply a matter of Samsung's drives being uncharacteristically unimpressive while the WD Black sets a high standard. The 99th percentile write latency of the EX920 is clearly a problem, with more than 40% higher latency than any drive in this bunch that isn't using a Silicon Motion controller. The EX920 and Intel 760p fare much better than the previous generation Intel 600p thanks to improvements to both the flash and the controller, but it is clear that Silicon Motion still needs to work of their QoS.
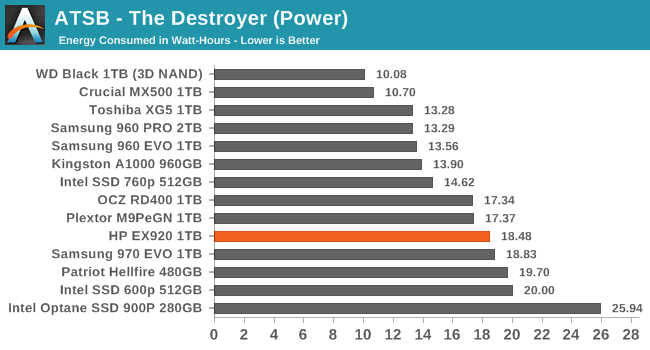
The energy usage of the HP EX920 when running The Destroyer is a bit on the high side by M.2 NVMe SSD standards, but it doesn't stand out from other power-hungry drives including the Samsung 970 EVO. Unlike the 970 EVO, the EX920 doesn't justify its high power consumption with high performance, though even the 970 EVO's power consumption is hard to excuse when the WD Black offers the same performance for a little over half of the energy usage. NVMe power efficiency is still a work in progress for the industry as a whole.
Random Read Performance
Our first test of random read performance uses very short bursts of operations issued one at a time with no queuing. The drives are given enough idle time between bursts to yield an overall duty cycle of 20%, so thermal throttling is impossible. Each burst consists of a total of 32MB of 4kB random reads, from a 16GB span of the disk. The total data read is 1GB.
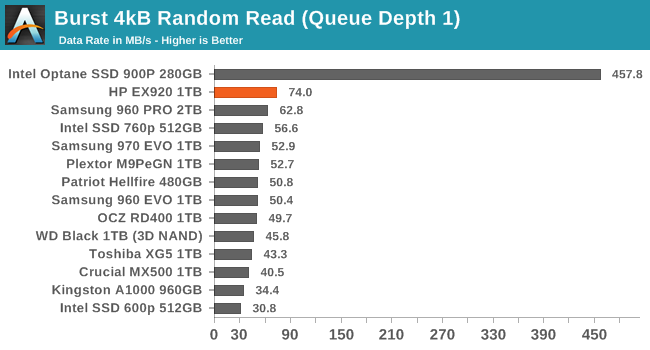
The HP EX920 surprises with a new record high burst random read performance from a flash-based SSD. It's still nothing compared Intel's Optane SSDs, but it's a substantial improvement over the competition. Even the MLC-based drives can't beat the EX920 on this test.
Our sustained random read performance is similar to the random read test from our 2015 test suite: queue depths from 1 to 32 are tested, and the average performance and power efficiency across QD1, QD2 and QD4 are reported as the primary scores. Each queue depth is tested for one minute or 32GB of data transferred, whichever is shorter. After each queue depth is tested, the drive is given up to one minute to cool off so that the higher queue depths are unlikely to be affected by accumulated heat build-up. The individual read operations are again 4kB, and cover a 64GB span of the drive.
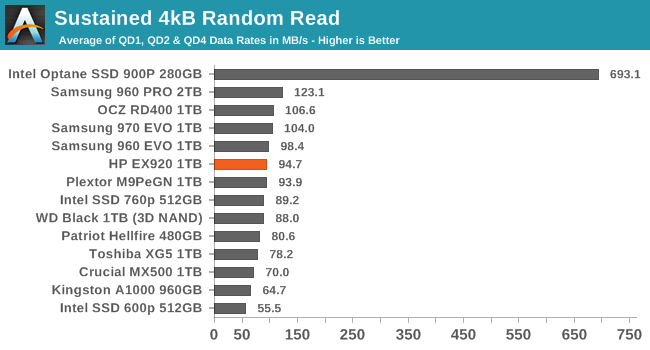
On the longer random read test, the HP EX920 no longer stands out, but it's securely within the high-end performance bracket and isn't too far behind the fastest TLC SSD.
 | |||||||||
| Power Efficiency in MB/s/W | Average Power in W | ||||||||
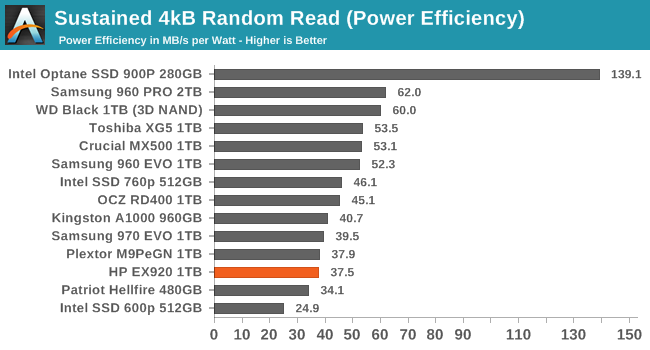
The power efficiency of the EX920 during the sustained random read test is poor, but the Samsung 970 EVO's score is almost as bad. Both drives need to improve a lot to match the WD Black or even the Toshiba XG5, which are a bit slower but draw a full 1W less power during the test.
Random Write Performance
Our test of random write burst performance is structured similarly to the random read burst test, but each burst is only 4MB and the total test length is 128MB. The 4kB random write operations are distributed over a 16GB span of the drive, and the operations are issued one at a time with no queuing.
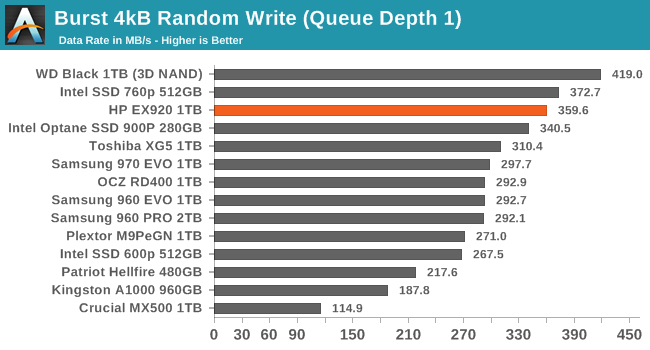
The burst random write performance of the HP EX920 isn't quite the fastest we've measured, but it's still excellent. The Intel 760p managed a few percent faster with the same controller, but it's the WD Black that currently seems to have the fastest SLC write cache.
As with the sustained random read test, our sustained 4kB random write test runs for up to one minute or 32GB per queue depth, covering a 64GB span of the drive and giving the drive up to 1 minute of idle time between queue depths to allow for write caches to be flushed and for the drive to cool down.
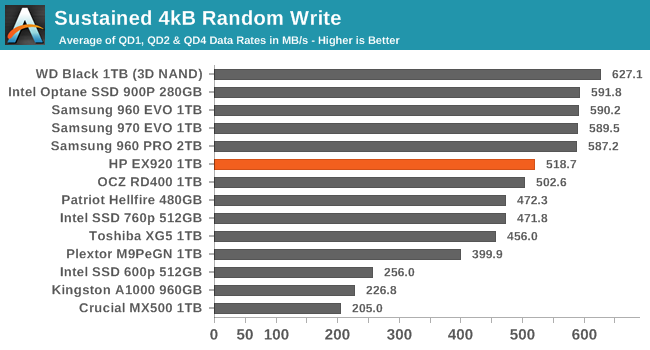
On the longer random write test, the HP EX920 isn't quite in the top tier of drives, but it still performs better than most of the older high-end NVMe SSDs like the RD400 and XG5.
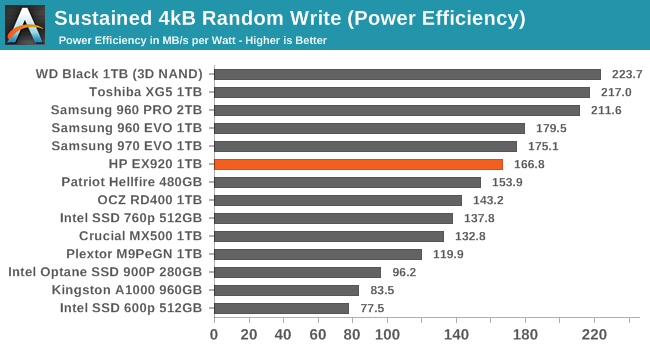 | |||||||||
| Power Efficiency in MB/s/W | Average Power in W | ||||||||
The power efficiency of the HP EX920 during the sustained random write test is good, but can't compete with the WD Black and Toshiba XG5. It's still a huge improvement over Silicon Motion's previous generation as represented here by the Intel 600p.
Sequential Read Performance
Our first test of sequential read performance uses short bursts of 128MB, issued as 128kB operations with no queuing. The test averages performance across eight bursts for a total of 1GB of data transferred from a drive containing 16GB of data. Between each burst the drive is given enough idle time to keep the overall duty cycle at 20%.
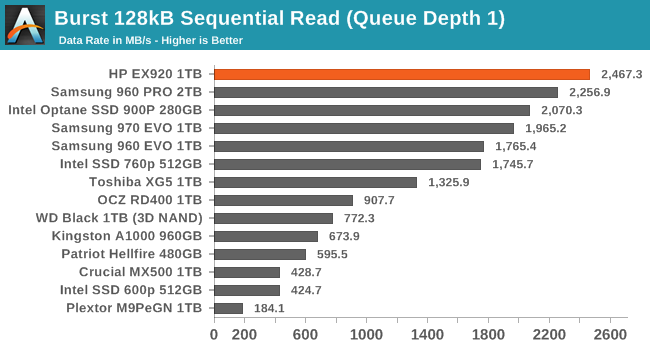
The HP EX920 breaks another record by delivering burst sequential read speeds of almost 2.5GB/s, when no other TLC-based SSD we've tested has yet hit 2GB/s on this test. The EX920 is even beating the MLC and 3D XPoint-based drives on this test.
Our test of sustained sequential reads uses queue depths from 1 to 32, with the performance and power scores computed as the average of QD1, QD2 and QD4. Each queue depth is tested for up to one minute or 32GB transferred, from a drive containing 64GB of data. This test is run twice: once with the drive prepared by sequentially writing the test data, and again after the random write test has mixed things up, causing fragmentation inside the SSD that isn't visible to the OS. These two scores represent the two extremes of how the drive would perform under real-world usage, where wear leveling and modifications to some existing data will create some internal fragmentation that degrades performance, but usually not to the extent shown here.
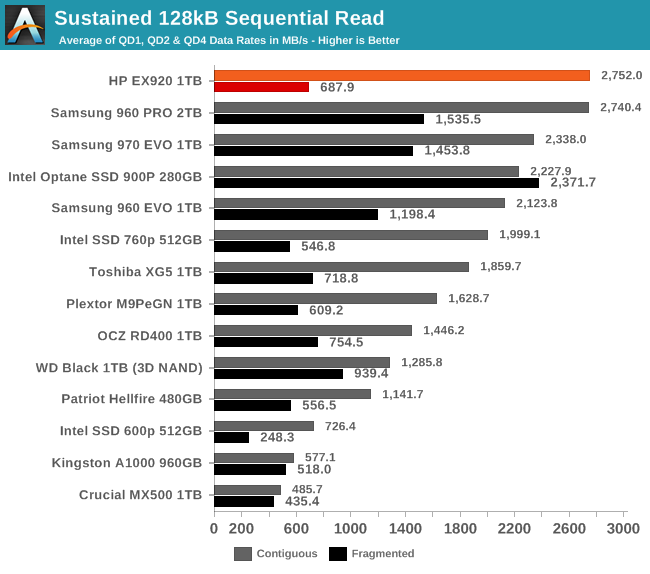
On the longer sequential read test with higher queue depths, the Samsung 960 PRO catches up to the EX920 and Samsung's TLC-based competitors come close. However, this only applies to a clean drive and data that was written sequentially. When the data has been fragmented by random writes, the sequential read speed of the EX920 drops by a lot, leaving it merely average and much slower than the Samsung drives (or the Optane SSD that is immune to this form of fragmentation).
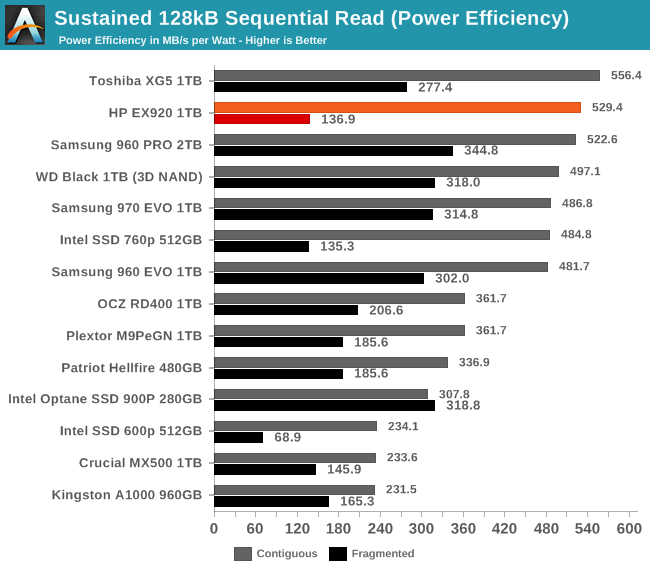 | |||||||||
| Power Efficiency in MB/s/W | Average Power in W | ||||||||
With such high sequential read performance on a clean drive, it's no surprise to see the HP EX920 near the top of the efficiency chart, even though the drive is pulling more than 5W. On fragmented data the EX920 ends up worse off than any drive that isn't using a Silicon Motion controller, because the sequential read speed tanks while power consumption remains about the same.
Sequential Write Performance
Our test of sequential write burst performance is structured identically to the sequential read burst performance test save for the direction of the data transfer. Each burst writes 128MB as 128kB operations issued at QD1, for a total of 1GB of data written to a drive containing 16GB of data.
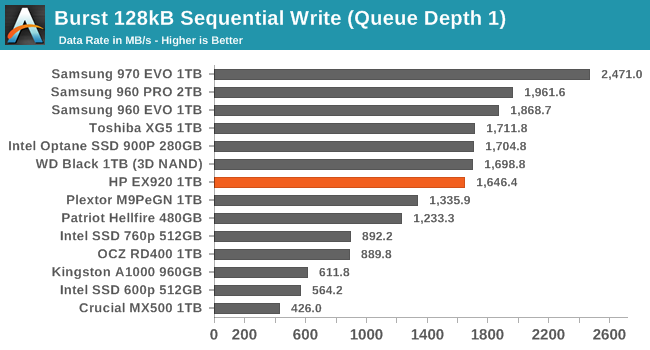
The burst sequential write speed of the HP EX920 is great, but it is overshadowed a bit by the large lead Samsung's 970 EVO has on this test.
Our test of sustained sequential writes is structured identically to our sustained sequential read test, save for the direction of the data transfers. Queue depths range from 1 to 32 and each queue depth is tested for up to one minute or 32GB, followed by up to one minute of idle time for the drive to cool off and perform garbage collection. The test is confined to a 64GB span of the drive.
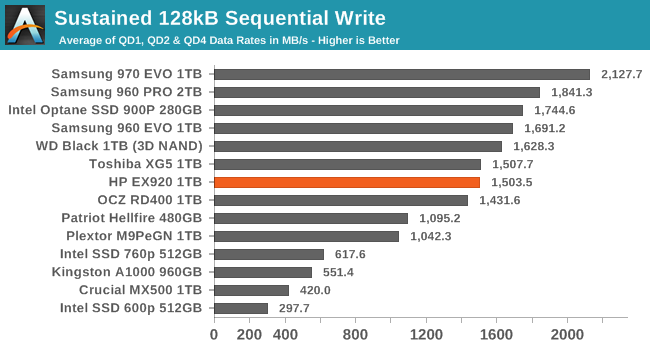
On the longer sequential write test, the HP EX920 falls a bit further behind as the scores of the top-tier drives are a bit more spread out than for the burst test. The EX920 is still providing performance that is worthy of a high-end NVMe SSD, but it can't match Samsung or WD.
 | |||||||||
| Power Efficiency in MB/s/W | Average Power in W | ||||||||
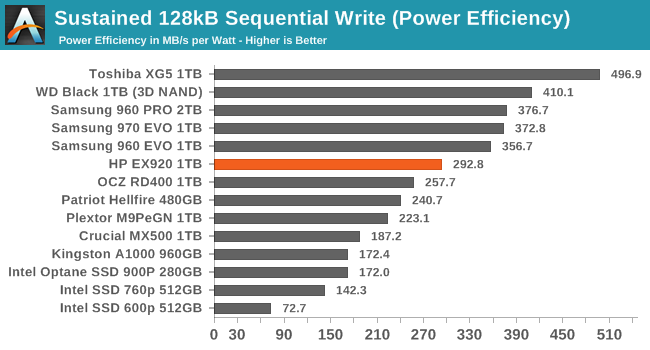
The power efficiency of the HP EX920 on the sustained sequential write test is good, but several drives deliver higher performance while drawing less power, and the 970 EVO offers substantially higher performance with only slightly higher power draw. The most efficient drive is still the Toshiba XG5, which performs the same as the EX920 on this test but draws only 3W while the EX920 requires more than 5W.
Mixed Random Performance
Our test of mixed random reads and writes covers mixes varying from pure reads to pure writes at 10% increments. Each mix is tested for up to 1 minute or 32GB of data transferred. The test is conducted with a queue depth of 4, and is limited to a 64GB span of the drive. In between each mix, the drive is given idle time of up to one minute so that the overall duty cycle is 50%.
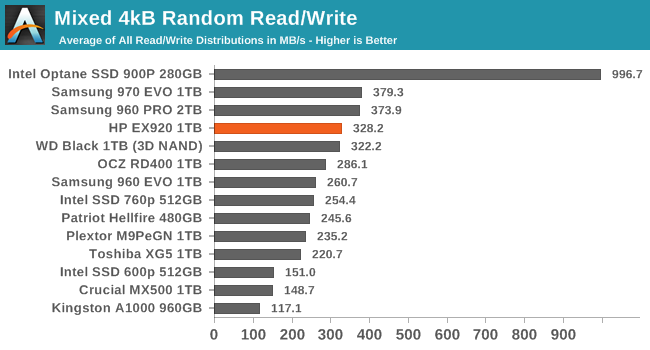
None of the flash-based SSDs can come close to the performance of Intel's Optane SSDs on the mixed random I/O test. But setting that aside and looking only at the drives that are priced close enough to be in direct competition, the HP EX920's performance is great: it narrowly beats the WD Black and is surpassed only by Samsung's top drives. The 1TB EX920 is substantially faster than the smaller Intel 760p and more than twice as fast as the Crucial MX500 SATA SSD.
 | |||||||||
| Power Efficiency in MB/s/W | Average Power in W | ||||||||
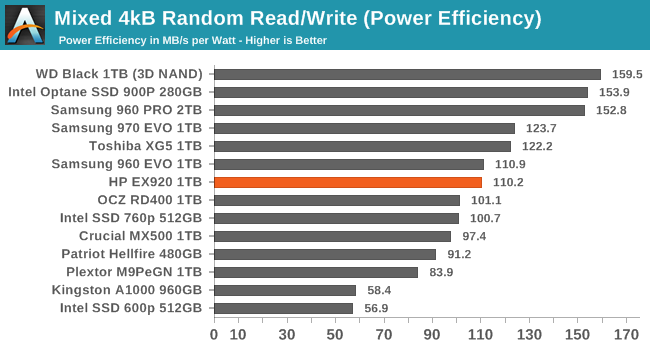
The power efficiency of the EX920 during the mixed random I/O test is nothing special. As with many other tests, the HP draws more power than most drives, leading to poor efficiency when it can't also deliver top performance. The WD Black offers about the same performance with a 2W power draw instead of the 3W the HP requires, which allows the WD Black to beat even the super-fast Optane SSD for efficiency.
Mixed Sequential Performance
Our test of mixed sequential reads and writes differs from the mixed random I/O test by performing 128kB sequential accesses rather than 4kB accesses at random locations, and the sequential test is conducted at queue depth 1. The range of mixes tested is the same, and the timing and limits on data transfers are also the same as above.
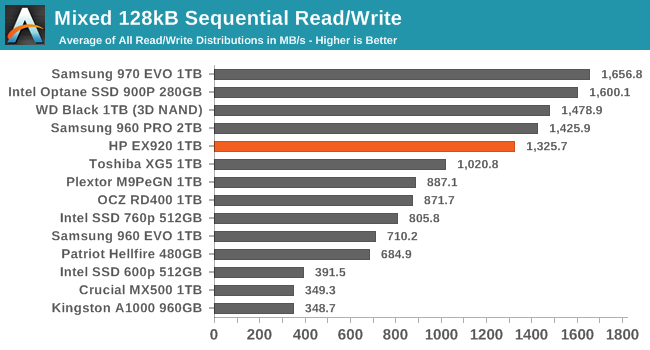
The HP EX920 doesn't offer the fastest performance on the mixed sequential I/O test, but it does maintain an average that's well above 1GB/s and close enough to the top drives that the difference would be barely noticeable without our benchmarking tools. The EX920 is substantially faster than drives like the Toshiba XG5 and Plextor M9Pe that also use 64L 3D TLC, and it's almost four times faster than the Crucial MX500 SATA SSD.
 | |||||||||
| Power Efficiency in MB/s/W | Average Power in W | ||||||||
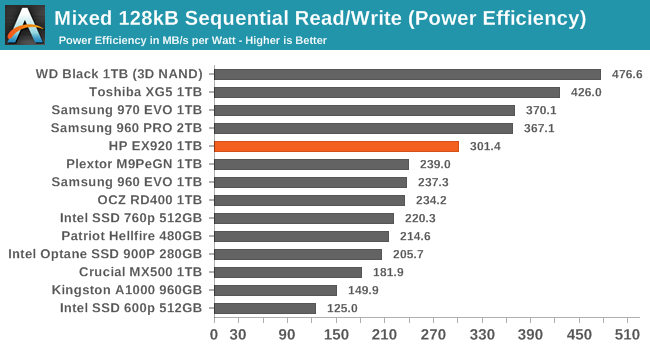
As usual, the HP EX920 draws quite a bit of power-almost as much as the Samsung 970 EVO. Since the EX920 doesn't offer quite the same level of performance, its efficiency score suffers but remains ahead of the older generation of high-end NVMe SSDs.