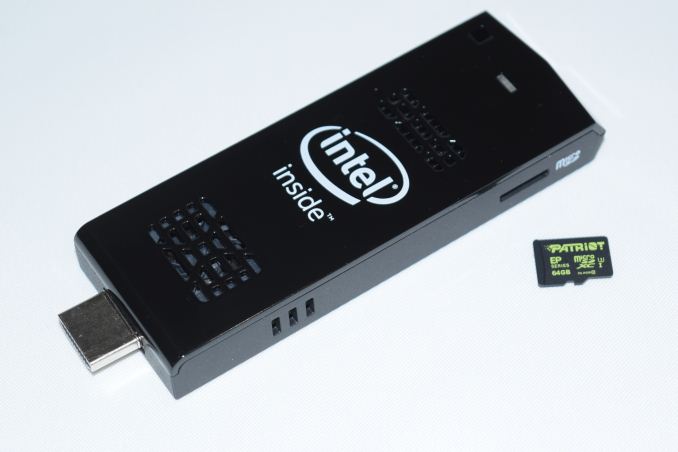
인텔의 초소형 PC, 컴퓨트 스틱의 어낸드텍 리뷰
| Intel PPSTCK1A32WFC Specifications | |
| Processor | Intel Atom Z3735F (4C/4T x 1.33 GHz, 22nm, 2MB L2, 2.2W SDP) |
| Memory | 1x 2GB DDR3L-1333 C9 |
| Graphics | Intel HD Graphics |
| Disk Drive(s) | Samsung MBG4GC 32 GB eMMC |
| Networking | 1x1 Realtek RTL8723BS 802.11n W-Fi |
| Audio | Capable of 5.1/7.1 digital output with HD audio bitstreaming (HDMI) |
| Operating System | Windows 8.1 with Bing x86 |
| Pricing (As configured) | USD 150 |
| Full Specifications | Intel PPSTCK1A32WFC Specifications |
컴퓨트 스틱의 메인 프로세서는 인텔 베이트레일 아톰 Z3735F(4코어 4스레드,1.33GHz, 22나노, 2MB L2, 2.2W SDP), 메모리 2GB (DDR3L-1333 C9), 인텔 HD 그래픽, 삼성 32GB eMMC, 리얼텍 와이파이, 윈도우8.1, 가격 150달러

구성품 - 본체, 케이블, 변환기, 어댑터 등
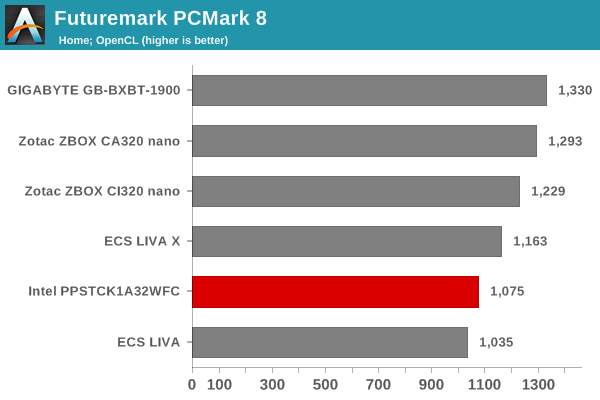
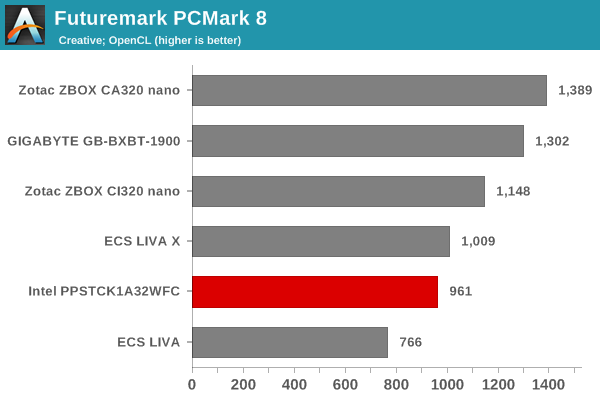
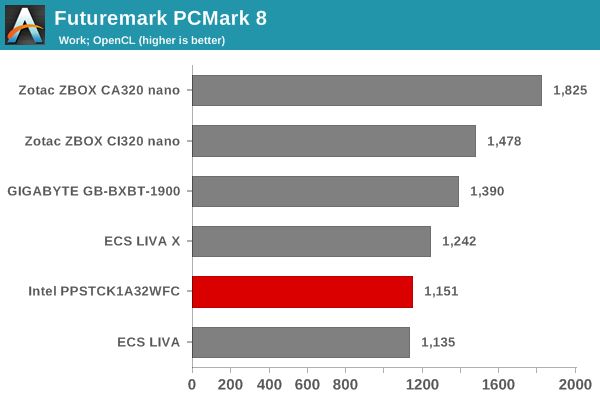
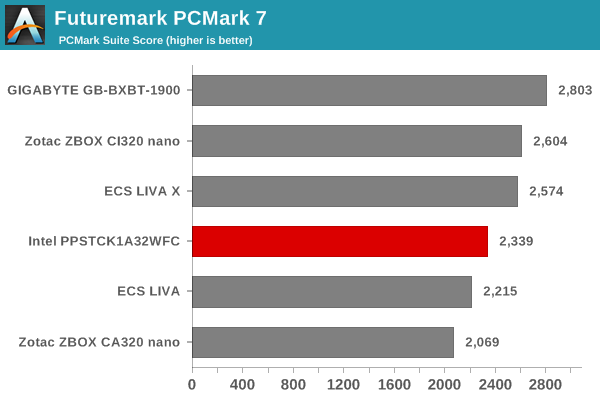
Miscellaneous Futuremark Benchmarks
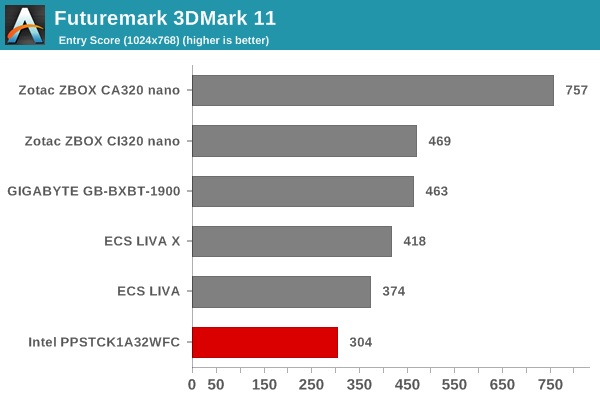
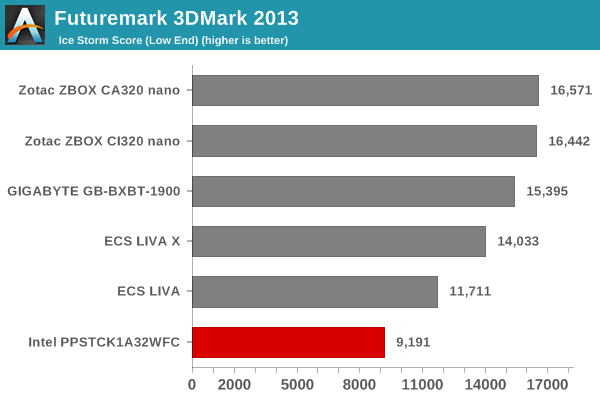
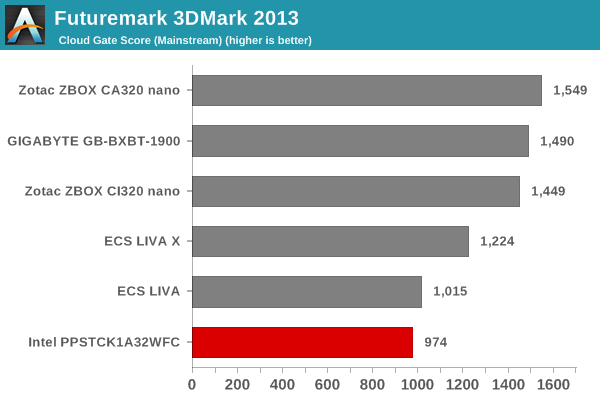
In the other Futuremark benchmarks evaluating 3D performance, we find the Compute Stick coming in last - this was to be expected, given that the GPU is clocked low at 311 MHz and also happens to operate mostly in the thermal limits put in place for a tablet platform.
We now move on to look at the benchmark modes in programs used on a day-to-day basis, i.e, application performance and not synthetic workloads.
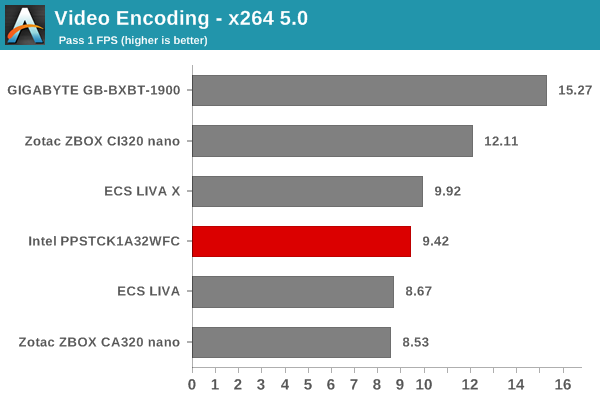
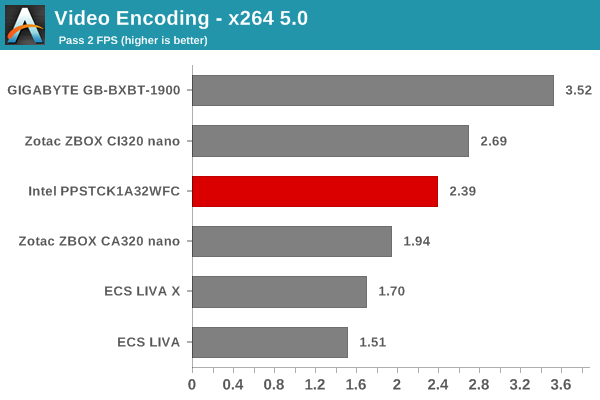
x264 Benchmark
First off, we have some video encoding benchmarks courtesy of x264 HD Benchmark v5.0. This is simply a test of CPU performance. The Compute Stick manages to score better than the ECS LIVA in most of these tests thanks to the four cores (compared to the two in the latter).
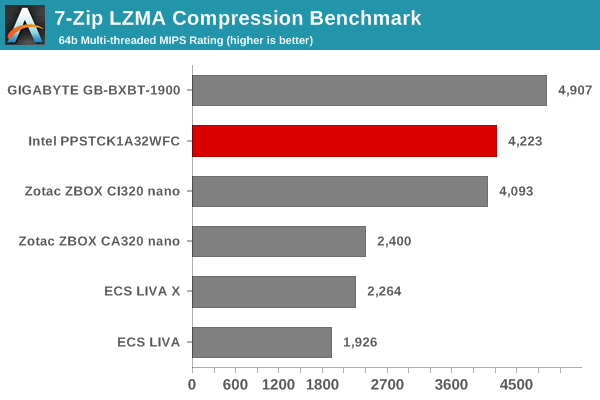
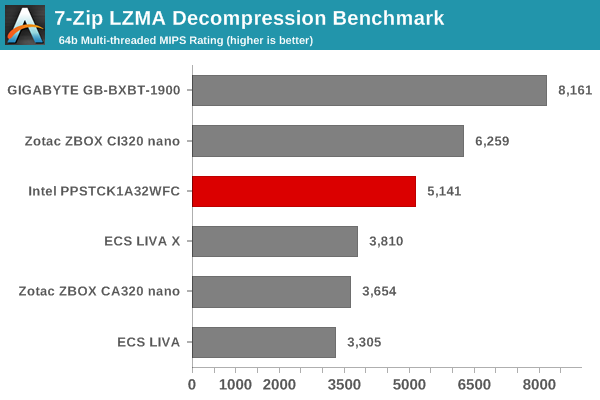
7-Zip
7-Zip is a very effective and efficient compression program, often beating out OpenCL accelerated commercial programs in benchmarks even while using just the CPU power. 7-Zip has a benchmarking program that provides tons of details regarding the underlying CPU's efficiency. In this subsection, we are interested in the compression and decompression MIPS ratings when utilizing all the available threads. Again, the advantages of a quad-core SoC come through.
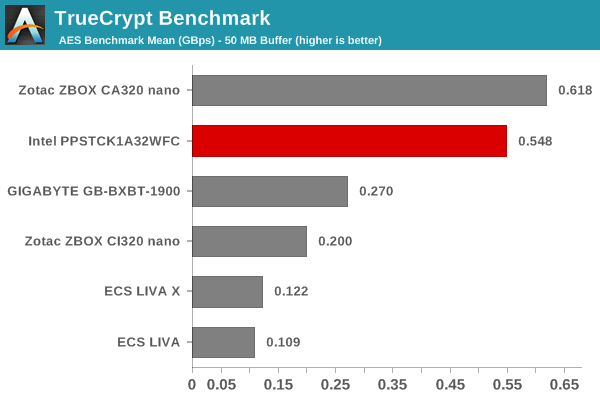
TrueCrypt
As businesses (and even home consumers) become more security conscious, the importance of encryption can't be overstated. CPUs supporting the AES-NI instruction for accelerating the encryption and decryption processes have, till now, been the higher end SKUs. However, with Bay Trail, even the lowly Atom series has gained support for AES-NI. It is quite unlikely that any usage scenario for the Compute Stick is going to involve extensive encryption capabilities. However, the presence of AES-NI support in the Compute Stick's SoC piqued our interest.
TrueCrypt, a popular open-source disk encryption program can take advantage of AES-NI. Its internal benchmark provides some interesting cryptography-related numbers to ponder. In the graph below, we can get an idea of how fast a TrueCrypt volume would behave in the Intel PPSTCK1A32WFC and how it would compare with other select PCs. This is a purely CPU feature / clock speed based test. Interestingly, the Atom Z3735F is the only Bay Trail SoC in the graph below to have AES-NI capabilities.
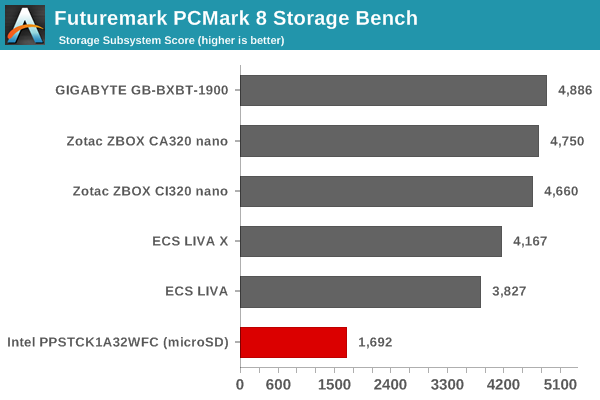
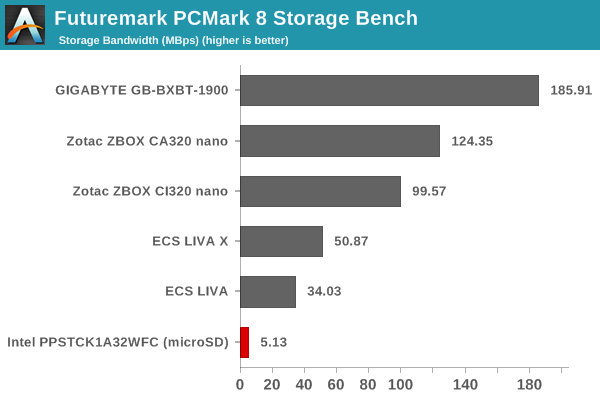
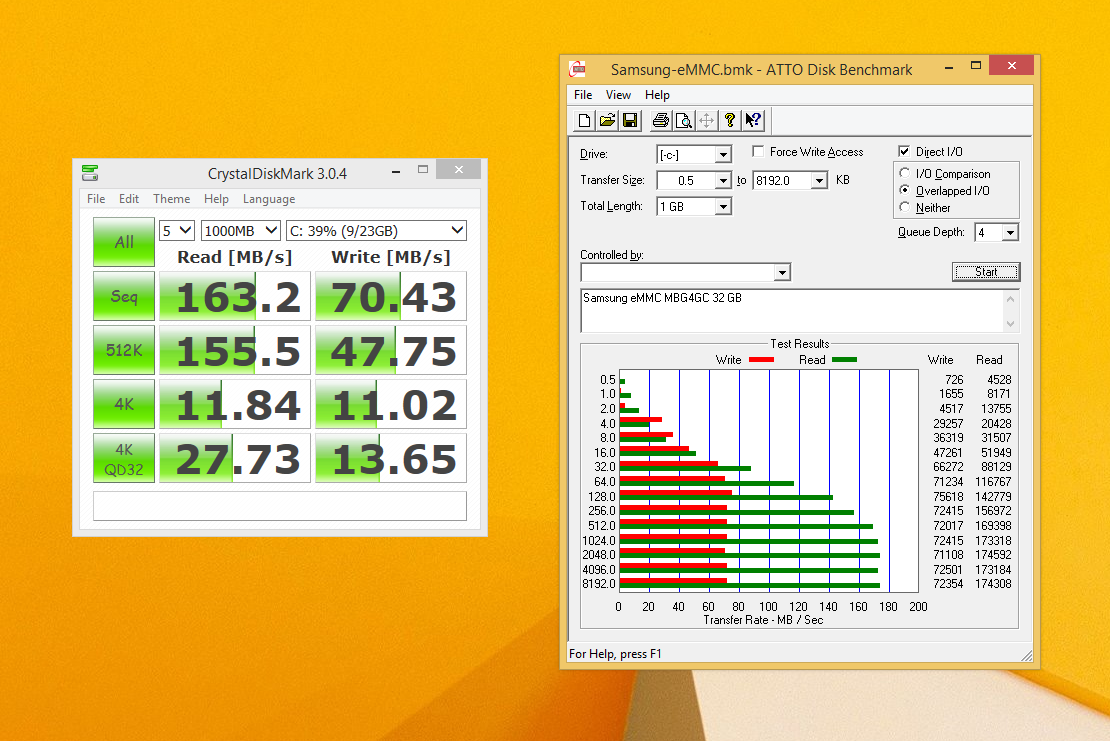
Note that we are benchmarking a microSDXC card with write speeds of the order of 40 MBps and read speeds of around 90 MBps - the results are not surprising, and should only be taken at face value. That said, in order to get an idea of the eMMC performance, we ran ATTO and CrystalDiskMark on the Samsung MBG4GC. A screenshot of the results is presented below.
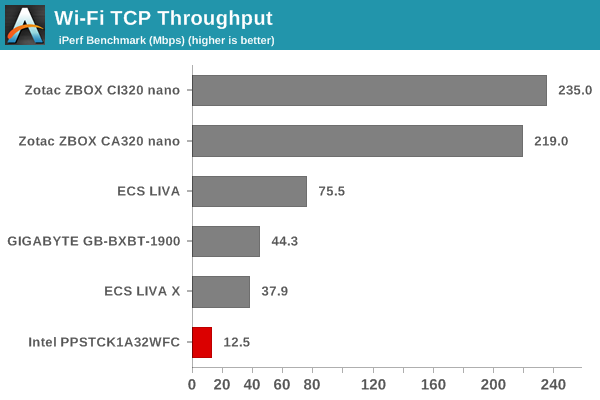
On the networking side, we restricted ourselves to the evaluation of the WLAN component. Our standard test router is the Netgear R7000 Nighthawk configured with both 2.4 GHz and 5 GHz networks. The router is placed approximately 20 ft. away, separated by a drywall (as in a typical US building). A wired client (Zotac ID89-Plus) is connected to the R7000 and serves as one endpoint for iPerf evaluation. The PC under test is made to connect to either the 5 GHz (preferred) or 2.4 GHz SSID and iPerf tests are conducted for both TCP and UDP transfers. It is ensured that the PC under test is the only wireless client for the Netgear R7000. We evaluate total throughput for up to 32 simultaneous TCP connections using iPerf and present the highest number in the graph below.
In the UDP case, we try to transfer data at the highest rate possible for which we get less than 1% packet loss.
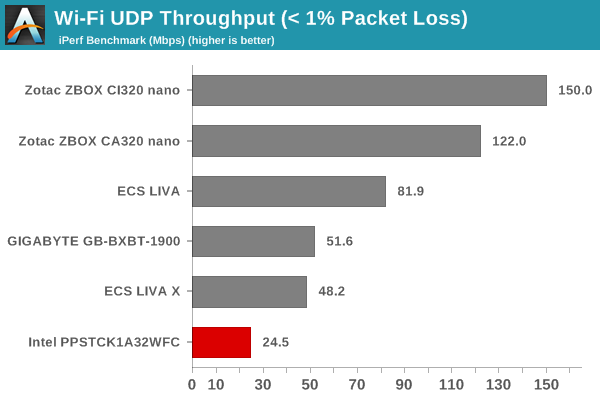
The numbers appear downright bad even when we consider that we are looking at a 1x1 802.11n connection. Surprisingly, when connected to another router in the same place, we were getting transfer rates in the order of 48 - 50 Mbps. However, the results graphed above have the numbers from the same router with the clients at the same location. Users will probably be seeing a wide range in the performance of the WLAN component.
 The AMD A8-7650K APU Review, Al...
 GTA5 PC버전을 통한 GPU 벤치마크...