


<br>")
![삼성, 잃어버린 10년 [풀영상] | 창 458회 (KBS 24.03.12) by 인공지능](https://raptor-hw.net/xe/files/thumbnails/453/204/271x205.crop.jpg "삼성, 잃어버린 10년 [풀영상] | 창 458회 (KBS 24.03.12)<br>")


 다운로드 및 설치<br>")

, 전세계 일자리 파괴 가속화 “육체노동만 살아남나?”<br>")
 ' alt='위대한 인류최대 수퍼로켓 '스타십(Spacex Starship)' 발사 성공 by 인공지능' />

<br>")


’ 오픈<br>")


| Vega Frontier Edition | Titan Xp | GTX 1080 Ti | Titan X (Pascal) | GTX 1080 | TITAN X | GTX 980 | R9 Fury X | R9 Fury | |
|---|---|---|---|---|---|---|---|---|---|
| GPU | Vega | GP102 | GP102 | GP102 | GP104 | GM200 | GM204 | Fiji XT | Fiji Pro |
| GPU Cores | 4096 | 3840 | 3584 | 3584 | 2560 | 3072 | 2048 | 4096 | 3584 |
| Base Clock | 1382 MHz | 1480 MHz | 1480 MHz | 1417 MHz | 1607 MHz | 1000 MHz | 1126 MHz | 1050 MHz | 1000 MHz |
| Boost Clock | 1600 MHz | 1582 MHz | 1582 MHz | 1480 MHz | 1733 MHz | 1089 MHz | 1216 MHz | - | - |
| Texture Units | ? | 224 | 224 | 224 | 160 | 192 | 128 | 256 | 224 |
| ROP Units | 64 | 96 | 88 | 96 | 64 | 96 | 64 | 64 | 64 |
| Memory | 16GB | 12GB | 11GB | 12GB | 8GB | 12GB | 4GB | 4GB | 4GB |
| Memory Clock | 1890 MHz | 11400 MHz | 11000 MHz | 10000 MHz | 10000 MHz | 7000 MHz | 7000 MHz | 1000 MHz | 1000 MHz |
| Memory Interface | 2048-bit HBM2 | 384-bit G5X | 352-bit | 384-bit G5X | 256-bit G5X | 384-bit | 256-bit | 4096-bit (HBM) | 4096-bit (HBM) |
| Memory Bandwidth | 483 GB/s | 547.7 GB/s | 484 GB/s | 480 GB/s | 320 GB/s | 336 GB/s | 224 GB/s | 512 GB/s | 512 GB/s |
| TDP | 300 watts | 250 watts | 250 watts | 250 watts | 180 watts | 250 watts | 165 watts | 275 watts | 275 watts |
| Peak Compute | 13.1 TFLOPS | 12.0 TFLOPS | 10.6 TFLOPS | 10.1 TFLOPS | 8.2 TFLOPS | 6.14 TFLOPS | 4.61 TFLOPS | 8.60 TFLOPS | 7.20 TFLOPS |
| Transistor Count | ? | 12.0B | 12.0B | 12.0B | 7.2B | 8.0B | 5.2B | 8.9B | 8.9B |
| Process Tech | 14nm | 16nm | 16nm | 16nm | 16nm | 28nm | 28nm | 28nm | 28nm |
| MSRP (current) | $999 | $1200 | $699 | $1,200 | $599 | $999 | $499 | $649 | $549 |
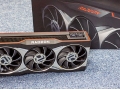
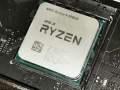
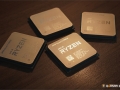
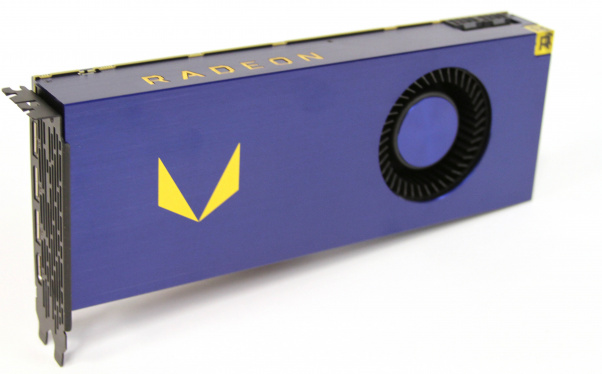
AMD의 가장 최신 기술로 개발된 신형 GPU 라데온 베가 프론티어 에디션 16GB. 스펙은 기존 R9 Fury X와 비슷하며(4096 코어) 동작 클럭 상승, 16GB 2048-bit HBM2 적용, 글로벌 파운드리 14나노 공정, TDP는 300와트, 가격은 999달러
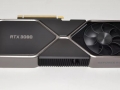
베가 프론티어 에디션 외형


테스트 시스템
| PC Perspective GPU Testbed | |
|---|---|
| Processor | Intel Core i7-5960X Haswell-E |
| Motherboard | ASUS Rampage V Extreme X99 |
| Memory | G.Skill Ripjaws 16GB DDR4-3200 |
| Storage | OCZ Agility 4 256GB (OS) Adata SP610 500GB (games) |
| Power Supply | Corsair AX1500i 1500 watt |
| OS | Windows 10 x64 |
| Drivers | AMD: 17.6 (Vega) NVIDIA: 382.53 |

| Radeon Vega Frontier Edition 16GB (300W), Average FPS Comparisons, Dirt Rally | |||||
|---|---|---|---|---|---|
| GTX 1080 Ti | GTX 1080 | GTX 1070 | R9 Fury X | ||
| 2560x1440 | -37% | -11% | +2% | +15% | |
| 3840x2160 | -37% | -5% | |||
더트 랠리 : 베가 프론티어 에디션은 지포스GTX 1070 급 성능

| Radeon Vega Frontier Edition 16GB (300W), Average FPS Comparisons, Fallout 4 | |||||
|---|---|---|---|---|---|
| GTX 1080 Ti | GTX 1080 | GTX 1070 | R9 Fury X | ||
| 2560x1440 | -32% | -8% | +10% | +27% | |
| 3840x2160 | -39% | -13% | |||
폴아웃4 : 베가 프론티어 에디션은 지포스GTX 1070 보다 10% 높은 성능

| Radeon Vega Frontier Edition 16GB (300W), Average FPS Comparisons, Grand Theft Auto V | |||||
|---|---|---|---|---|---|
| GTX 1080 Ti | GTX 1080 | GTX 1070 | R9 Fury X | ||
| 2560x1440 | -33% | -31% | -19% | +16% | |
| 3840x2160 | -50% | -31% | |||
GTA5 : 베가 프론티어 에디션은 지포스GTX 1070 보다 -19% 낮은 성능

| Radeon Vega Frontier Edition 16GB (300W), Average FPS Comparisons, Hitman | |||||
|---|---|---|---|---|---|
| GTX 1080 Ti | GTX 1080 | GTX 1070 | R9 Fury X | ||
| 2560x1440 | -30% | -14% | +32% | +27% | |
| 3840x2160 | -33% | -16% | |||
히트맨 : 베가 프론티어 에디션은 지포스GTX 1070 보다 32% 높은 성능

| Radeon Vega Frontier Edition 16GB (300W), Average FPS Comparisons, Rise of the Tomb Raider | |||||
|---|---|---|---|---|---|
| GTX 1080 Ti | GTX 1080 | GTX 1070 | R9 Fury X | ||
| 2560x1440 | -38% | -13% | +11% | +46% | |
| 3840x2160 | -38% | -14% | |||
톰레이더 : 베가 프론티어 에디션은 지포스GTX 1070 보다 11% 높은 성능

| Radeon Vega Frontier Edition 16GB (300W), Average FPS Comparisons, The Witcher 3 | |||||
|---|---|---|---|---|---|
| GTX 1080 Ti | GTX 1080 | GTX 1070 | R9 Fury X | ||
| 2560x1440 | -38% | -17% | +1% | +16% | |
| 3840x2160 | -40% | -17% | |||
위처3 : 베가 프론티어 에디션은 지포스GTX 1070 급 성능
전력 소모

베가 프론티어 에디션의 전력소모는 테스트 카드 중 단연 1위
3DMark, Unigine Heaven
Let's look at a set of tests from more standard benchmarks like Unigine Heaven and the new 3DMark benchmark.
I consider these tests to be somewhat of a "best case" for all the cards in our comparison. We aren't using our frame capture system, we aren't measuring frame latency, nothing like that; I think this should give you an idea of graphics performance if each vendor had the best result for each game.


Looking at the synthetic benchmarks, we start with the classic 3DMark Fire Strike tests. The Extreme run shows a pretty reasonable performance edge from the Vega FE to the GTX 1080 of 6%, the closest gap we have seen so far. The Vega FE is even 14% faster than the GTX 1070 here. Looking at the Ultra preset, the GTX 1080 only has a 3% advantage.

Unigine Heaven continues to be a sore spot for Radeon graphics cards. With a score of 64.7 FPS, the Vega Frontier Edition is only 12% faster than the Fury X! That also leaves it 8.5% slower than the GTX 1070…
3DS Max Viewset (3dsmax-05)

The 3dsmax-05 viewset was created from traces of the graphics workload generated by 3ds Max 2016 using the default Nitrous DX11 driver.
The models for this viewset came from the SPECapc for 3ds Max 2015 benchmark and other sources. In order to best approximate real-world use cases, several tests incorporate multiple viewsets on screen, each using a different rendering method. The styles of rendering in the viewset reflect those most commonly used in major markets, including realistic, shaded and wireframe. Some lesser-used but interesting rendering modes such as facets, graphite and clay are also incorporated. The animations in the viewset are a combination of model spin and camera fly-through, depending on the model.

The Vega FE has a good showing on this viewset, producing a score 92% higher than the Radeon Pro Duo (single GPU) and coming within 20% of the Titan Xp.
CATIA Viewset (Catia-04)

The catia-04 viewset was created from traces of the graphics workload generated by the CATIA V6 R2012 application from Dassault Systemes. Model sizes range from 5.1 to 21 million vertices.
The viewset includes numerous rendering modes supported by the application, including wireframe, anti-aliasing, shaded, shaded with edges, depth of field, and ambient occlusion

The two Radeon cards scale well with Catia, with the Vega Frontier Edition getting a win over the Titan Xp by 25% or so. But notice that the Quadro P5000, which is essentially identical hardware to the GTX 1080, is noticeably faster than the Titan Xp, indicate work and improvement from the Quadro driver stack.
Creo viewset (Creo-01)

The creo-01 viewset was created from traces of the graphics workload generated by the Creo 2™ application from PTC. Model sizes range from 20 to 48 million vertices.
The viewset includes numerous rendering modes supported by the application, including wireframe, anti-aliasing, shaded, shaded with edges, and shaded reflection modes.

Creo uses a super high poly count model for a portion of its workload and the Radeon Vega Frontier Edition does exceedingly well, besting the Titan Xp by 48%.
Energy Viewset (Energy-01)

The energy-01 viewset is representative of a typical volume rendering application in the seismic and oil and gas fields. Similar to medical imaging such as MRI or CT, geophysical surveys generate image slices through the subsurface that are built into a 3D grid. Volume rendering provides a 2D projection of this 3D volumetric grid for further analysis and interpretation.
At every frame, depending on the viewer position, a series of coplanar slices aligned with the viewing angle are computed on the CPU and then sent to the graphics hardware for texturing and further calculations such as transfer function lookup, lighting and clipping to reveal internal structures. Finally, the slices are blended together before the image is displayed.

The Energy viewset gives the Radeon Vega FE another win over the Titan Xp as well as the Quadro P5000.
Maya viewset (maya-04)

The maya-04 viewset was created from traces of the graphics workload generated by the Maya 2013 application from Autodesk. Model size is 727,500 vertices.
The viewset includes numerous rendering modes supported by the application, including shaded mode, ambient occlusion, multi-sample anti aliasing, and transparency.

The Maya workload shows good scaling from the single GPU Radeon Pro duo test to the Vega FE (75%) though the Titan Xp still has a significant advantage over the rest of the field.
Medical Viewset (Medical-01)

The medical-01 viewset is representative of a typical volume rendering application that renders a 2D projection of a 3D volumetric grid. A typical 3D grid in this viewset is a group of 3D slices acquired by a scanner (such as CT or MRI).
At every frame, depending on the viewer position, a series of coplanar slices aligned with the viewing angle are computed on the CPU and then sent to the graphics hardware for texturing and further calculations, such as transfer function lookup, lighting and clipping to reveal internal structures. Finally, the slices are blended together before the image is displayed.

Using the Medical viewset swaps the win back in favor of AMD, with the Radeon Vega FE card providing a 40% advantage over the Titan Xp.
Showcase Viewset (showcase-01)

The showcase-01 viewset was created from traces of Autodesk’s Showcase 2013 application. The model used in the viewset consists of 8 million vertices.
The viewset is the first viewset in SPECviewperf to feature DX rendering. Rendering modes included in the viewset include shading, projected shadows, and self-shadows.

The Showcase viewset utilizes DX11 for rendering and the advantages that the GeForce products offer here stand out. The Titan Xp is 47% faster than the Vega FE.
Siemens NX (snx-02)

The snx-02 viewset was created from traces of the graphics workload generated by the NX 8.0 application from Siemens PLM. Model sizes range from 7.15 to 8.45 million vertices.

The scores for the Radeon Pro Duo and the Titan Xp, in contrast with the scores from the Quadro and Vega cards, indicate there is a significant software difference between these driver configurations. The Vega Frontier Edition does impressively well, coming within 30% of the Quadro P5000.
Solidworks viewset (sw-03)

The sw-03 viewset was created from traces of Dassault Systemes’ SolidWorks 2013 SP1 application. Models used in the viewset range in size from 2.1 to 21 million vertices.
The viewset includes numerous rendering modes supported by the application, including shaded mode, shaded with edges, ambient occlusion, shaders, and environment maps.

Finally, the Solidworks viewset has the Radeon Vega FE well ahead of the Titan Xp (73%) but falling shore of all three of the Quadro family of products.
LuxMark 3.1

GPGPU compute performance is a big part of any modern GPU design, especially in the workstation environment. LuxMark is a long-standing OpenCL benchmark, based on the LuxRender engine and provides a good look at how different GPU architectures compare in typical OpenCL workloads. Today we are testing our field of graphics cards in the most compute intensive scene, Hotel.

With a score of 4690, the Radeon Vega Frontier Edition performs 41% faster than the Quadro P5000 (GTX 1080 equivalent) and than the Radeon Pro Duo running on a single GPU (essentially a Fury X). That’s a big shift from the gaming results we just went through on the preceding pages. NVIDIA’s Titan Xp though was able to bring a score of 5800, giving it a 23% advantage over AMD’s middle-level pro-sumer graphics offering.
Cinebench R15 OpenGL
The performance depends on various factors, such as the GPU processor on your hardware, on the drivers used. The graphics card has to display a huge amount of geometry (nearly 1 million polygons) and textures, as well as a variety of effects, such as environments, bump maps, transparency, lighting and more to evaluate the performance across different disciplines and give a good average overview of the capabilities of your graphics hardware. The result is measured in frames per second (fps). The higher the number, the faster your graphics card is.

We quickly tossed in CineBench R15 as an OpenGL rending test and the Radeon Vega Frontier Edition does very well, scoring 151.85 FPS compared to the Titan Xp at 144.19 FPS.
We do plan to run a more extensive set of professional application tests as time permits. For this review, we focused most of our available time on the gaming angle of this architecture.
AMD의 신형 라데온 베가 프론티어 에디션은 16GB 용량의 HBM2 기술까지 적용했으나 성능은 엔비디아의 지포스 1070 ~ 1080 중간에 위치하며 1070에 가까운 성능이다. TDP는 무려 300와트로 매우 낮은 와트당 성능을 나타내며 엔비디아와 AMD 간의 GPU 기술 격차가 더욱 확대되고 있다.