


![삼성, 잃어버린 10년 [풀영상] | 창 458회 (KBS 24.03.12) by 인공지능](https://raptor-hw.net/xe/files/thumbnails/453/204/271x205.crop.jpg "삼성, 잃어버린 10년 [풀영상] | 창 458회 (KBS 24.03.12)<br>")


<br>")
 다운로드 및 설치<br>")
’ 오픈<br>")


<br>")

 ' alt='위대한 인류최대 수퍼로켓 '스타십(Spacex Starship)' 발사 성공 by 인공지능' />


, 전세계 일자리 파괴 가속화 “육체노동만 살아남나?”<br>")


| Intel SSD 760p Specifications | ||||||
| Capacity | 128 GB | 256 GB | 512 GB | 1 TB | 2 TB | |
| Form Factor | M.2 2280 single-sided | M.2 2280 double-sided | ||||
| Controller | Intel-customized Silicon Motion SM2262 | |||||
| NAND | Intel 256Gb 64-layer 3D TLC | |||||
| Sequential Read | 1640 MB/s | 3210 MB/s | 3230 MB/s | TBA | TBA | |
| Sequential Write | 650 MB/s | 1315 MB/s | 1625 MB/s | TBA | TBA | |
| 4KB Random Read | 105k IOPS | 205k IOPS | 340k IOPS | TBA | TBA | |
| 4KB Random Write | 160k IOPS | 265k IOPS | 275k IOPS | TBA | TBA | |
| Idle Power | 25 mW | TBA | TBA | |||
| Endurance | 72 TBW | 144 TBW | 288 TBW | 576 TBW | 1152 TBW | |
| Warranty | 5 years | |||||
| Price | $72.99 (57¢/GB) | $108.99 (43¢/GB) | $198.99 (39¢/GB) | TBA (Q1 '18) | TBA (Q1 '18) | |
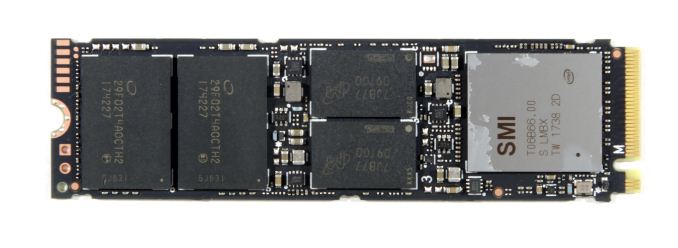
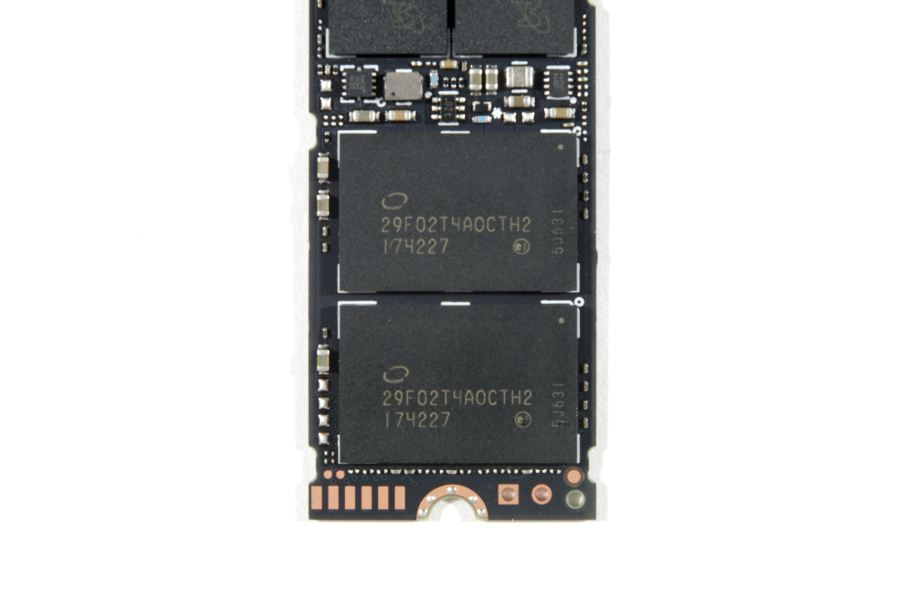
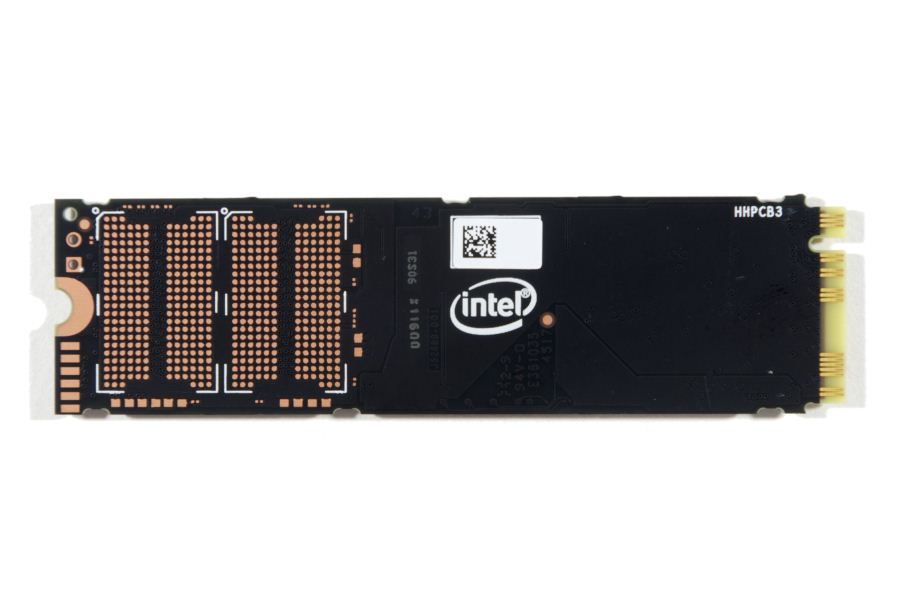
인텔 SSD 760p
메인 컨트롤러 : Intel-customized Silicon Motion SM2262
낸드 : Intel 256Gb 64-layer 3D TLC
폼 팩터 : M.2 2280 single-sided / double-sided
시퀀셜 읽기 : 1640 MB/s ~ 3230 MB/s
시퀀셜 쓰기 : 650 MB/s ~ 1625 MB/s
4KB 랜덤 읽기 : 105k IOPS ~ 340k IOPS
4KB 랜덤 쓰기 : 160k IOPS ~ 275k IOPS
파워 : 25 mW
워런티 : 5년
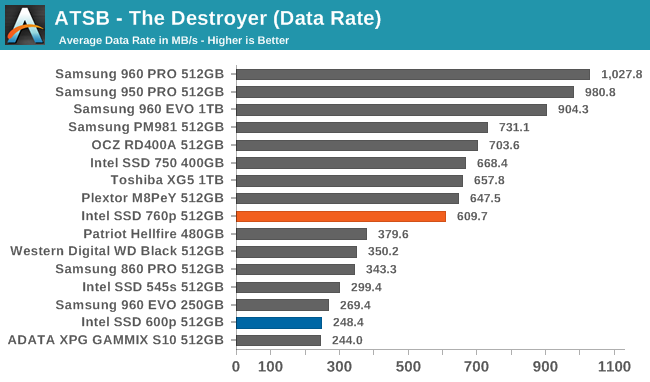
The Intel SSD 760p falls on the good side of a big gap in average data rate scores on The Destroyer. Scoring far below the 760p are SATA drives and most earlier entry-level NVMe SSDs. The 760p is a bit slower than some of the drives using planar MLC NAND or 3D TLC NAND, but it is clear that the 760p is capable of handling The Destroyer better than any previous SSD in its price range.
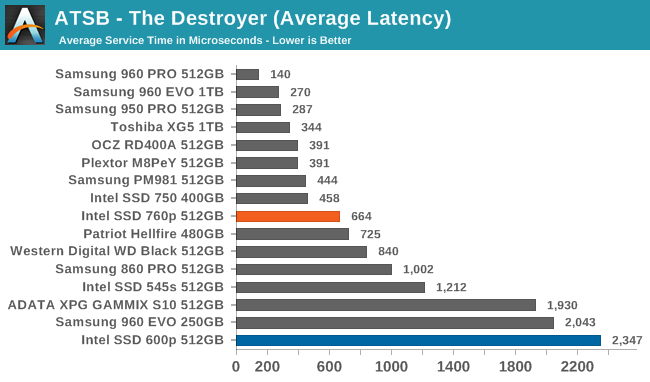
The average and 99th percentile latency scores don't provide the clear separation that the average data rate shows, so the Intel 760p simply looks a bit below average for a NVMe SSD. Given the relative pricing and the poor performance of the Intel 600p, that's a good result for the 760p.
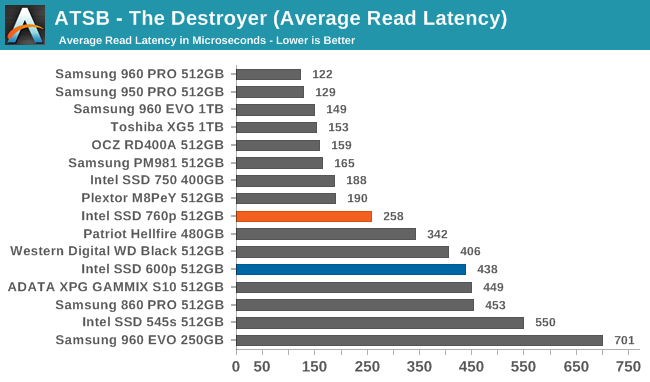
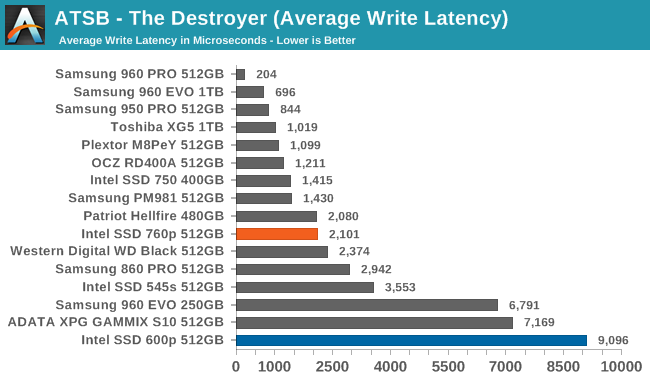
Breaking down the average latency by reads and writes, the Intel SSD 760p ranks about the same either way. It is roughly on par with the slower (read: not Samsung) MLC NVMe SSDs.
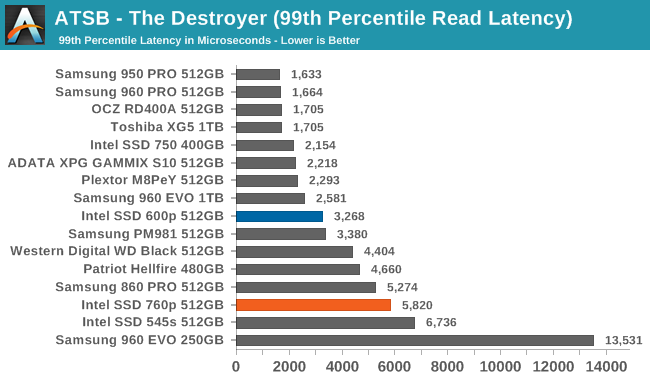
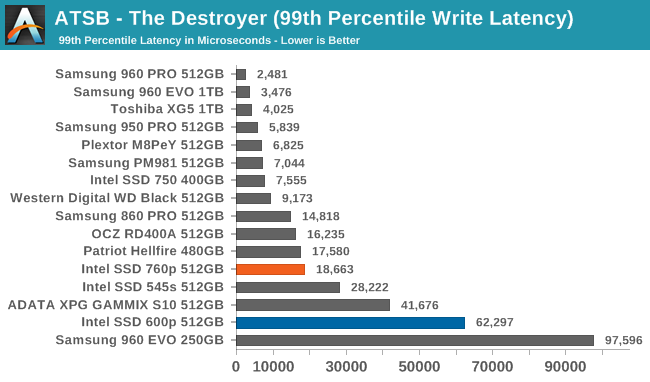
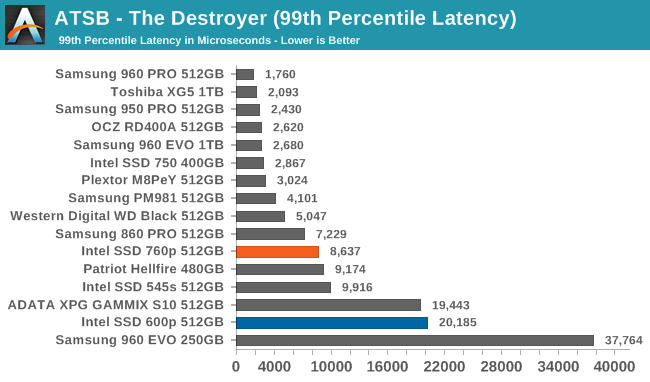
The 99th percentile read latency of the Intel SSD 760p on The Destroyer is rather poor, and the 99th percentile write latency isn't great either. The 760p doesn't seem to have serious problems with garbage collection pauses, but The Destroyer definitely does stress the 760p.
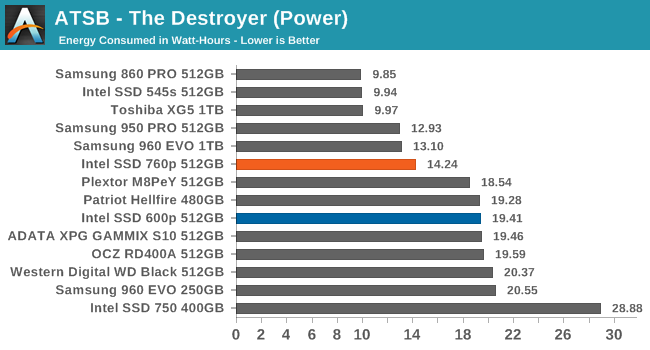
The energy consumption of the Intel SSD 760p during The Destroyer is almost as low as Samsung's best NVMe SSDs, but nowhere near the SATA-like efficiency of the Toshiba XG5. Overall, the 760p is much more efficient than Intel's previous NVMe SSDs, but there's still room for improvement.
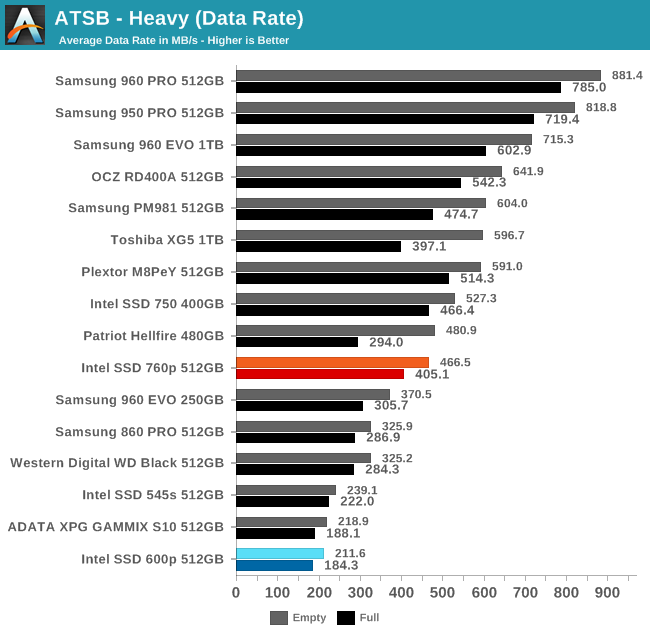
The average data rate of the Intel SSD 760p on the Heavy test makes it clear that the 760p is not a high-end NVMe drive, but it does perform much better than SATA SSDs and previous low-end NVMe SSDs. The 760p also handles being full relatively well, so its SLC caching strategy seems well done.
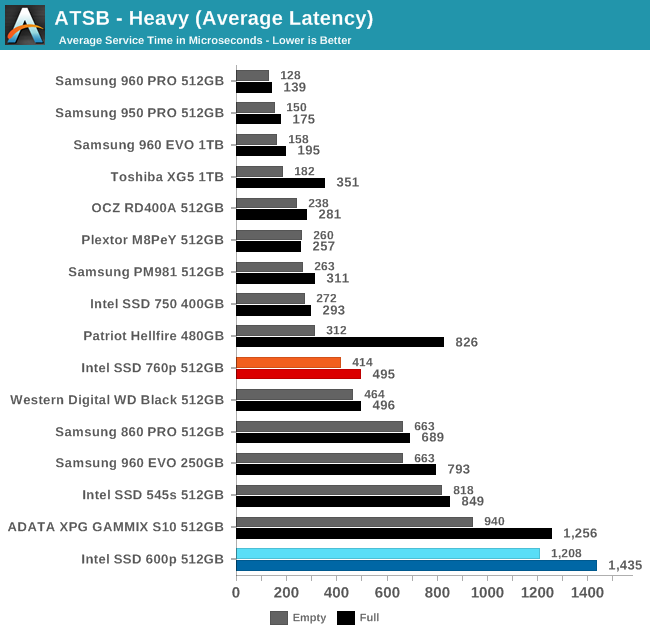
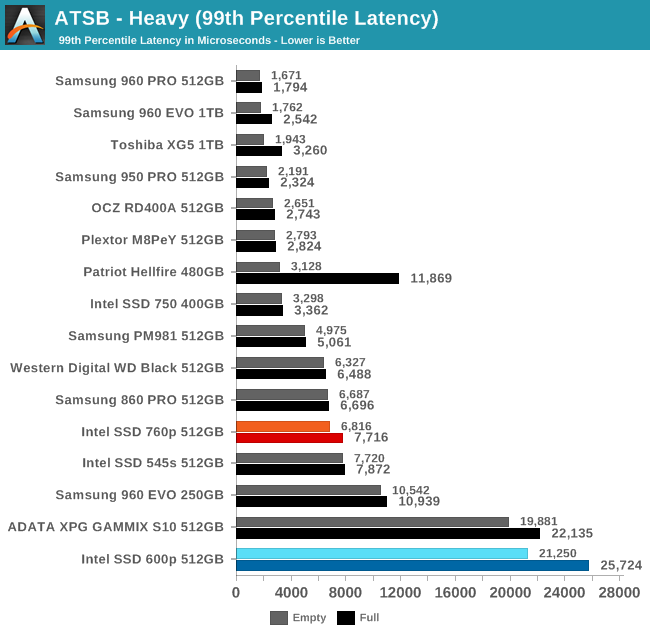
The average and 99th percentile latency scores of the 760p aren't great, but they're still a big improvement over most earlier low-end NVMe SSDs. The 99th percentile latency has more room for improvement, since it is no better than a good SATA SSD.
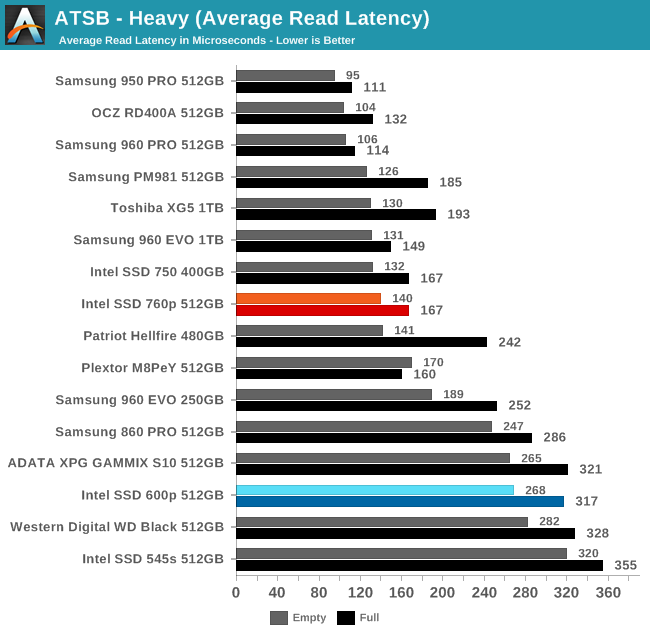
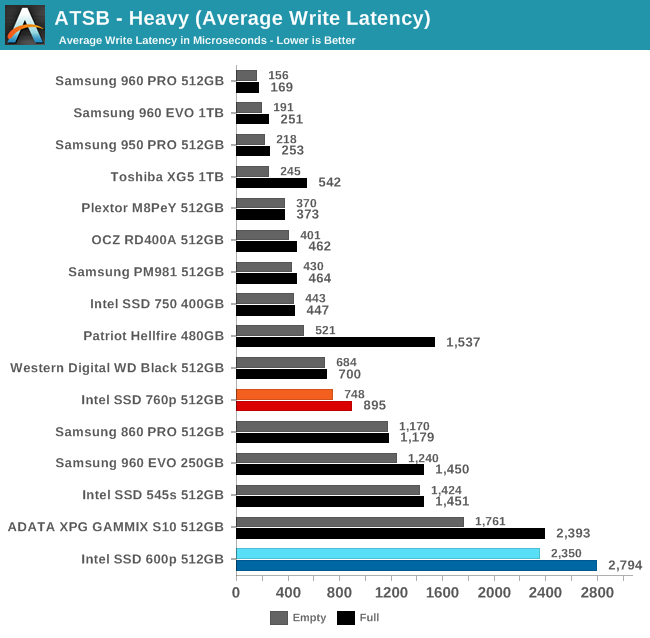
The average read latencies of the Intel SSD 760p on the Heavy test are not quite as good as a high-end NVMe SSD but are definitely close enough for a product this cheap. The average write latencies are more in line with some of the better previous budget NVMe SSDs, and are close to the level of SATA SSDs.
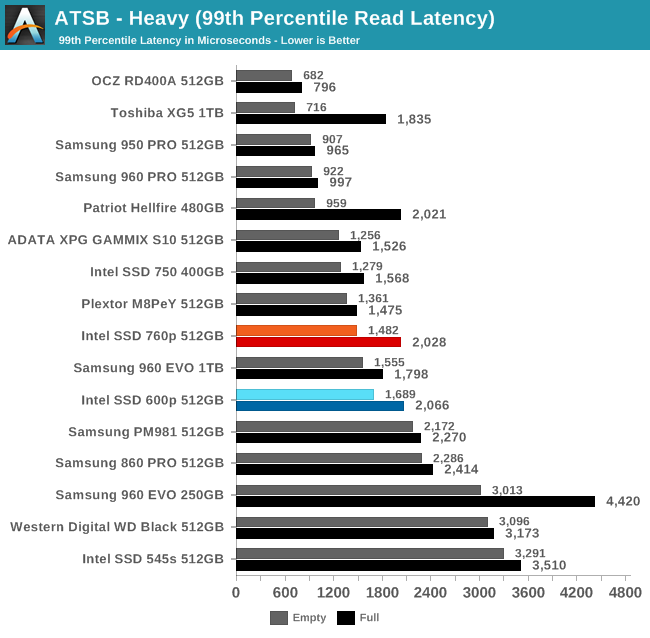
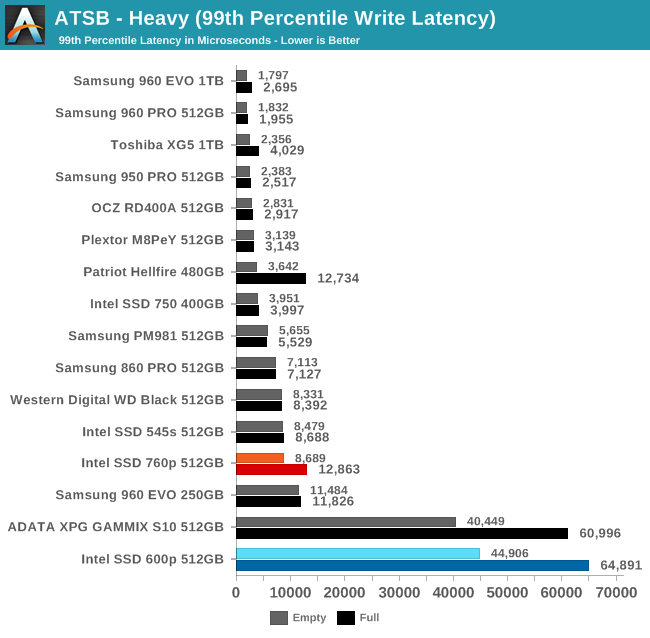
The 99th percentile read latencies from the Intel 760p don't particularly stand out, and are reasonable for this product segment. The 99th percentile write latency scores are rather high, but not to egregiously like the Intel SSD 600p and a similar ADATA drive.
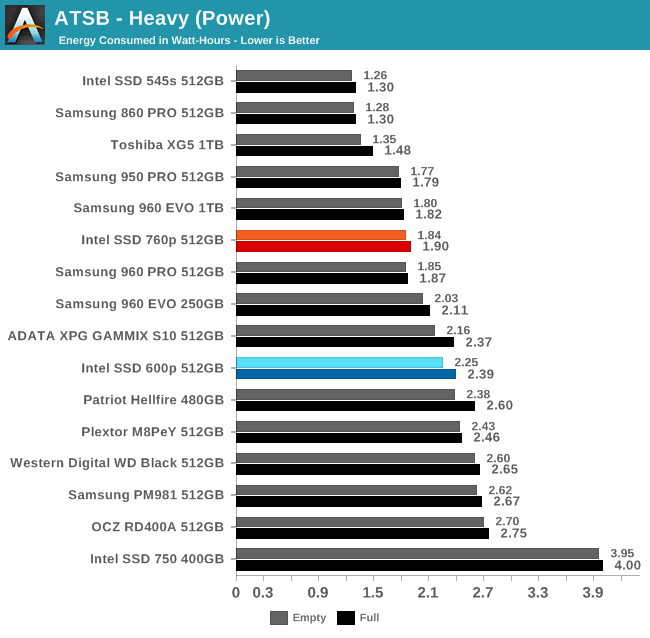
As with The Destroyer, the Intel SSD 760p shows very good power efficiency by NVMe standards, but the SATA drives and the Toshiba XG5 show that there's still room for much improvement.
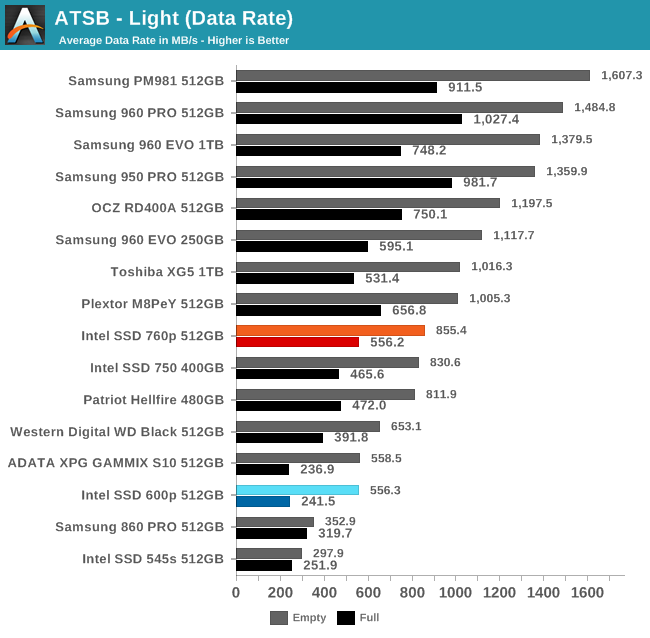
The Light test reveals bigger performance differences for full and empty drive states than the Heavy test, but the 760p doesn't suffer as much as most drives. The average data rates from the 760p are slightly higher than from the Intel SSD 750, and much higher than the 600p or the SATA drives. On the other hand, the TLC-based Samsung PM981 is almost twice as fast.
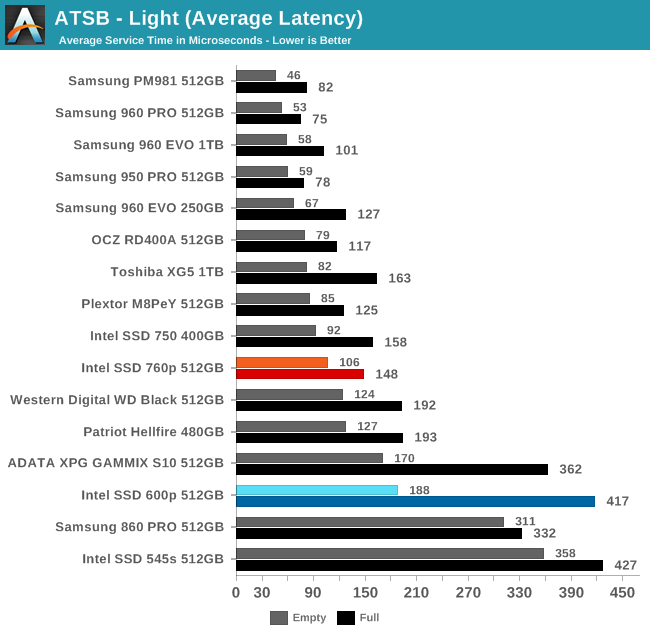
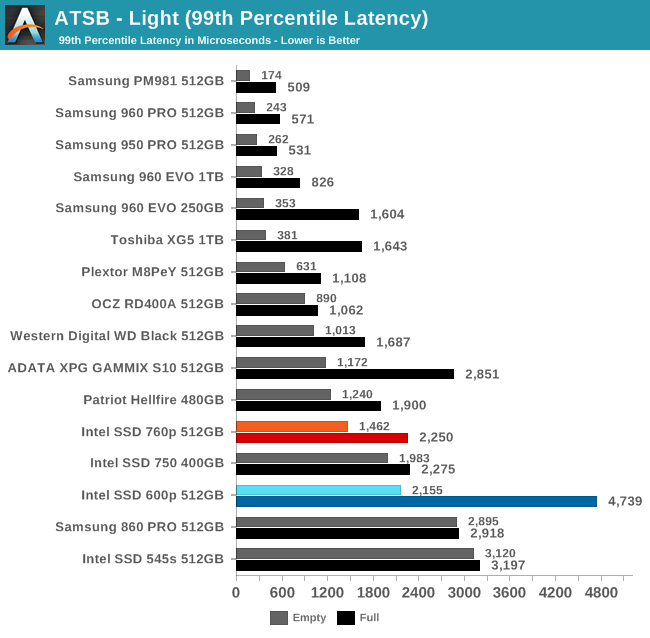
The average latency scores of the Intel SSD 760p are twice those of the fastest NVMe SSDs, but this isn't enough to amount to a noticeable difference on a light workload. The 99th percentile latencies are much higher than those of Samsung's NVMe drives, but are still faster than SATA SSDs.
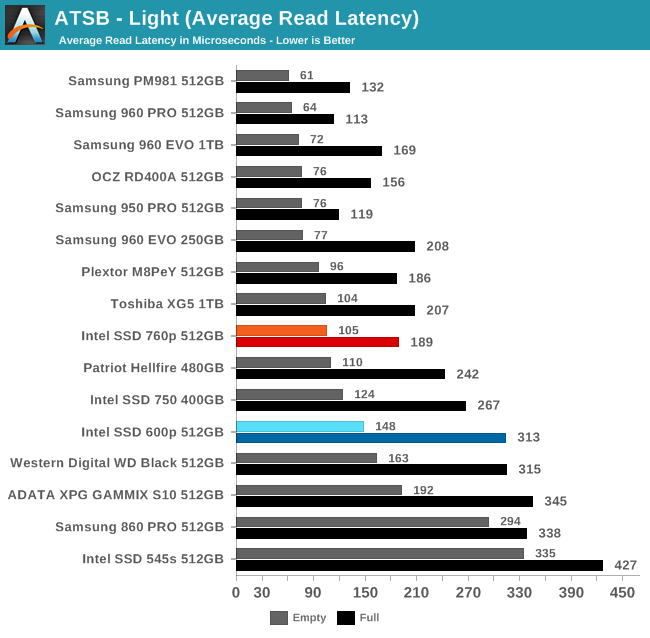
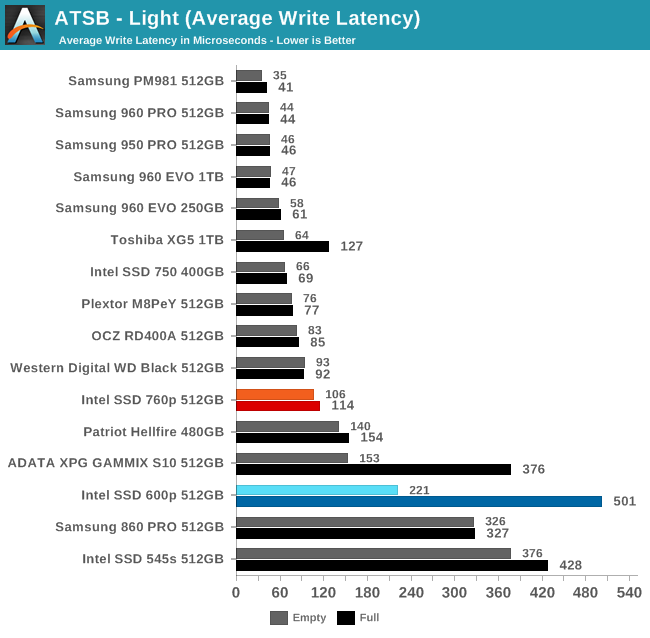
The average read latencies from the Intel 760p fall into the middle of the range for NVMe SSDs, but the average write latencies are clearly on the high side of normal.
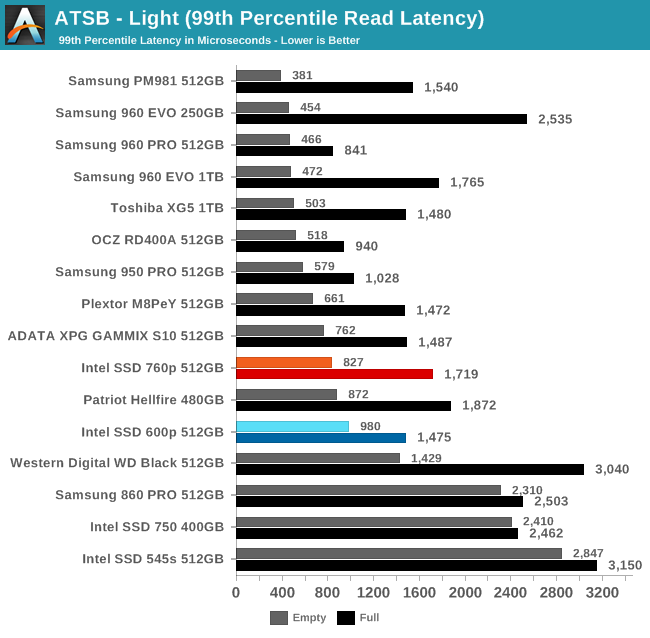
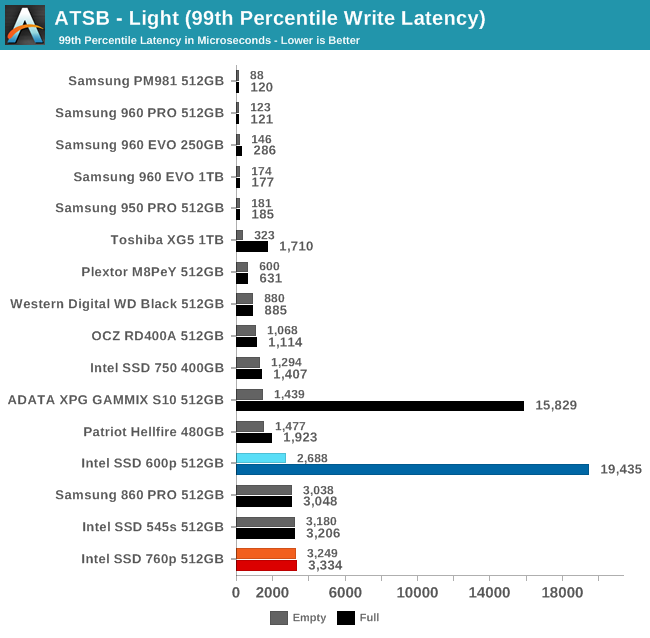
The 99th percentile read latencies of the 760p on the Light test are acceptable for a low-end NVMe SSD, but the full-drive score is actually slightly worse than the Intel 600p. On the write side, the 99th percentile latency is actually very slightly worse than good SATA SSDs, but the 760p doesn't get noticeably worse when full.
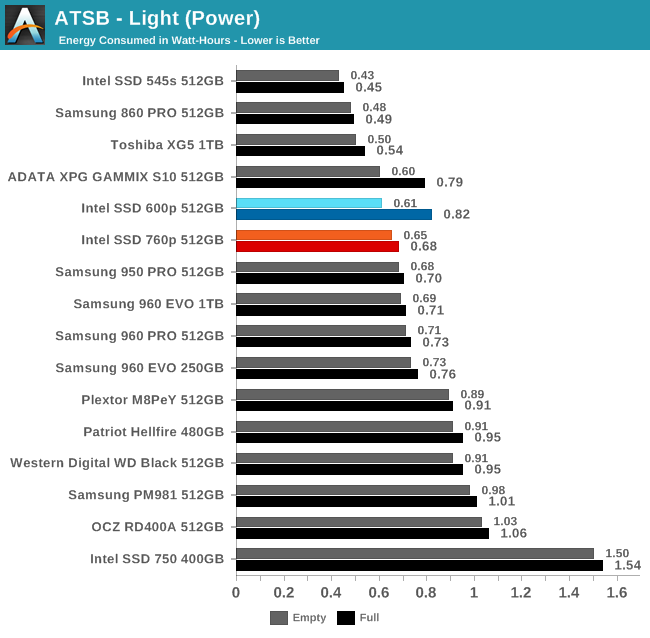
The two SM2260-based NVMe SSDs join the Toshiba XG5 this time as the most efficient NVMe SSDs ahead of the Intel 760p, but the SM2260-based 600p and GAMMIX S10 fall behind when the test is run on a full drive. The Samsung drives mostly use slightly more power than the 760p, but the PM981 ends up near the bottom of the chart.
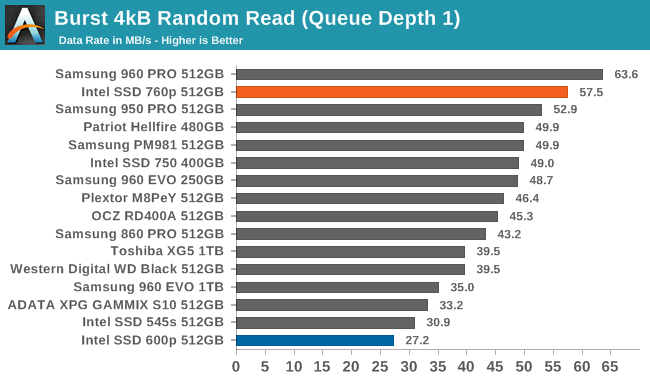
The burst random read performance of the Intel SSD 760p is great, even when compared against MLC-based NVMe SSDs. Samsung's 960 PRO is the only flash-based consumer SSD that currently beats the read latency of the 760p. The 760p has more than doubled the QD1 random read performance of the Intel SSD 600p, and is 17% faster than the Intel SSD 750.
Our sustained random read performance is similar to the random read test from our 2015 test suite: queue depths from 1 to 32 are tested, and the average performance and power efficiency across QD1, QD2 and QD4 are reported as the primary scores. Each queue depth is tested for one minute or 32GB of data transferred, whichever is shorter. After each queue depth is tested, the drive is given up to one minute to cool off so that the higher queue depths are unlikely to be affected by accumulated heat build-up. The individual read operations are again 4kB, and cover a 64GB span of the drive.
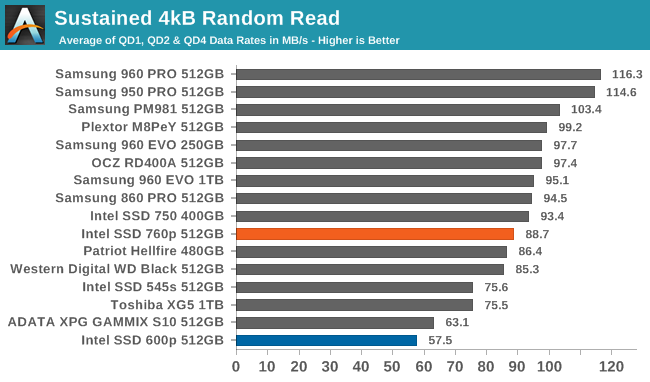
With a longer test runtime and some higher queue depths involved, the Intel SSD 760p no longer stands out from the crowd. Its sustained random read performance is reasonable given its pricing and the current field of competitors, but in a few months time it may be looking rather sluggish. The 760p is about 5% slower than the Intel SSD 750, but on the other hand it is 54% faster than the 600p.
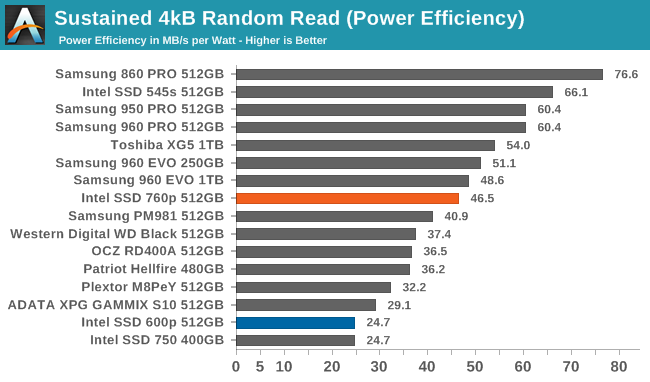
The power efficiency of the Intel SSD 760p during random reads is about average. Samsung's SSDs dominate the top half of the chart, and the two SATA SSDs hold the top two spots, showing that the performance of NVMe SSDs still doesn't offset their increased power consumption. Intel's previous consumer NVMe SSDs are tied for last place in power efficiency: the 750 is reasonably fast but power hungry, while the 600p has more modest power requirements but is quite slow.
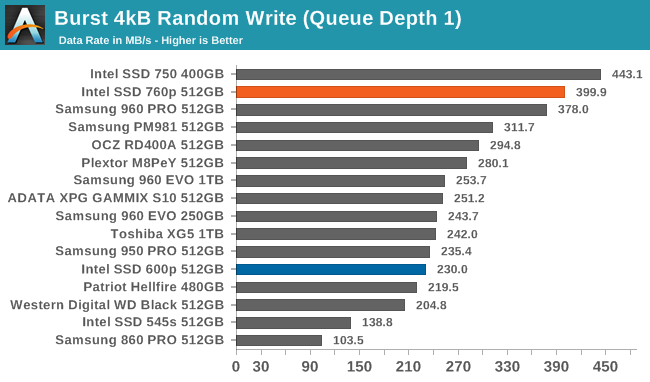
The burst random write performance of the Intel SSD 760p is second only to the Intel SSD 750. Since the 750 is based on an enterprise SSD platform with MLC NAND, this regression isn't at all surprising. That the 760p manages to beat the Samsung 960 PRO is quite an accomplishment. The 760p is also 73% faster than the Intel 600p on this test.
As with the sustained random read test, our sustained 4kB random write test runs for up to one minute or 32GB per queue depth, covering a 64GB span of the drive and giving the drive up to 1 minute of idle time between queue depths to allow for write caches to be flushed and for the drive to cool down.
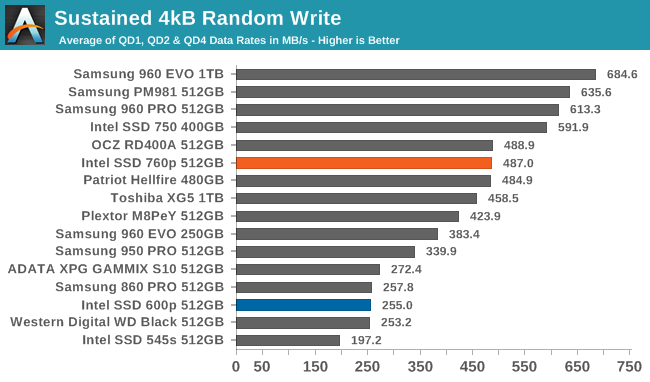
On the sustained random write test that involves some higher queue depths, the performance of the Intel SSD 760p is good but not outstanding. Several of Samsung's drives and the Intel SSD 750 are faster. However, the 760p is on par with some of the slower MLC-based competitors and is almost twice as fast as the Intel SSD 600p.
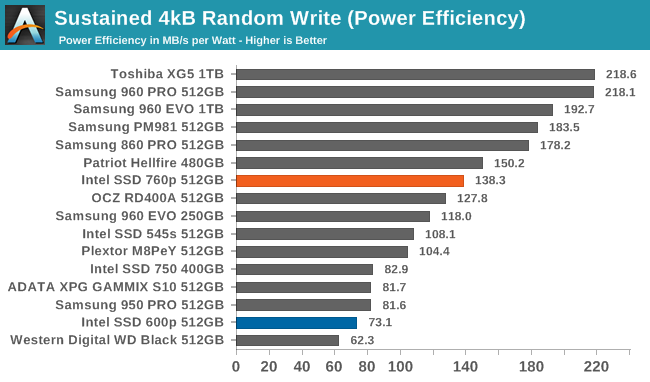
The power efficiency of the Intel SSD 760p during random writes is a bit above average, and is substantially better than any previous Intel consumer SSD. The Toshiba XG5 and most of Samsung's recent drives are far more efficient.
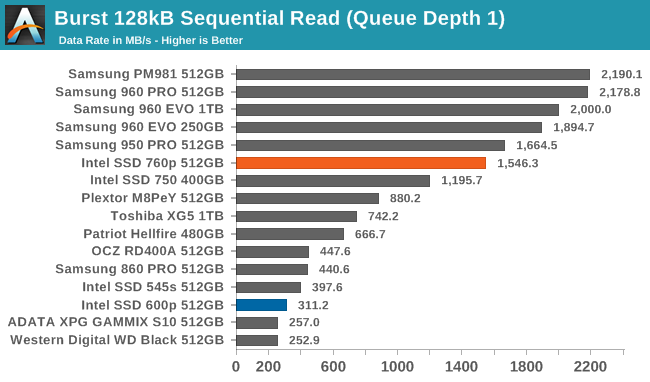
The burst sequential read speed of the Intel SSD 760p is a substantial improvement over the Intel SSD 750 and 600p, but isn't quite fast enough to match Samsung's NVMe SSDs.
Our test of sustained sequential reads uses queue depths from 1 to 32, with the performance and power scores computed as the average of QD1, QD2 and QD4. Each queue depth is tested for up to one minute or 32GB transferred, from a drive containing 64GB of data.
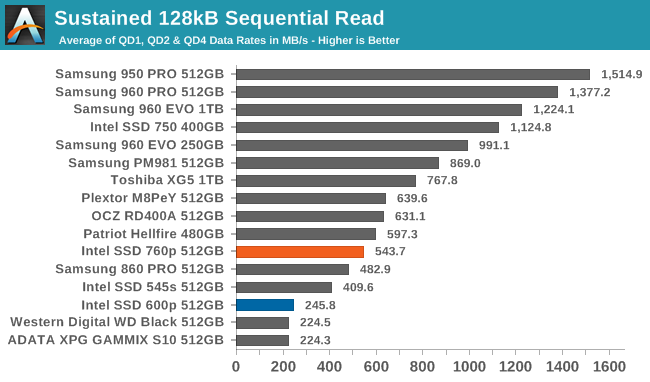
The sustained sequential read speed of the Intel SSD 760p is only slightly above SATA SSD speeds. This makes it more than twice as fast as the Intel SSD 600p, but still far slower than other recent NVMe SSDs using 3D TLC NAND such as the Toshiba XG5 and the Samsung PM981.
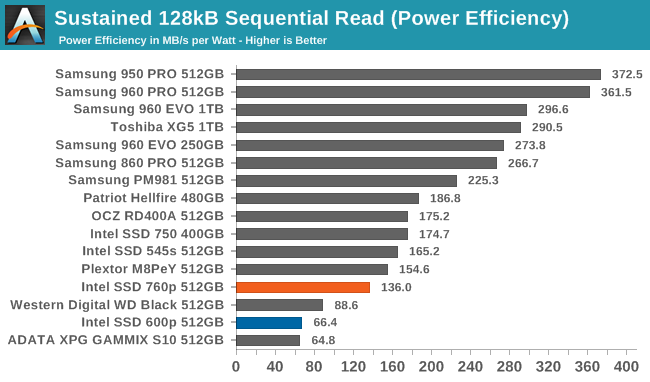
With subpar performance, it isn't surprising to see the Intel SSD 760p score near the bottom for power efficiency. There are a few TLC-based NVMe SSDs that score even worse—including the Intel SSD 600p—but there's clearly a lot of room for improvement here.
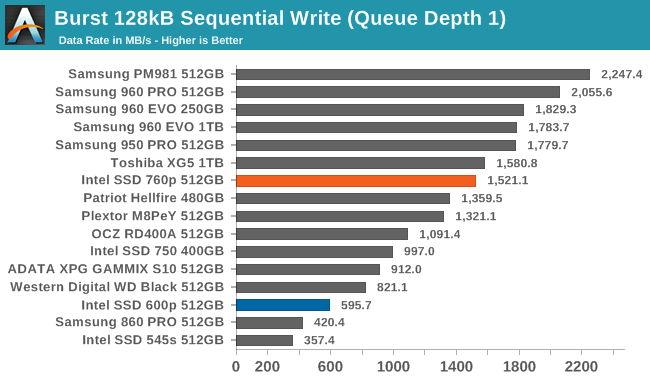
The burst sequential write speed of the Intel SSD 760p is slightly above average and far above Intel's previous flash-based SSDs. It is only slightly slower than the larger 1TB Toshiba XG5, and about 15–20% slower than Samsung's NVMe SSDs.
Our test of sustained sequential writes is structured identically to our sustained sequential read test, save for the direction of the data transfers. Queue depths range from 1 to 32 and each queue depth is tested for up to one minute or 32GB, followed by up to one minute of idle time for the drive to cool off and perform garbage collection. The test is confined to a 64GB span of the drive.
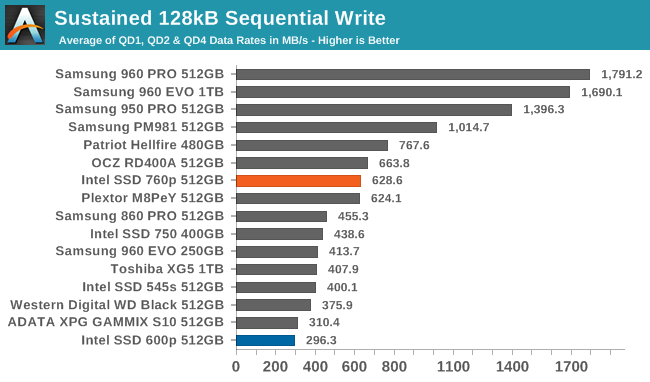
The sustained sequential write speed of the Intel SSD 760p is comfortably above the limits of the SATA interface, which many NVMe SSDs can't manage. However, the Samsung PM981 is 60% faster than the 760p, and the 960 PRO is almost three times faster. The performance of the 760p is reasonable for a low-end NVMe SSD, but it can't compete at the high end.
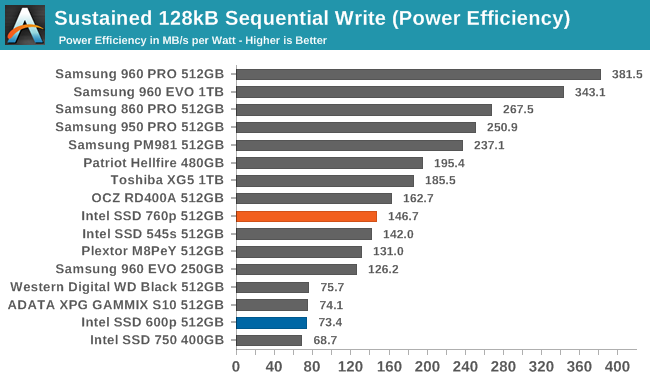
The power efficiency of the Intel SSD 760p on the sequential write test is slightly below average. This is twice the efficiency of Intel's previous NVMe SSDs, but substantially worse than more recent drives from Samsung and Toshiba.
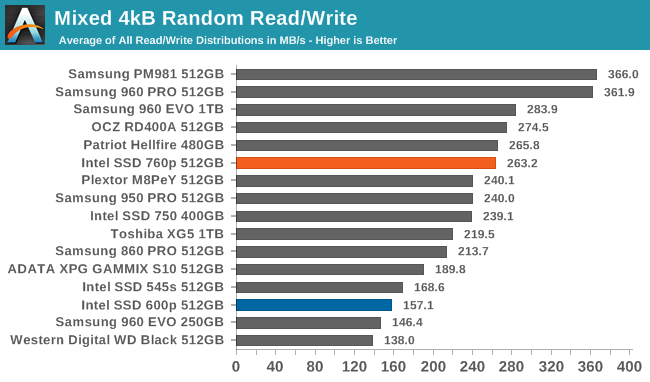
The overall performance of the Intel SSD 760p on the mixed random I/O performance is quite high for a TLC-based drive. Samsung's PM981 is much better, but the 512GB 760p is almost as fast as the 1TB Samsung 960 EVO. The 760p is clearly a viable competitor to the non-Samsung drives that use MLC NAND flash.
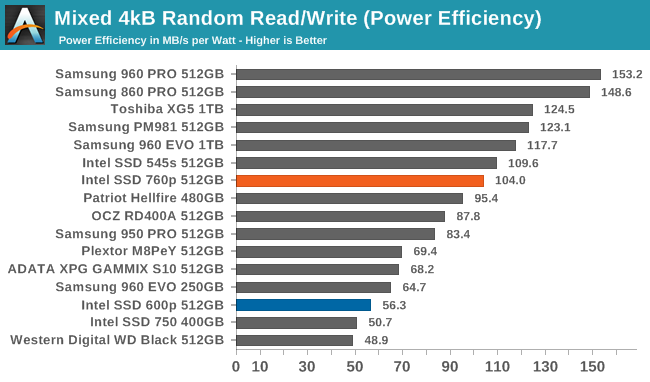
The Intel SSD 760p does not score quite as well for power efficiency as it does for raw performance on the mixed random I/O test, but it is still above average and far better than previous Intel SSDs.
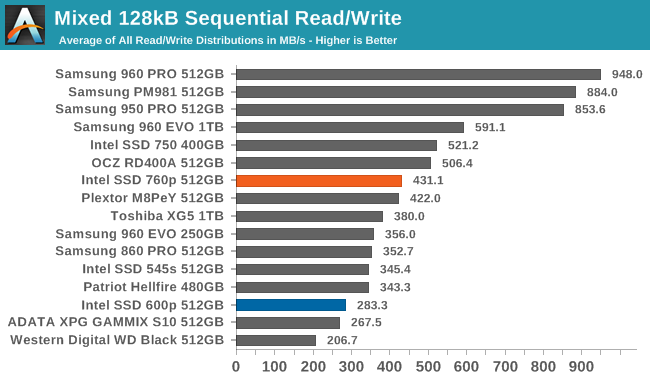
The average performance of the Intel SSD 760p on the mixed sequential workload test does not exceed the limits of a SATA link, but it does clearly beat the best speed achieved by a SATA drive on this test. Previous budget NVMe SSDs have failed to even match the fastest SATA SSDs due to the use of slow TLC NAND.
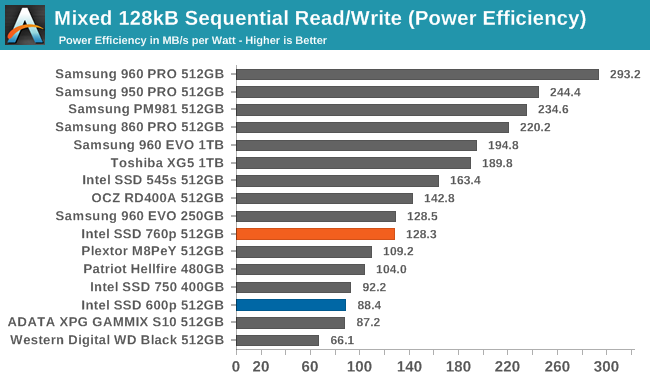
The power efficiency of the Intel SSD 760p on the mixed sequential I/O test is not great. It only beats drives that were notably slow (600p, WD Black) or unusually power-hungry (Intel 750, Plextor M8PeY). Samsung and Toshiba have set a much higher standard.