


<br>")


 ' alt='위대한 인류최대 수퍼로켓 '스타십(Spacex Starship)' 발사 성공 by 인공지능' />
’ 오픈<br>")


<br>")


 다운로드 및 설치<br>")
![삼성, 잃어버린 10년 [풀영상] | 창 458회 (KBS 24.03.12) by 인공지능](https://raptor-hw.net/xe/files/thumbnails/453/204/271x205.crop.jpg "삼성, 잃어버린 10년 [풀영상] | 창 458회 (KBS 24.03.12)<br>")
, 전세계 일자리 파괴 가속화 “육체노동만 살아남나?”<br>")


| Intel Core i7 Coffee Lake | |||||||||
| AnandTech | Cores | TDP | Freq | L3 | vPro | DRAM DDR4 | iGPU | iGPU Turbo | |
| Core i7-8086K | $425 | 6 / 12 | 95 W | 4.0 / 5.0 | 12 MB | No | 2666 | 24 EUs | 1200 |
| Core i7-8700K | $359 | 6 / 12 | 95 W | 3.7 / 4.7 | 12 MB | No | 2666 | 24 EUs | 1200 |
| Core i7-8700 | $303 | 6 / 12 | 65 W | 3.2 / 4.6 | 12 MB | Yes | 2666 | 24 EUs | 1200 |
| Core i7-8700T | $303 | 6 / 12 | 35 W | 2.4 / 4.0 | 12 MB | Yes | 2666 | 24 EUs | 1200 |
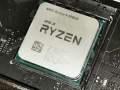
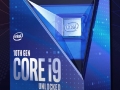
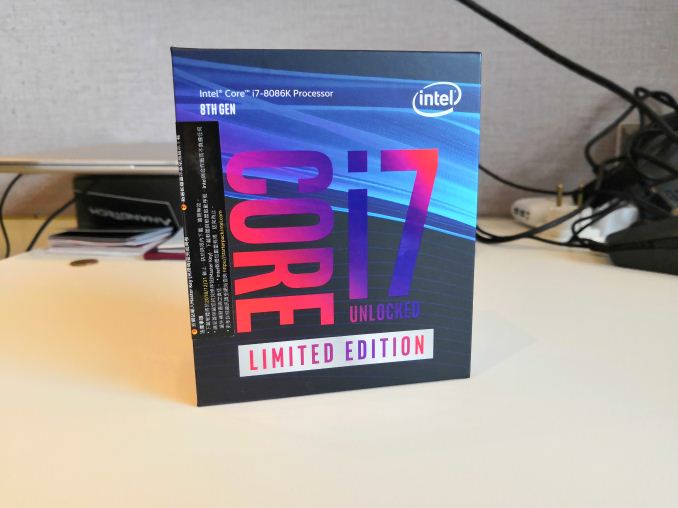
신형 Core i7-8086K는 6코어 12스레드, 95와트 TDP, 베이스 4.0 / 부스트 5.0 클럭, L3 12MB, 24EU 내장 그래픽, 가격은 425달러

8세대 커피레이크 시리즈 터보클럭 비교표

8086K 뚜따, 써멀 확인
[ 테스트 시스템 ]
| Test Setup | |||||
| Intel Core | |||||
| Processor | LGA1151 | ||||
| i7-8086K i7-8700K | 6C / 12T 6C / 12T | 4.0 / 5.0 GHz 3.7 / 4.7 GHz | 95 W 95 W | $425 $350 | |
| Motherboards | ASRock Z370 Taichi | ||||
| BIOS | P1.80 | ||||
| Spectre/Meltdown Applied | Yes | ||||
| Cooling | Cooler Master CLC | ||||
| Power Supply | Cooler Master V1000 PSU | ||||
| Memory | Team Group DDR4-3200 (stock) | ||||
| Memory Settings | Stock: DDR4-2666 16-18-18 2T OC: DDR4-3466 16-18-18 2T | ||||
| GPUs | ASRock RX 580 Gaming | ||||
| Hard Drive | Crucial MX200 1TB | ||||
| Case | Cooler Master H500 | ||||
| OS | Windows 10 Enterprise RS3 (1803) with OS Patches | ||||


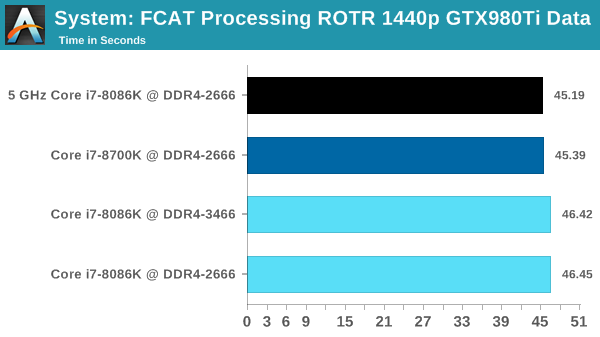
FCAT Processing: link
One of the more interesting workloads that has crossed our desks in recent quarters is FCAT - the tool we use to measure stuttering in gaming due to dropped or runt frames. The FCAT process requires enabling a color-based overlay onto a game, recording the gameplay, and then parsing the video file through the analysis software. The software is mostly single-threaded, however because the video is basically in a raw format, the file size is large and requires moving a lot of data around. For our test, we take a 90-second clip of the Rise of the Tomb Raider benchmark running on a GTX 980 Ti at 1440p, which comes in around 21 GB, and measure the time it takes to process through the visual analysis tool.
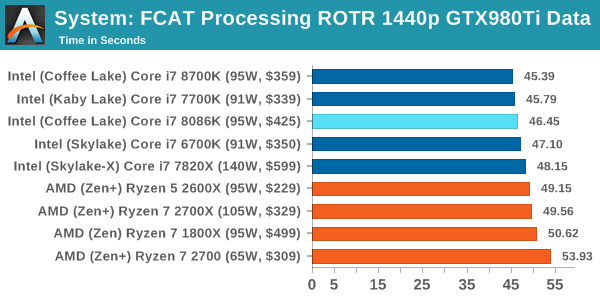
FCAT is single threaded, however in this test the full 5.0 GHz did not kick in.
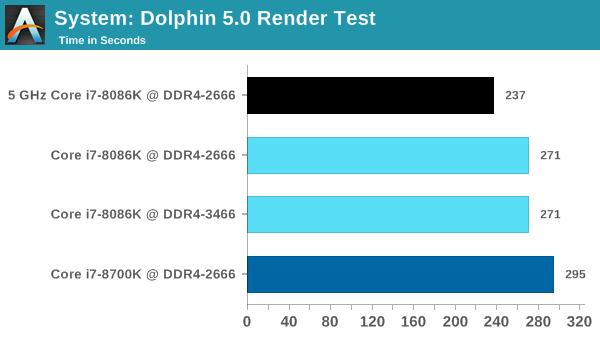
Dolphin Benchmark: link
Many emulators are often bound by single thread CPU performance, and general reports tended to suggest that Haswell provided a significant boost to emulator performance. This benchmark runs a Wii program that ray traces a complex 3D scene inside the Dolphin Wii emulator. Performance on this benchmark is a good proxy of the speed of Dolphin CPU emulation, which is an intensive single core task using most aspects of a CPU. Results are given in minutes, where the Wii itself scores 17.53 minutes.
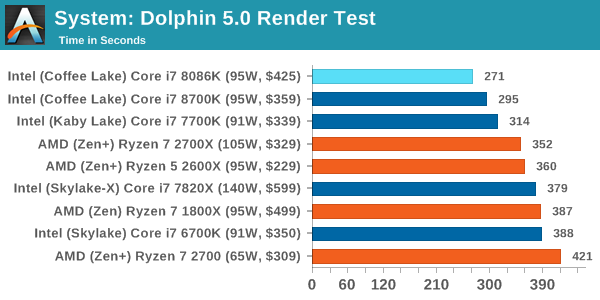
For a test that did have 5.0 GHz kick in, the 8086K takes the record in our Dolphin test.
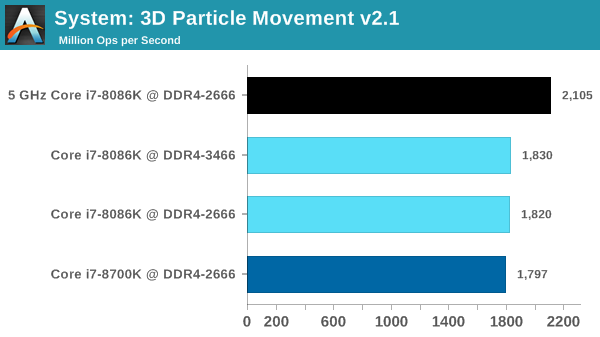
3D Movement Algorithm Test v2.1: link
This is the latest version of the self-penned 3DPM benchmark. The goal of 3DPM is to simulate semi-optimized scientific algorithms taken directly from my doctorate thesis. Version 2.1 improves over 2.0 by passing the main particle structs by reference rather than by value, and decreasing the amount of double->float->double recasts the compiler was adding in. It affords a ~25% speed-up over v2.0, which means new data.
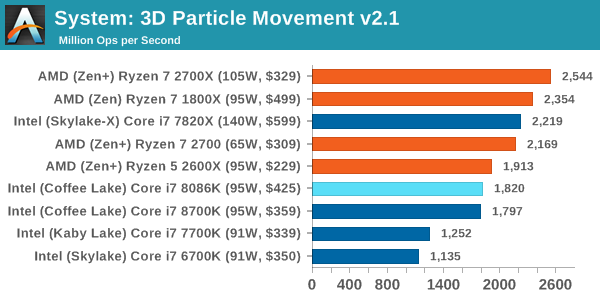
On 3DPM, the 8086K shows that the 4.3 GHz all-core is on par with the 8700K.
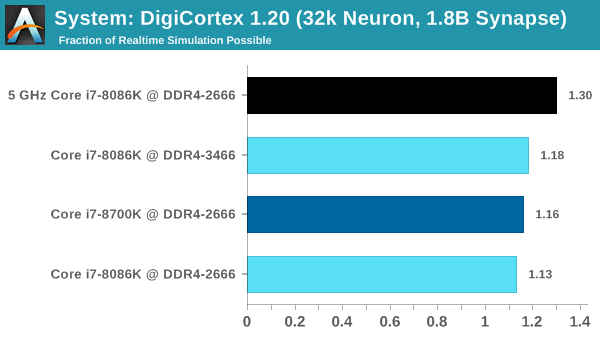
DigiCortex v1.20: link
Despite being a couple of years old, the DigiCortex software is a pet project for the visualization of neuron and synapse activity in the brain. The software comes with a variety of benchmark modes, and we take the small benchmark which runs a 32k neuron/1.8B synapse simulation. The results on the output are given as a fraction of whether the system can simulate in real-time, so anything above a value of one is suitable for real-time work. The benchmark offers a 'no firing synapse' mode, which in essence detects DRAM and bus speed, however we take the firing mode which adds CPU work with every firing.
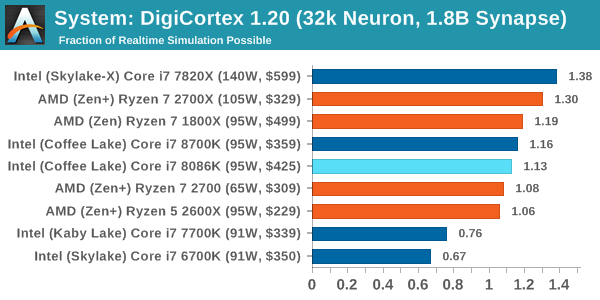
Despite the faster single core frequency, this DRAM-limited test seems to load up another core and stops the 8086K from reaching 5.0 GHz.
Agisoft Photoscan 1.3.3: link
Photoscan stays in our benchmark suite from the previous version, however now we are running on Windows 10 so features such as Speed Shift on the latest processors come into play. The concept of Photoscan is translating many 2D images into a 3D model - so the more detailed the images, and the more you have, the better the model. The algorithm has four stages, some single threaded and some multi-threaded, along with some cache/memory dependency in there as well. For some of the more variable threaded workload, features such as Speed Shift and XFR will be able to take advantage of CPU stalls or downtime, giving sizeable speedups on newer microarchitectures.
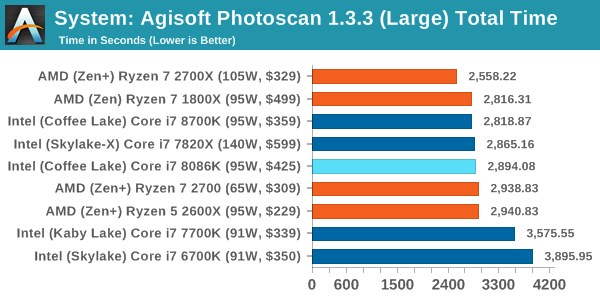
Agisoft is variable threaded, but the 8086K is still a small stones throw from the 8700K.
Corona 1.3: link
Corona is a standalone package designed to assist software like 3ds Max and Maya with photorealism via ray tracing. It's simple - shoot rays, get pixels. OK, it's more complicated than that, but the benchmark renders a fixed scene six times and offers results in terms of time and rays per second. The official benchmark tables list user submitted results in terms of time, however I feel rays per second is a better metric (in general, scores where higher is better seem to be easier to explain anyway). Corona likes to pile on the threads, so the results end up being very staggered based on thread count.
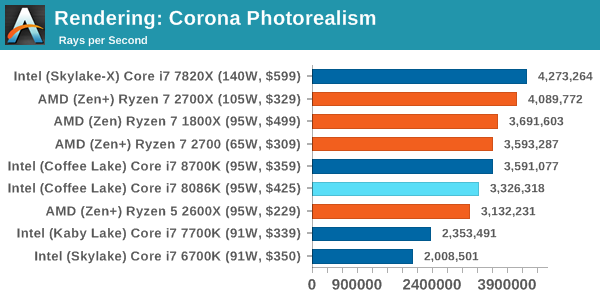
Corona is a fully multi-threaded test, so it is surprising to see the 8086K lag behind the 8700K here. This is likely a scenario where the fact that our borrowed testbed setup doesn't perfectly match our standard testbed is playing a factor.
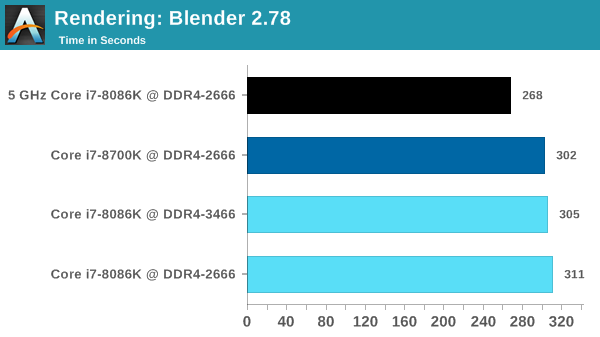
Blender 2.78: link
For a render that has been around for what seems like ages, Blender is still a highly popular tool. We managed to wrap up a standard workload into the February 5 nightly build of Blender and measure the time it takes to render the first frame of the scene. Being one of the bigger open source tools out there, it means both AMD and Intel work actively to help improve the codebase, for better or for worse on their own/each other's microarchitecture.
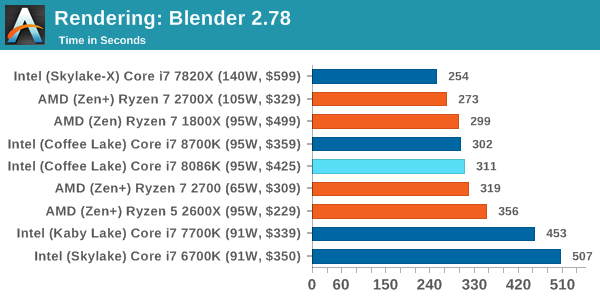
Blender also likes to load up the threads, and the 8086K is behind again.
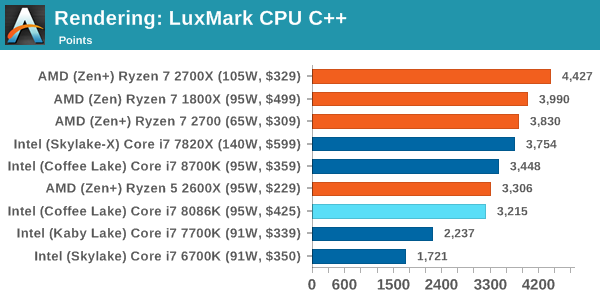
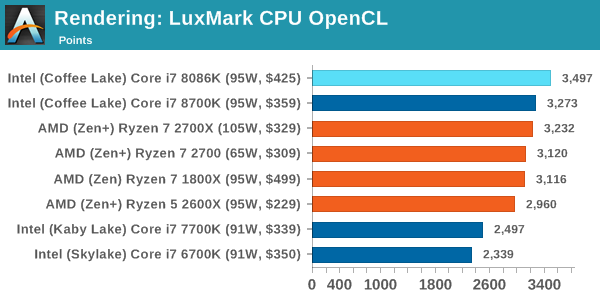
LuxMark v3.1: Link
As a synthetic, LuxMark might come across as somewhat arbitrary as a renderer, given that it's mainly used to test GPUs, but it does offer both an OpenCL and a standard C++ mode. In this instance, aside from seeing the comparison in each coding mode for cores and IPC, we also get to see the difference in performance moving from a C++ based code-stack to an OpenCL one with a CPU as the main host.
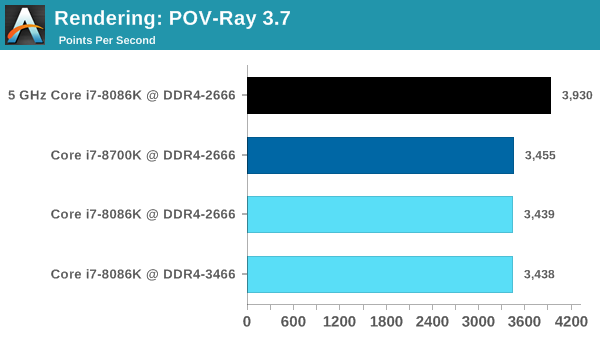
POV-Ray 3.7.1b4
Another regular benchmark in most suites, POV-Ray is another ray-tracer but has been around for many years. It just so happens that during the run up to AMD's Ryzen launch, the code base started to get active again with developers making changes to the code and pushing out updates. Our version and benchmarking started just before that was happening, but given time we will see where the POV-Ray code ends up and adjust in due course.
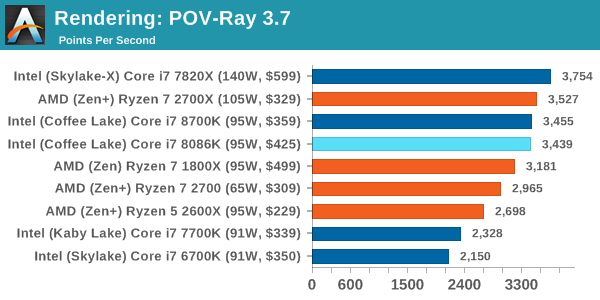
Virtually identical scores between the 8086K and 8700K in POV-Ray.
Cinebench R15: link
The latest version of CineBench has also become one of those 'used everywhere' benchmarks, particularly as an indicator of single thread performance. High IPC and high frequency gives performance in ST, whereas having good scaling and many cores is where the MT test wins out.
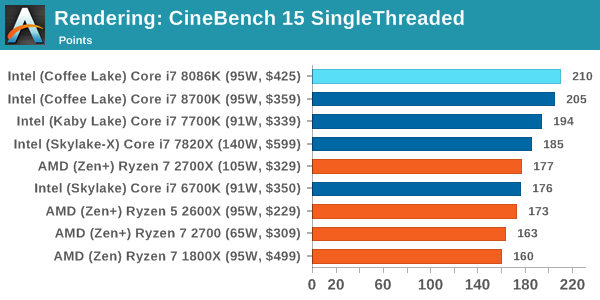
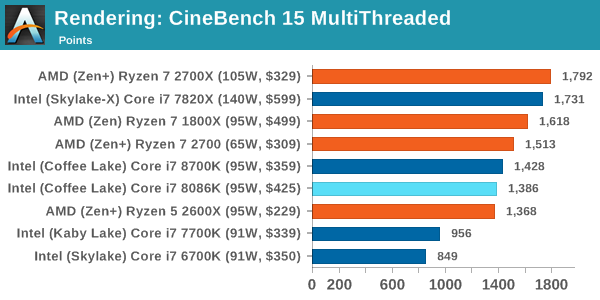
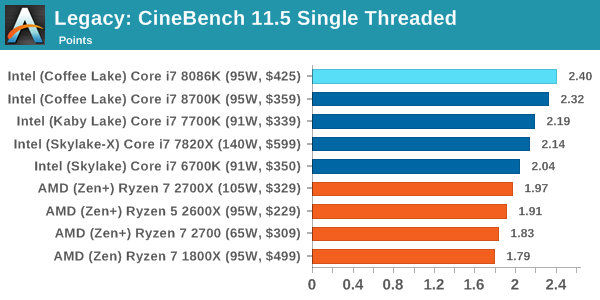
The 8086K gets a new fastest single core score in CineBench R15 ST, but falls slightly behind the 8700K in MT.
7-Zip 9.2
One of the freeware compression tools that offers good scaling performance between processors is 7-Zip. It runs under an open-source licence, is fast, and easy to use tool for power users. We run the benchmark mode via the command line for four loops and take the output score.
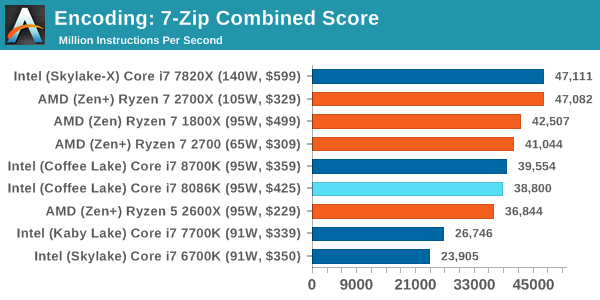
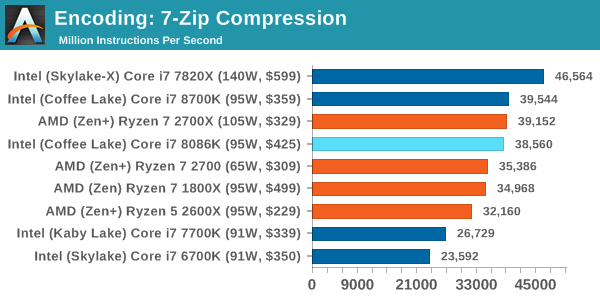
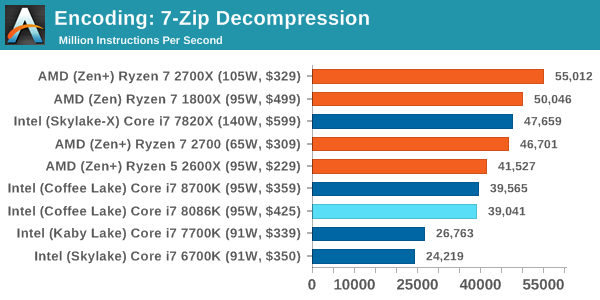
Again, trading blows with the 8700K, but falling behind a little bit.
WinRAR 5.40
For the 2017 test suite, we move to the latest version of WinRAR in our compression test. WinRAR in some quarters is more user friendly that 7-Zip, hence its inclusion. Rather than use a benchmark mode as we did with 7-Zip, here we take a set of files representative of a generic stack (33 video files in 1.37 GB, 2834 smaller website files in 370 folders in 150 MB) of compressible and incompressible formats. The results shown are the time taken to encode the file. Due to DRAM caching, we run the test 10 times and take the average of the last five runs when the benchmark is in a steady state.
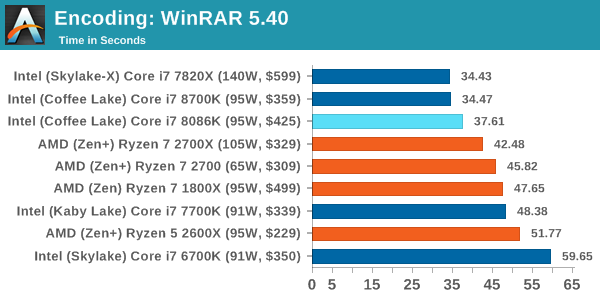
The 8086K takes another benchmark sitting behind the 8700K.
AES Encoding
Algorithms using AES coding have spread far and wide as a ubiquitous tool for encryption. Again, this is another CPU limited test, and modern CPUs have special AES pathways to accelerate their performance. We often see scaling in both frequency and cores with this benchmark. We use the latest version of TrueCrypt and run its benchmark mode over 1GB of in-DRAM data. Results shown are the GB/s average of encryption and decryption.
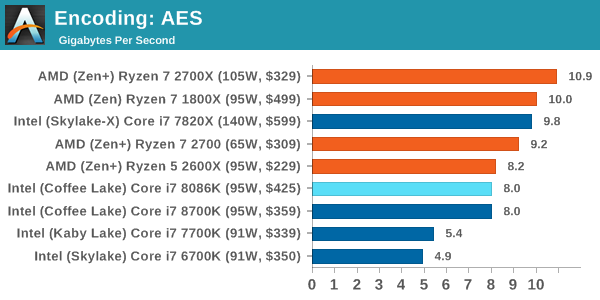
Under AES encoding we get literally identical results.
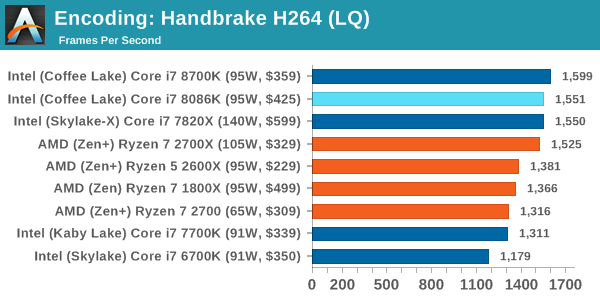
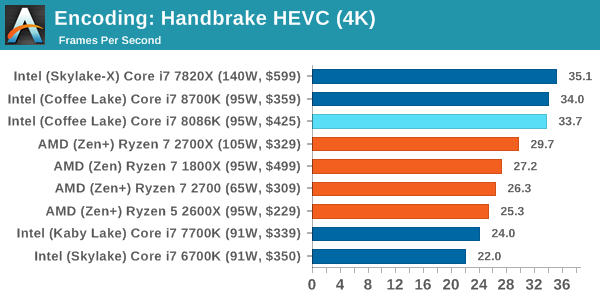
HandBrake v1.0.2 H264 and HEVC: link
As mentioned above, video transcoding (both encode and decode) is a hot topic in performance metrics as more and more content is being created. First consideration is the standard in which the video is encoded, which can be lossless or lossy, trade performance for file-size, trade quality for file-size, or all of the above can increase encoding rates to help accelerate decoding rates. Alongside Google's favorite codec, VP9, there are two others that are taking hold: H264, the older codec, is practically everywhere and is designed to be optimized for 1080p video, and HEVC (or H265) that is aimed to provide the same quality as H264 but at a lower file-size (or better quality for the same size). HEVC is important as 4K is streamed over the air, meaning less bits need to be transferred for the same quality content.
Handbrake is a favored tool for transcoding, and so our test regime takes care of three areas.
Low Quality/Resolution H264: Here we transcode a 640x266 H264 rip of a 2 hour film, and change the encoding from Main profile to High profile, using the very-fast preset.
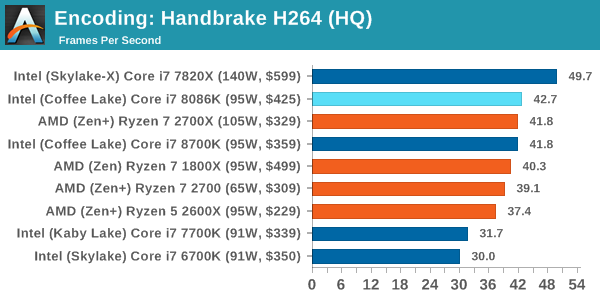
High Quality/Resolution H264: A similar test, but this time we take a ten-minute double 4K (3840x4320) file running at 60 Hz and transcode from Main to High, using the very-fast preset.
HEVC Test: Using the same video in HQ, we change the resolution and codec of the original video from 4K60 in H264 into 4K60 HEVC.
Chromium Compile (v56)
Our new compilation test uses Windows 10 Pro, VS Community 2015.3 with the Win10 SDK to combile a nightly build of Chromium. We've fixed the test for a build in late March 2017, and we run a fresh full compile in our test. Compilation is the typical example given of a variable threaded workload - some of the compile and linking is linear, whereas other parts are multithreaded.
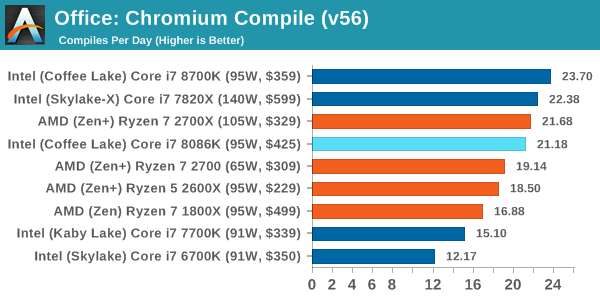
This is another case where I think our improvised testbed is playing a bigger part, and I'd like to eventually re-run this on my standard testbed. Especially as compiling heavily hits more than just the CPU.
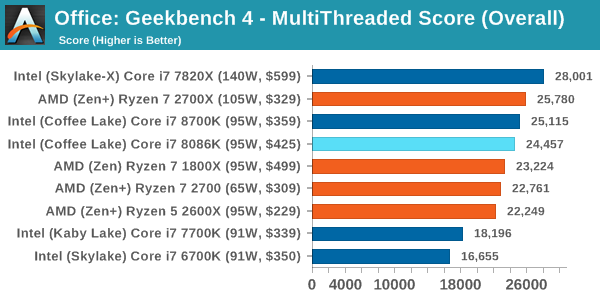
GeekBench4: link
Due to numerous requests, GeekBench 4 is now part of our suite. GB4 is a synthetic test using algorithms often seen in high-performance workloads along with a series of memory focused tests. GB4’s biggest asset is a single-number output which its users seem to love, although it is not always easy to translate that number into real-world performance comparisons.
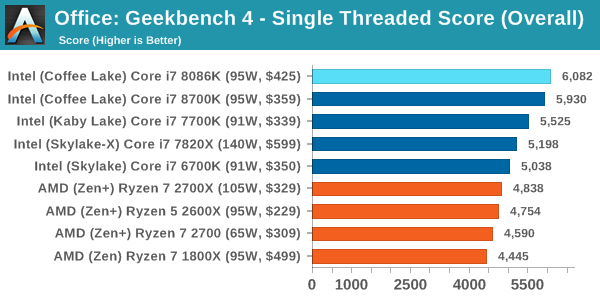
Like CineBench, the Core i7-8086K does will on the synthetic single threaded test.
PCMark8: link
Despite originally coming out in 2008/2009, Futuremark has maintained PCMark8 to remain relevant in 2017. On the scale of complicated tasks, PCMark focuses more on the low-to-mid range of professional workloads, making it a good indicator for what people consider 'office' work. We run the benchmark from the commandline in 'conventional' mode, meaning C++ over OpenCL, to remove the graphics card from the equation and focus purely on the CPU. PCMark8 offers Home, Work and Creative workloads, with some software tests shared and others unique to each benchmark set.
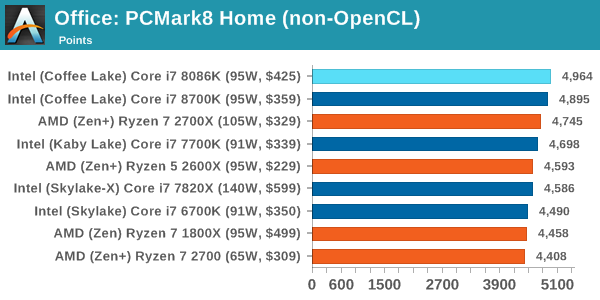
Here the 8086K does eek out a win over the 8700K, although just barely.
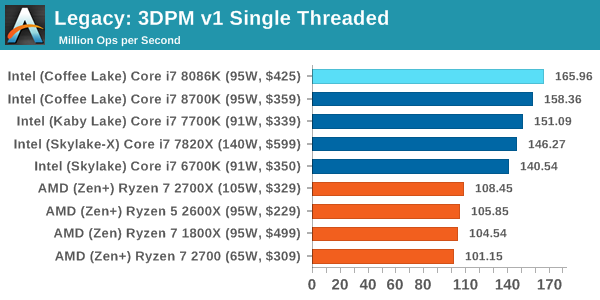
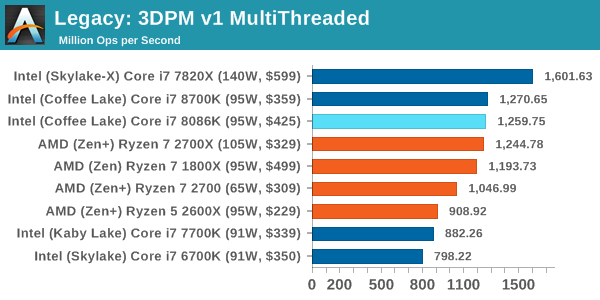
3D Particle Movement v1
3DPM is a self-penned benchmark, taking basic 3D movement algorithms used in Brownian Motion simulations and testing them for speed. High floating point performance, MHz and IPC wins in the single thread version, whereas the multithread version has to handle the threads and loves more cores. This is the original version, written in the style of a typical non-computer science student coding up an algorithm for their theoretical problem, and comes without any non-obvious optimizations not already performed by the compiler, such as false sharing.
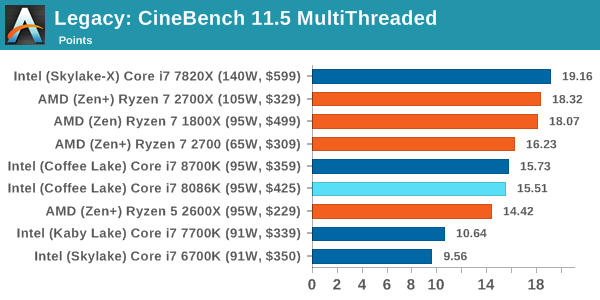
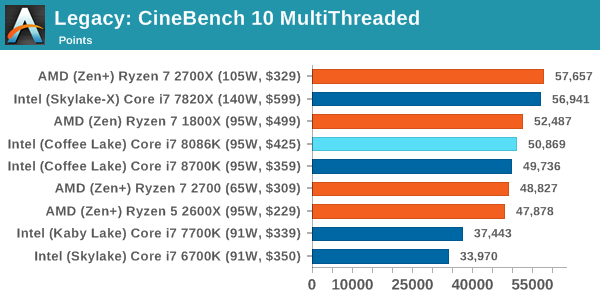
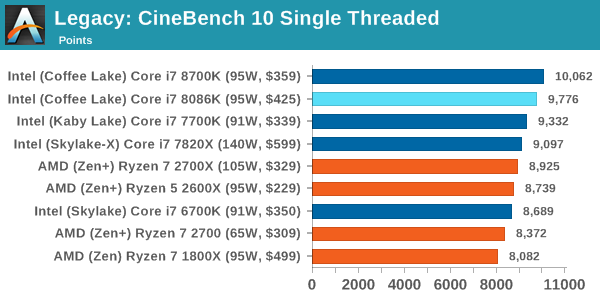
CineBench 11.5 and 10
Cinebench is a widely known benchmarking tool for measuring performance relative to MAXON's animation software Cinema 4D. Cinebench has been optimized over a decade and focuses on purely CPU horsepower, meaning if there is a discrepancy in pure throughput characteristics, Cinebench is likely to show that discrepancy. Arguably other software doesn't make use of all the tools available, so the real world relevance might purely be academic, but given our large database of data for Cinebench it seems difficult to ignore a small five minute test. We run the modern version 15 in this test, as well as the older 11.5 and 10 due to our back data.
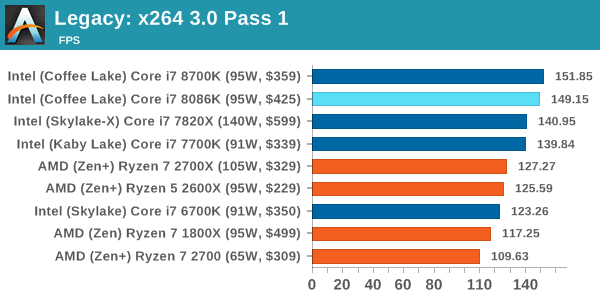
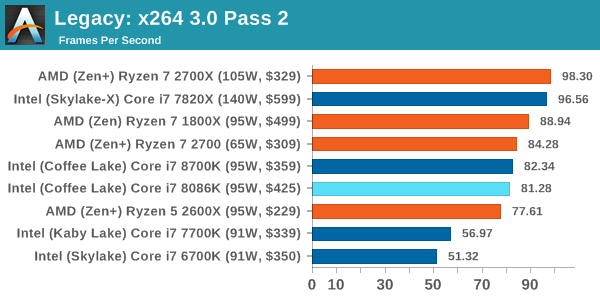
x264 HD 3.0
Similarly, the x264 HD 3.0 package we use here is also kept for historic regressional data. The latest version is 5.0.1, and encodes a 1080p video clip into a high quality x264 file. Version 3.0 only performs the same test on a 720p file, and in most circumstances the software performance hits its limit on high end processors, but still works well for mainstream and low-end. Also, this version only takes a few minutes, whereas the latest can take over 90 minutes to run.
ASRock RX 580 Performance
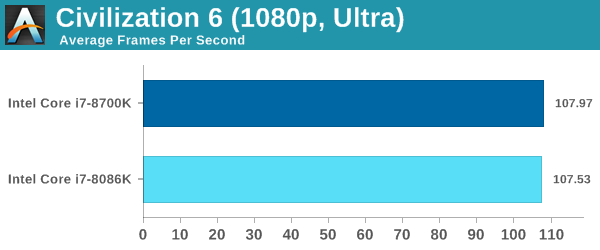
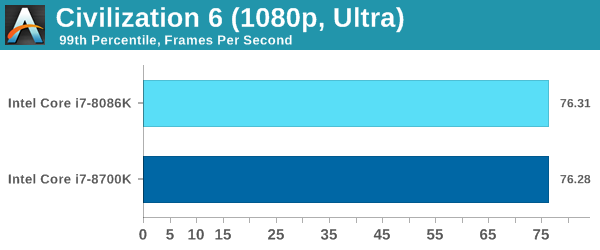
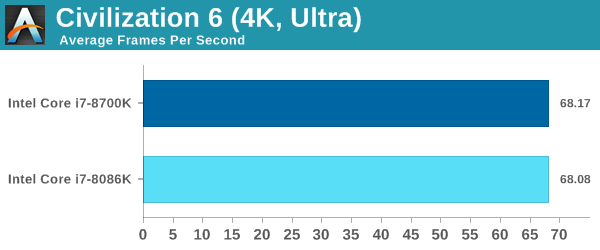
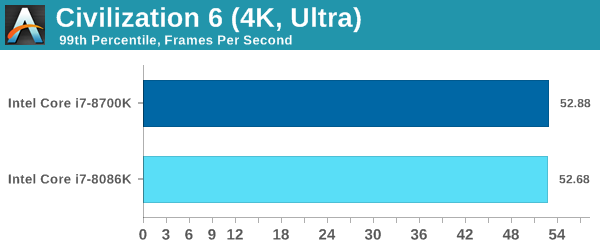
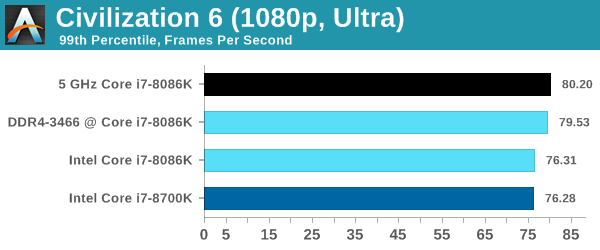
Almost zero difference for Civilization between the two. The 8086K is never in a situation to fire up to 5.0 GHz.
ASRock RX 580 Performance
ASRock RX 580 Performance
ASRock RX 580 Performance
ASRock RX 580 Performance

Overclocking Performance: CPU Tests
In the third page of the review we showed our overclocking results, with our CPU managing to hit 5.1 GHz stable with a sizeable increase in voltage. Running at 5.1 GHz incurred rather high temperatures however, so for our benchmark suite we dialed back to 5.0 GHz and run a number of our tests again at this fast speed. We also ran some benchmarks at stock frequency but with increased DRAM frequencies. We ran the DRAM in our ASRock provided system at DDR4-3466, slightly overclocked beyond its DDR4-3200 sticker value.
For this page (and the next), we’ll show the overclocked results of the Core i7-8086K using the fast memory kits as well as the 5.0 GHz overclocked setting (at base memory). The Core i7-8700K numbers are also included for reference.
FCAT Processing
3DPM v2.1
Dolphin v5
DigiCortex v1.20
Blender
POV-Ray
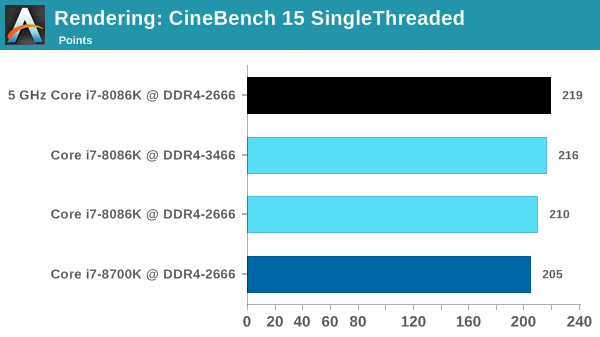
Cinebench R15 ST
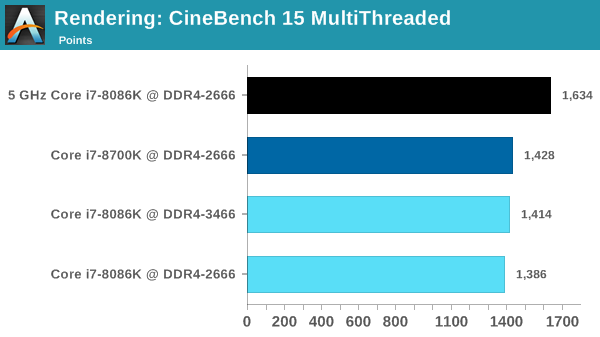
Cinebench R15 MT
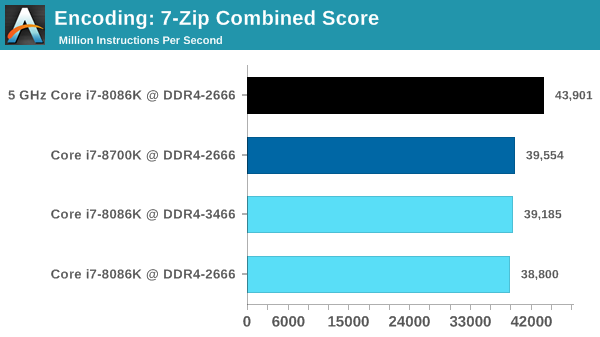
7-zip
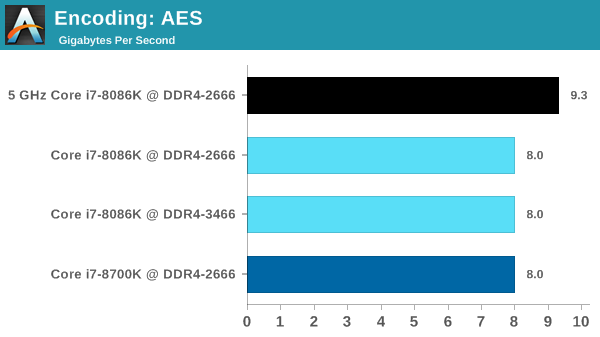
TrueCrypt
GeekBench 4 ST
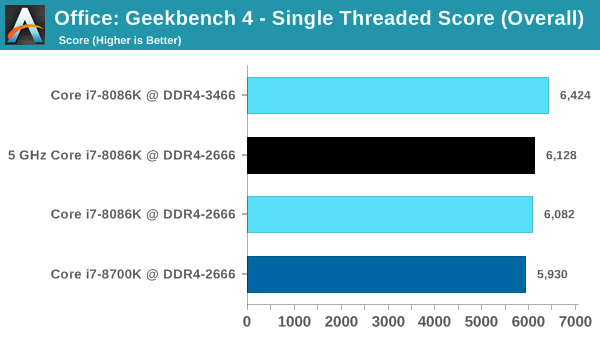
GeekBench 4 MT
For everything except the most lightly threaded workloads, overclocking the 8086K to a flat-out 5GHz shows some reasonable gains. These results aren't you couldn't already extrapolate based on the clockspeeds, but it's nice to put theory to practice. It also highlights the unfortunate shortcoming of the CPU: being able to turbo one thread to 5GHz just isn't that useful, since you'll very rarely have a complete system workload that allows it, even if the heaviest workload is single-threaded. The 8086K simply begs to be run at a flat-out 5GHz to get the most out of its capabilities.
Overclocking Performance: GPU Tests
In the third page of the review we showed our overclocking results, with our CPU managing to hit 5.1 GHz stable with a sizeable increase in voltage. 5.1 GHz was also high in temperatures, so for our benchmark suite, we dialed back to 5.0 GHz and run a number of our tests again at this fast speed. We also ran some benchmarks at stock frequency but with increased DRAM frequencies. We initially ran the DRAM in our ASRock provided system at DDR4-3466, slightly overclocked beyond its DDR4-3200 sticker value.
For this page (and the next), we’ll show the overclocked results of the Core i7-8086K using the fast memory kits as well as the 5.0 GHz overclocked setting (at base memory). The Core i7-8700K numbers are also included for reference.
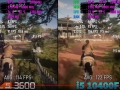
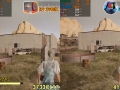
Civilization 6
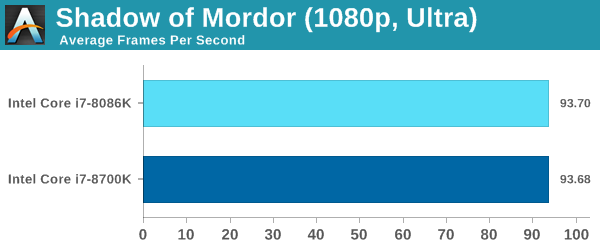
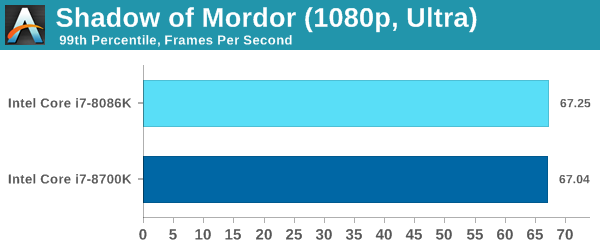
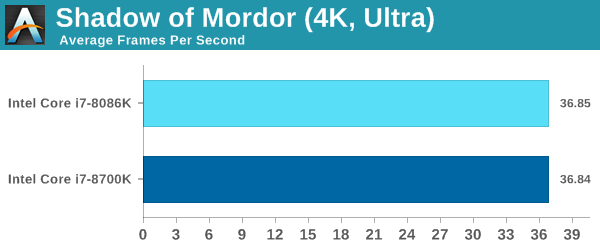
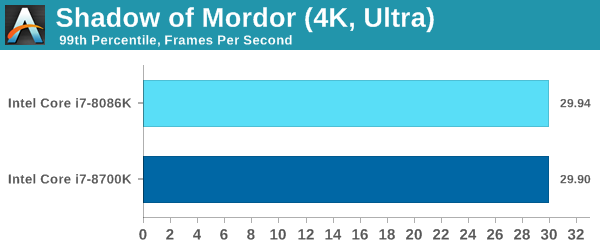
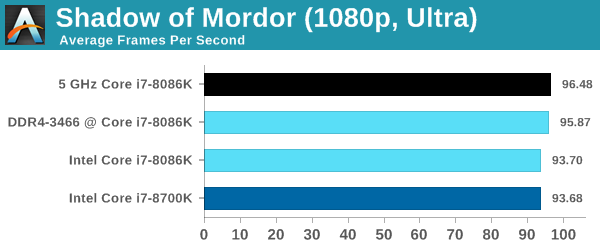
Shadow of Mordor
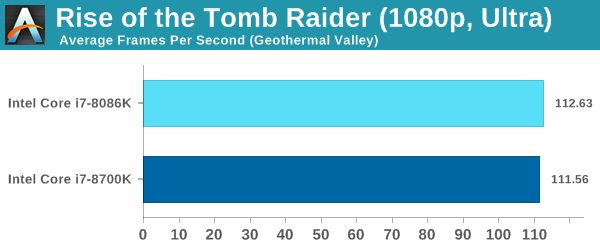
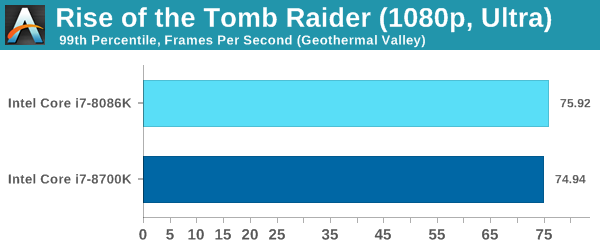
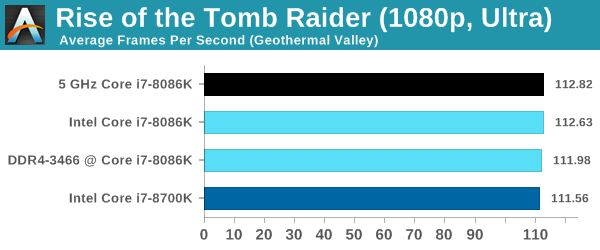
Rise of the Tomb Raider
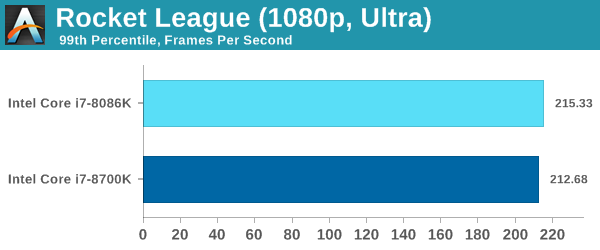
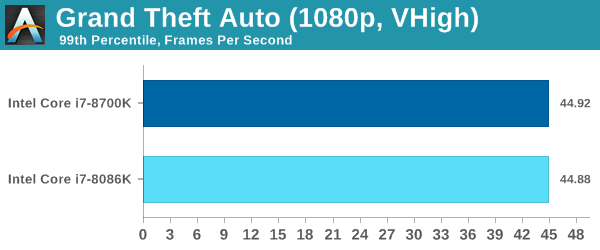
Grand Theft Auto V
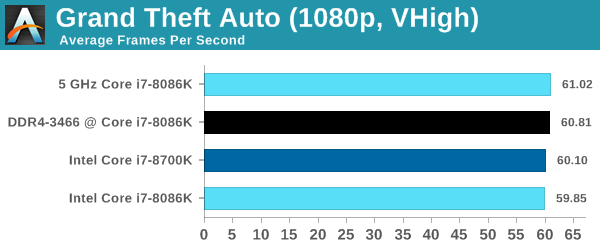
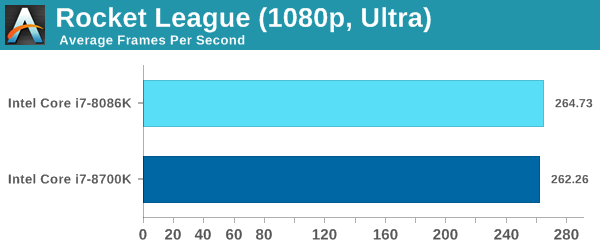
There's not much to say with our GPU testing since we ended up being GPU-bound most of the time against the Radeon RX 580. In a more CPU-limited scenario overclocking should help, but these aren't it. Though at some point I'd like to dig into Civilization 6 turn times with the 8086K, as that stands to prove more impactful.