


<br>")
 ' alt='위대한 인류최대 수퍼로켓 '스타십(Spacex Starship)' 발사 성공 by 인공지능' />
<br>")


, 전세계 일자리 파괴 가속화 “육체노동만 살아남나?”<br>")


![삼성, 잃어버린 10년 [풀영상] | 창 458회 (KBS 24.03.12) by 인공지능](https://raptor-hw.net/xe/files/thumbnails/453/204/271x205.crop.jpg "삼성, 잃어버린 10년 [풀영상] | 창 458회 (KBS 24.03.12)<br>")
’ 오픈<br>")
 다운로드 및 설치<br>")


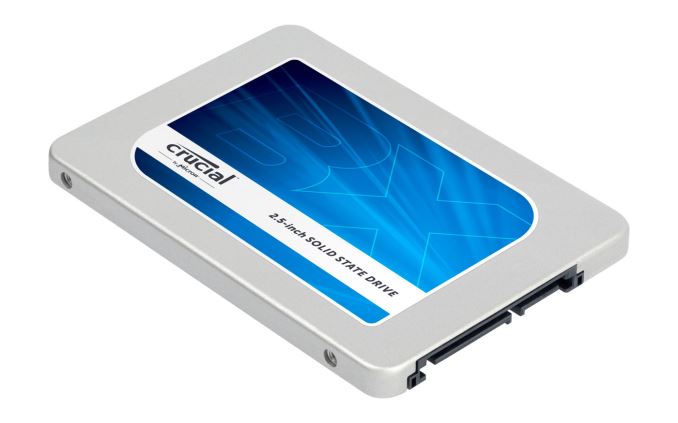
| Crucial 480/500/512GB SSD Comparison | |||
| Drive | BX100 | BX200 | MX200 |
| Controller | Silicon Motion SM2246EN | Silicon Motion SM2256 | Marvell 88SS9189 |
| NAND | Micron 16nm 128Gbit MLC | Micron 16nm 128Gbit TLC NAND | Micron 16nm 128Gbit MLC |
| Sequential Read | 535 MB/s | 540 MB/s | 555 MB/s |
| Sequential Write | 450 MB/s | 490 MB/s | 500 MB/s |
| 4kB Random Read | 90k IOPS | 66k IOPS | 100k IOPS |
| 4kB Random Write | 70k IOPS | 78k IOPS | 87k IOPS |
| Endurance | 72 TB | 72 TB | 160 TB |
| Warranty | 3 years | ||
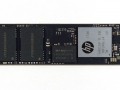
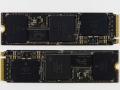
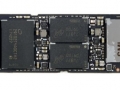
마이크론 BX200 SDD 스펙. 기존 BX100의 실리콘 모션 SM2246EN 컨트롤러에서 SM2256으로 향상, 낸드는 처음으로 16나노 TLC 128Gbit 탑재, 시퀀셜 읽기 성능 540MB/s, 시퀀셜 쓰기 성능 490MB/s, 4K 랜덤 읽기 66k, 랜덤 쓰기 78k, 3년 워런티 제공
[ 테스트 시스템 ]
| AnandTech 2015 SSD Test System | |
| CPU | Intel Core i7-4770K running at 3.5GHz (Turbo & EIST enabled, C-states disabled) |
| Motherboard | ASUS Z97 Deluxe (BIOS 2501) |
| Chipset | Intel Z97 |
| Chipset Drivers | Intel 10.0.24+ Intel RST 13.2.4.1000 |
| Memory | Corsair Vengeance DDR3-1866 2x8GB (9-10-9-27 2T) |
| Graphics | Intel HD Graphics 4600 |
| Graphics Drivers | 15.33.8.64.3345 |
| Desktop Resolution | 1920 x 1200 |
| OS | Windows 8.1 x64 |
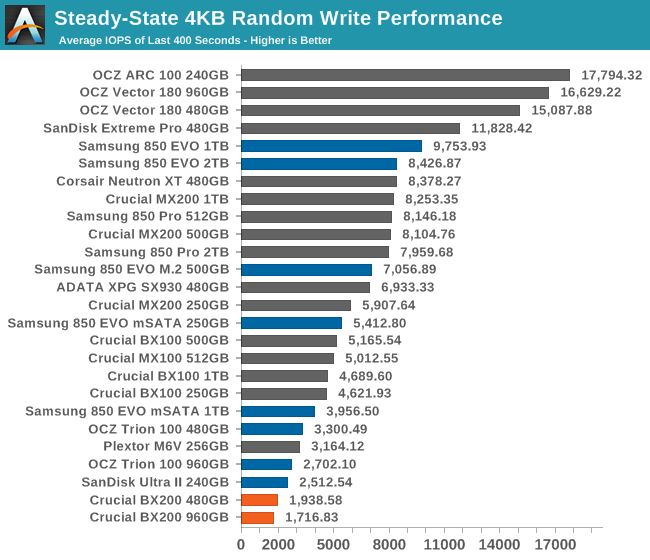
The BX200 is off to a poor start, with very low steady-state IOPS where the BX100 managed to place closer to the middle of the pack.
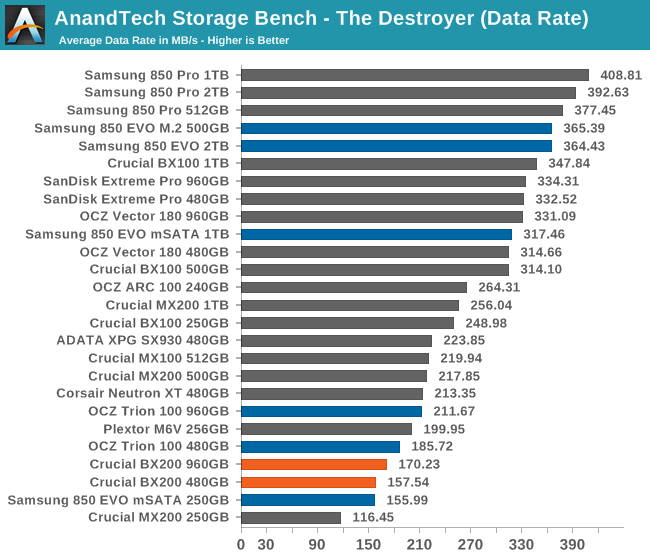
The BX100's performance on The Destroyer isn't dead last, but it underperforms for its capacity.
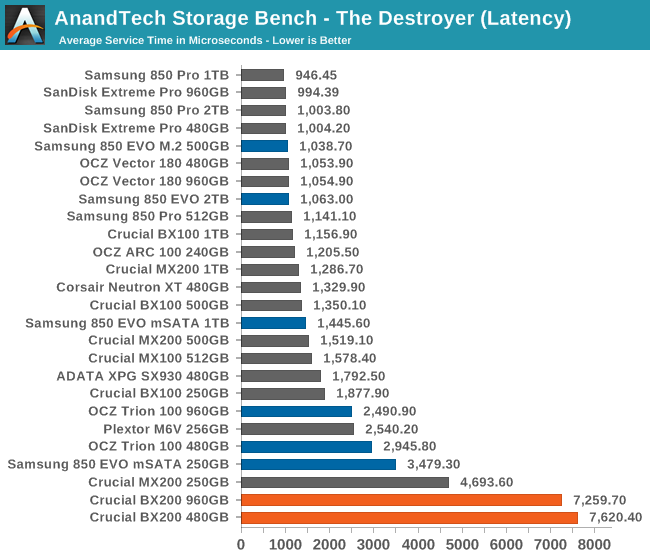
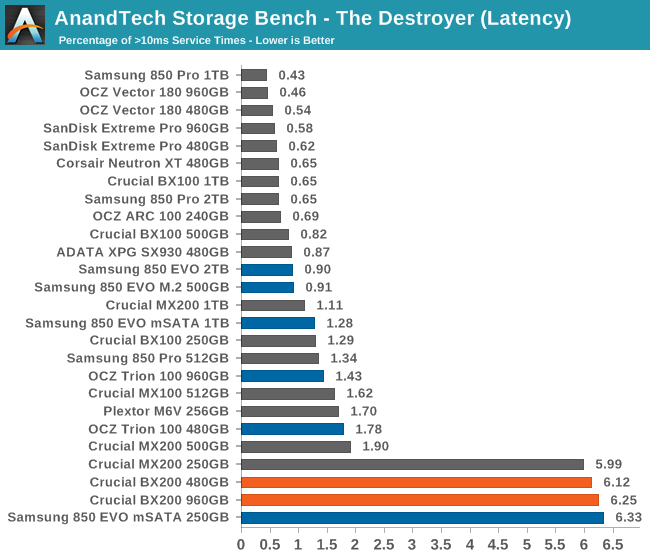
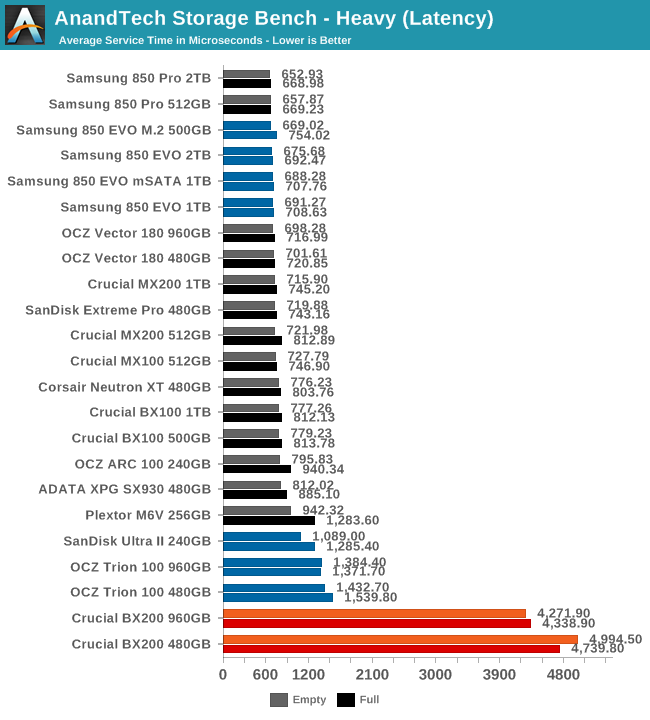
Average service time is startlingly high and is close to a hard drive's seek time.
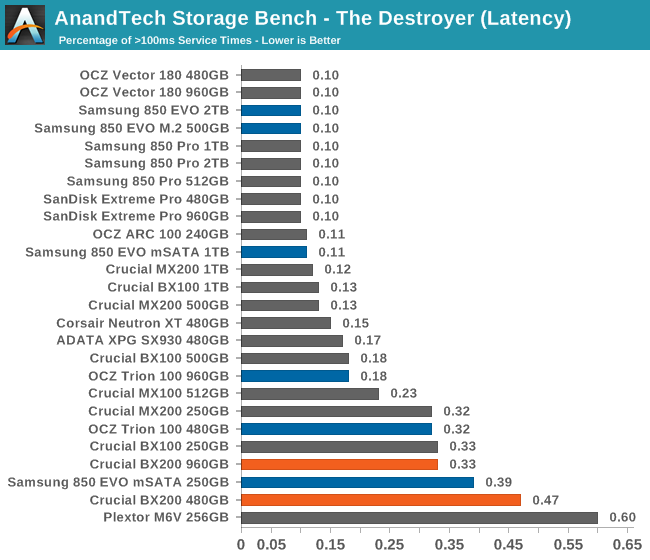
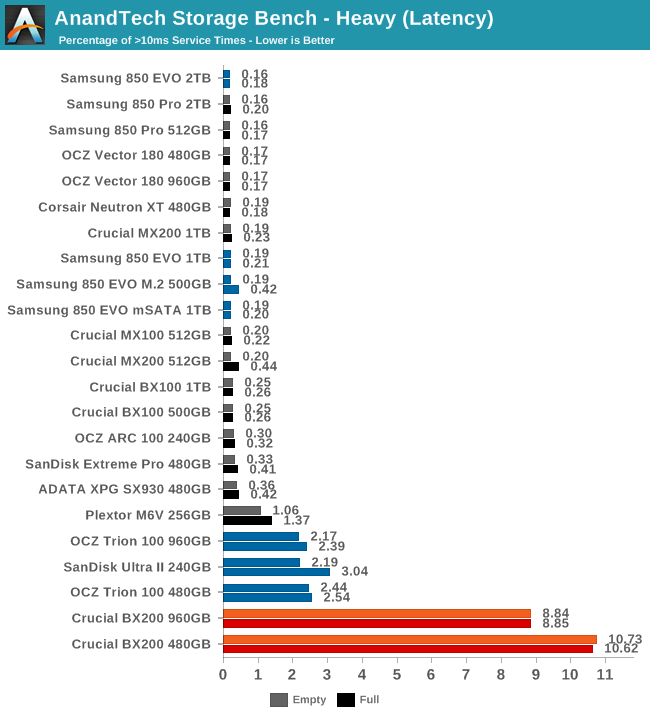
The frequency of performance outliers is in line with the other two low performers on this test, indicating that the BX200's performance doesn't stutter any more often, but it pauses for longer periods of time when it does stutter.
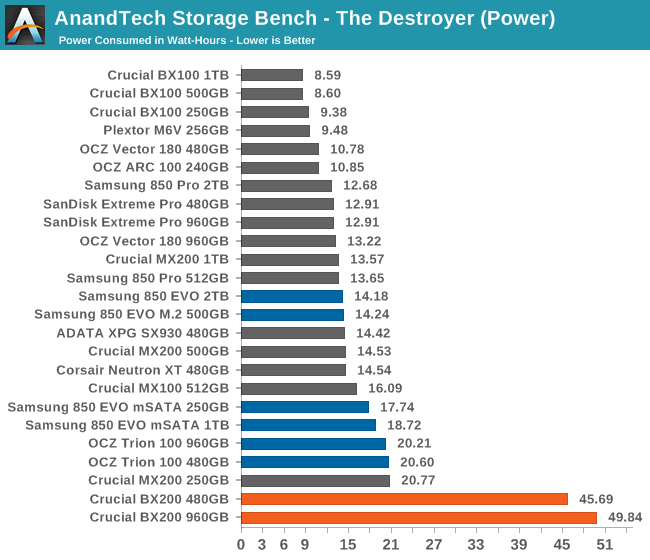
Higher power consumption is to be expected from a drive using TLC NAND, but the BX200 consumed more than twice the energy over the duration of The Destroyer than any of the other drives, and more than five times as much as the BX100. The BX200 didn't take vastly more time to complete The Destroyer, so it was clearly not making good use of idle time.
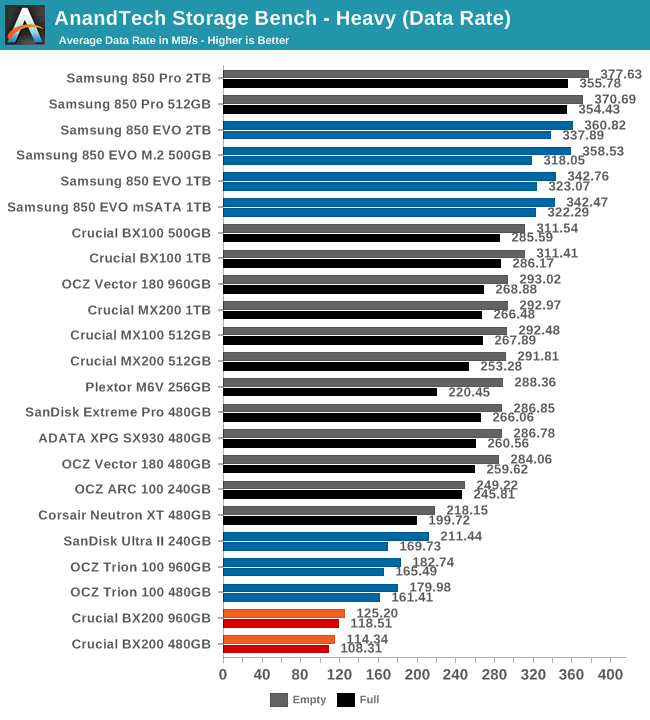
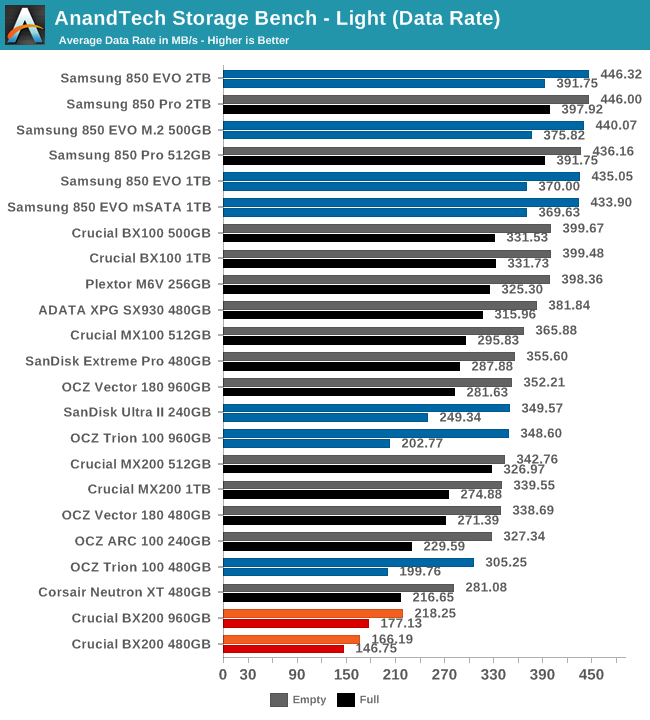
Even our Light test is enough to hit the BX200 where it hurts. The 480GB drive's average data rate is around what the first-generation SATA interface could handle.
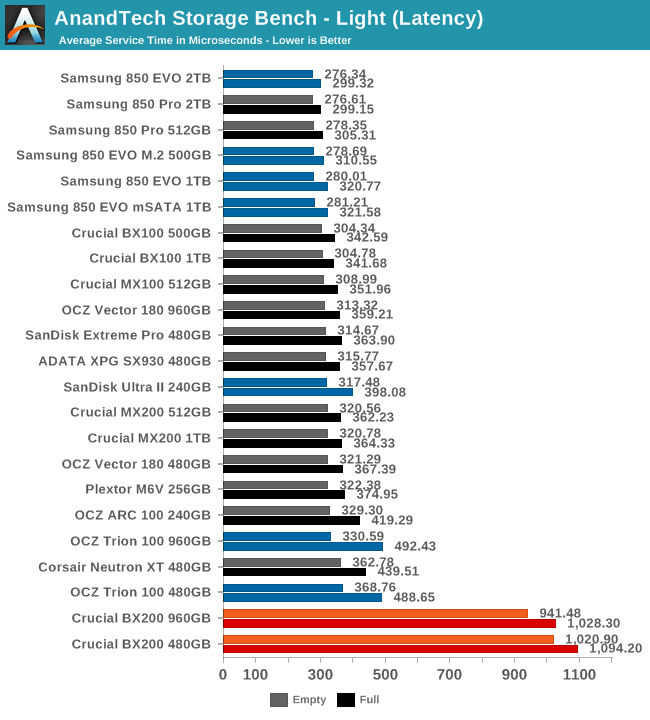
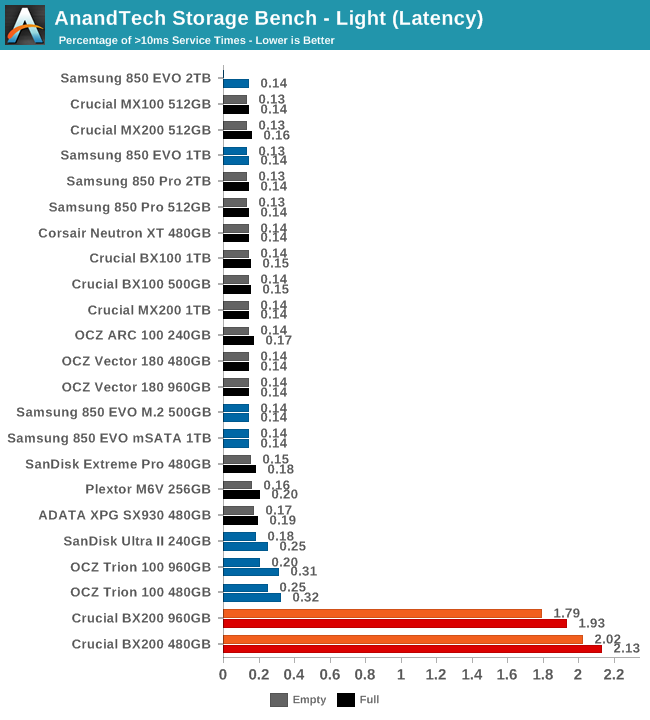
The latency outliers are the most disturbing result so far. The Light test should not enough to bring a SSD to its knees.
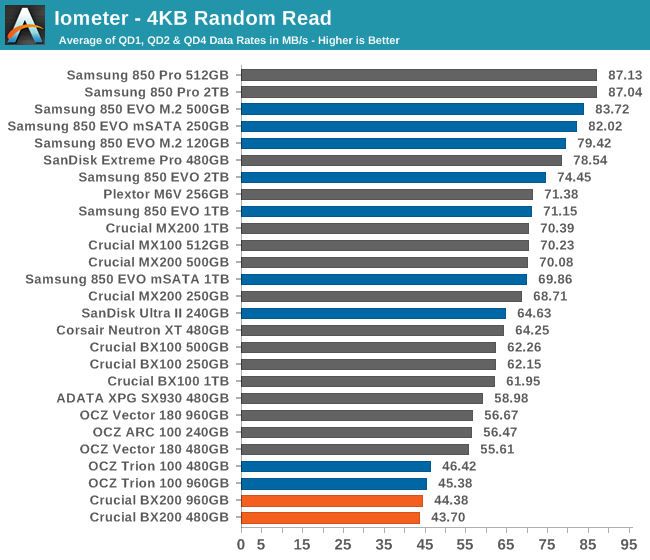
Random reads are slow, but at least the BX200 has company. This is what slow TLC flash does, but unlike many other results so far, this performance is not cause for major concern.
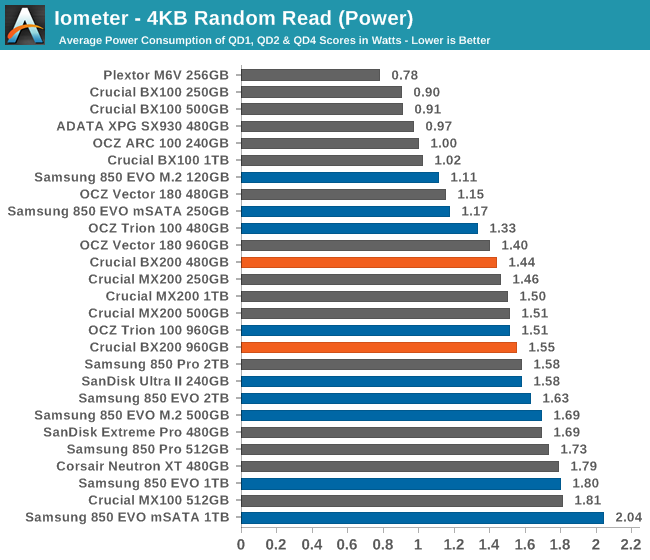
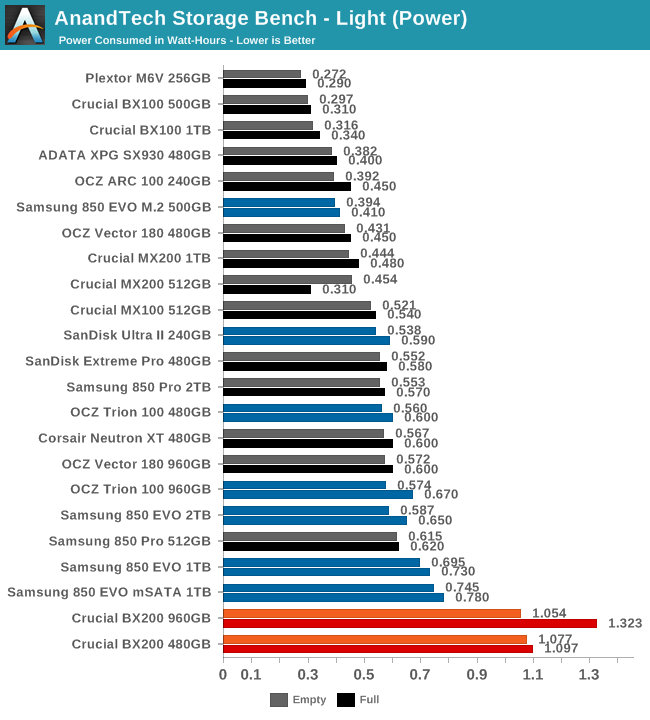
Power consumption is in the middle of the pack, so the BX200 is doing something (almost) right when handling reads.
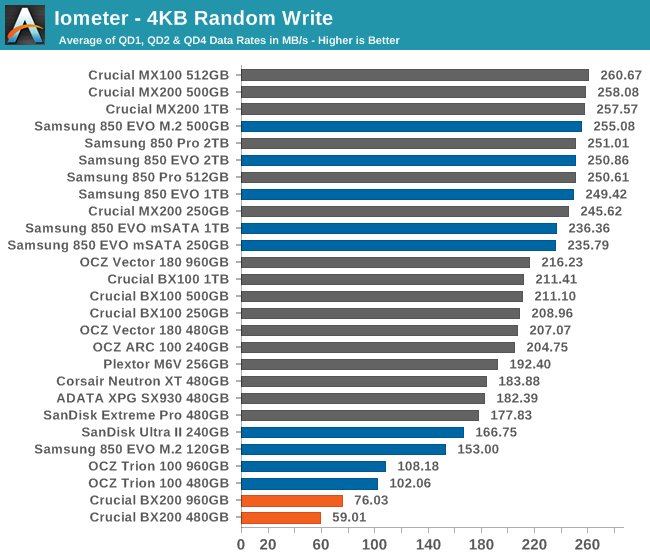
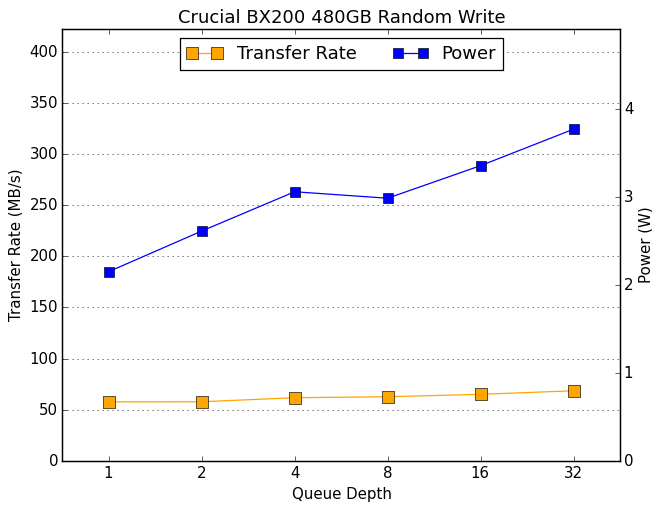
Our Iometer tests run for three minutes at each queue depth, so within 9 minutes the BX200 is clearly having trouble. The higher capacity of the the 960GB drive seems to help a lot, which suggests that the 240GB BX200's performance might be much worse than that of the 480GB.
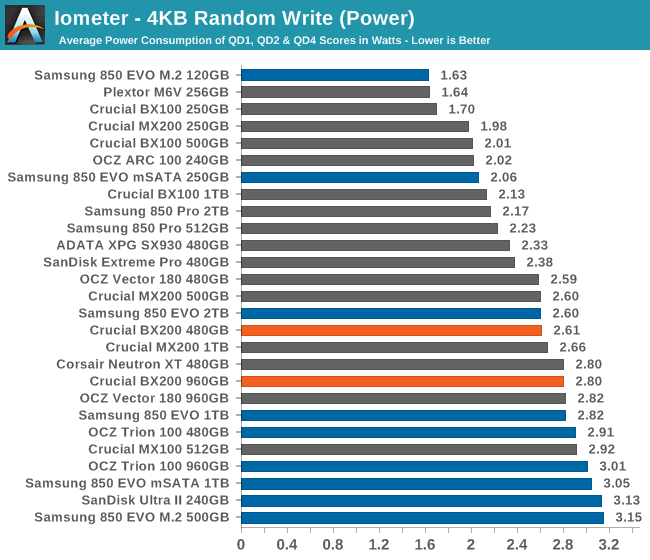
Power consumption is normal for a TLC drive, which suggests that there are a lot of background writes being done by the drive that are keeping power consumption up in spite of how little real work is getting done.
 |
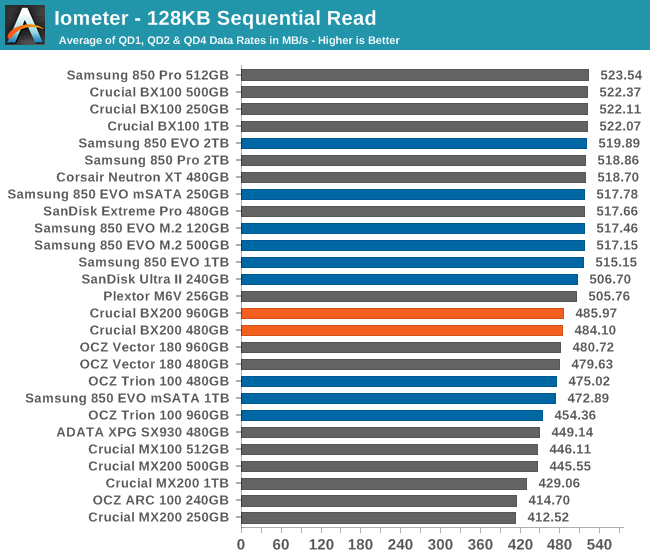
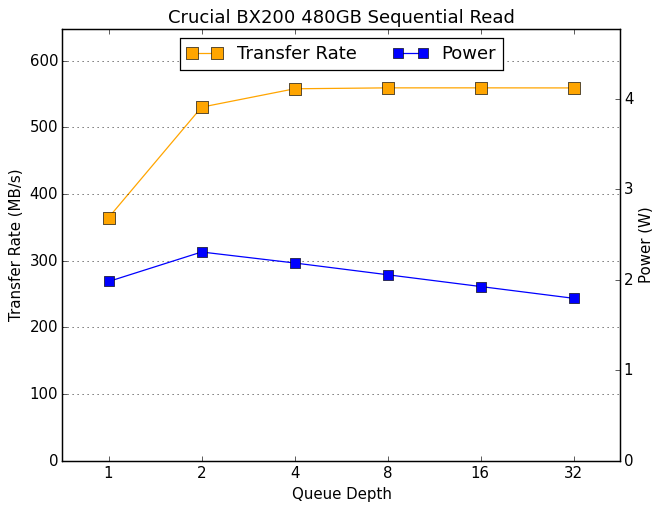
At last we see respectable performance from the BX200. Its sequential read speeds aren'te quite up to the SATA limit at low queue depths, but it can sustain solid performance. Unfortunately, for anyone holding out hope that the poor results we've seen so far may be a testbed issue, the otherwise respectable sequential performance puts that idea to rest.
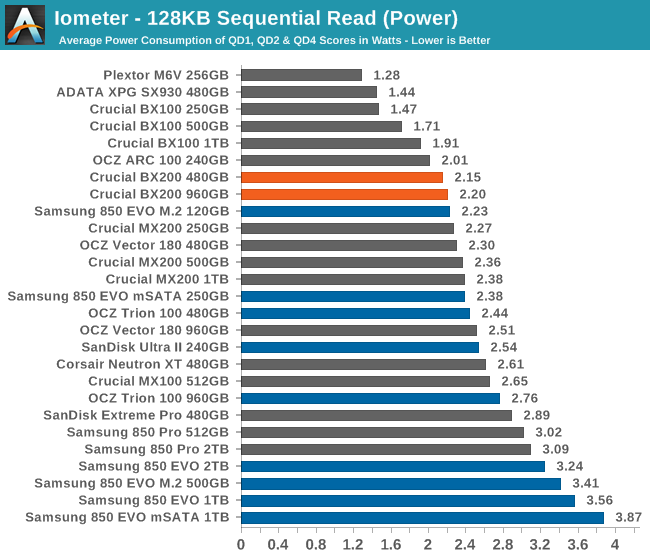
Power consumption on sequential reads is actually good, though it won't catch up with the best of drives.
 | |||||||||
| Default | Crucial BX200 480GBCrucial BX200 960GBCrucial MX100 512GBCorsair Neutron XT 480GBSamsung 850 Pro 512GBSanDisk Extreme Pro 480GBOCZ Vector 180 960GBOCZ Vector 180 480GBSamsung 850 EVO mSATA 1TBSamsung 850 EVO M.2 500GBSanDisk Ultra II 240GBSamsung 850 EVO 1TBCrucial BX100 500GBCrucial BX100 1TBCrucial MX200 1TBCrucial MX200 512GBOCZ Trion 100 960GBOCZ Trion 100 480GBOCZ ARC 100 240GBADATA XPG SX930 480GBSamsung 850 Pro 2TBSamsung 850 EVO 2TBPlextor M6V 256GB | ||||||||
Given a larger queue depth, the BX200 is actually able to reach the performance plateau of the SATA speed limit; it just takes a little longer than the top tier of drives. Given the performance, it's not surprising to see that power consumption doesn't grow much. The shallow but steady decline in power consumption for the 480GB drive may be a sign that it's able to do some prefetching and caching to reduce the number of times it has to read from the flash.
Sequential Write Performance
The sequential write isn't limited to a small span of the disk, as that usually doesn't make a difference for this performance metric. As always, our averages are of the lower queue depths, but scaling to higher queue depths is also investigated. Bulk file copies and recording uncompressed video are the kind of uses that depend on sequential write performance.
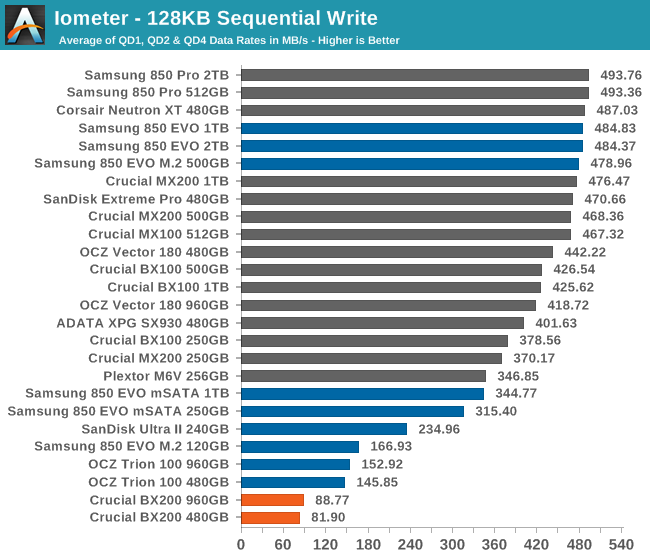
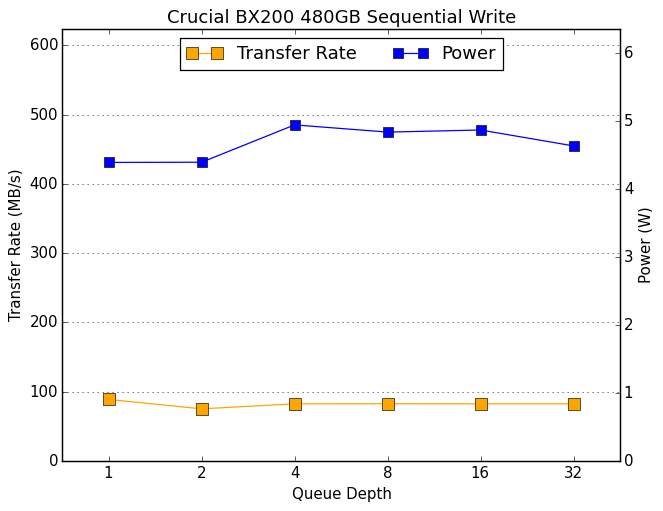
The initial good news we saw with the BX200's sequential read performance didn't last long. The drive's write performance is bad for sequential access just like random access, unfortunately displacing the Trion 100 as one of the worst drives in our current collection.
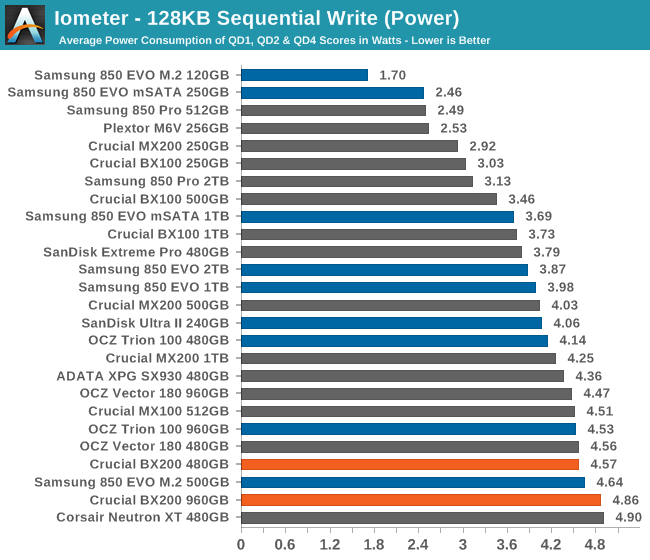
The BX200 power consumption during sequential writing is poor but not radically so. It would seem that Micron's TLC flash requires at most a little more power to write to than other TLC, and this drive is just wasting most of that power budget on background management.
 | |||||||||
| Default | Crucial BX200 480GBCrucial BX200 960GBCrucial MX100 512GBCorsair Neutron XT 480GBSamsung 850 Pro 512GBSanDisk Extreme Pro 480GBOCZ Vector 180 960GBOCZ Vector 180 480GBSamsung 850 EVO mSATA 1TBSamsung 850 EVO M.2 500GBSanDisk Ultra II 240GBSamsung 850 EVO 1TBCrucial BX100 500GBCrucial BX100 1TBCrucial MX200 1TBCrucial MX200 512GBOCZ Trion 100 960GBOCZ Trion 100 480GBOCZ ARC 100 240GBADATA XPG SX930 480GBSamsung 850 Pro 2TBSamsung 850 EVO 2TBPlextor M6V 256GB | ||||||||
Looking at larger queue depths, performance drops slightly after QD1, and stays low as power consumption shifts around some but is always high. Neither capacity of the BX100 can sustain even 100MB/s of writes for a length of time.
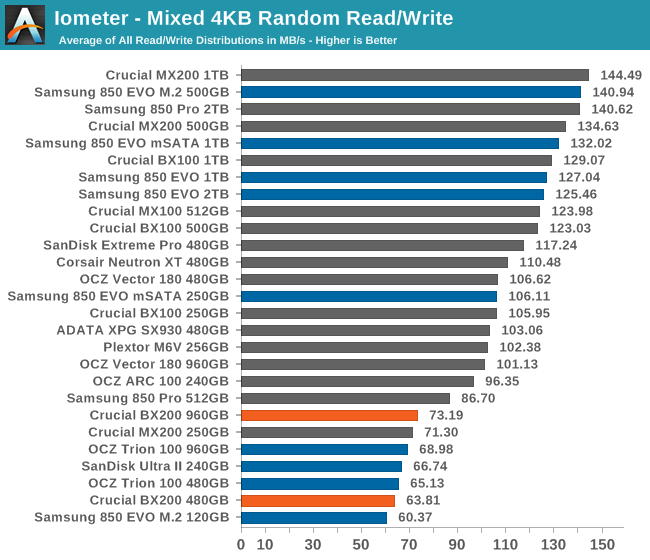
The BX200's reasonable read speeds are apparently able to compensate for the write performance enough to keep at least the 960GB BX200 out of last place for the mixed random test, but the 480GB only manages to surpass a 120GB drive.
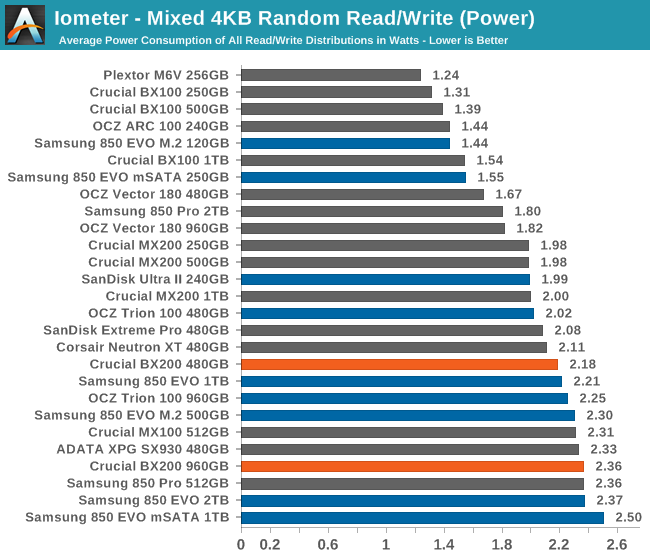
The power draw is even more mainstream than the performance, because despite being inefficient the BX200 isn't unreasonably power hungry in an absolute sense.
 | |||||||||
| Default | Crucial BX200 480GBCrucial BX200 960GBCrucial MX100 512GBCorsair Neutron XT 480GBSamsung 850 Pro 512GBSanDisk Extreme Pro 480GBOCZ Vector 180 960GBOCZ Vector 180 480GBSamsung 850 EVO mSATA 1TBSamsung 850 EVO M.2 500GBSanDisk Ultra II 240GBSamsung 850 EVO 1TBCrucial BX100 500GBCrucial BX100 1TBCrucial MX200 1TBCrucial MX200 512GBOCZ Trion 100 960GBOCZ Trion 100 480GBOCZ ARC 100 240GBADATA XPG SX930 480GBSamsung 850 Pro 2TBSamsung 850 EVO 2TBPlextor M6V 256GB | ||||||||
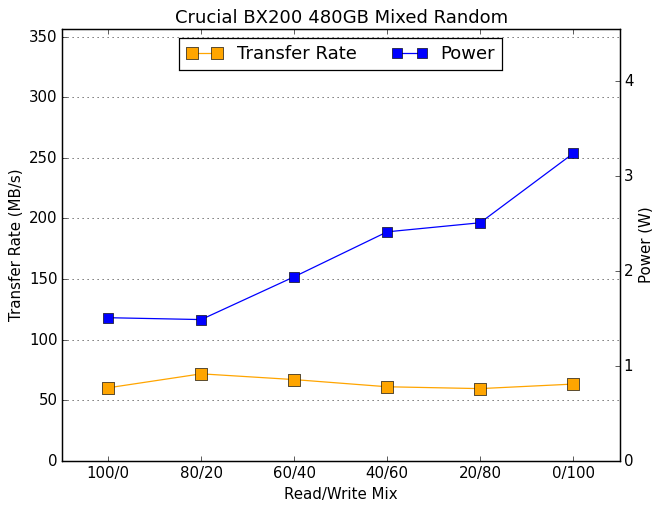
Slow and steady doesn't win the race here. Most drives gain speed near the end of the test for the write-heavy portions, but the BX200 gains no performance as the power consumption climbs. It doesn't have the slight bathtub curve shape in the middle the way the Trion 100 does, which is how it keeps pace even without the boost at the end.
Mixed Sequential Read/Write Performance
At either end of this test, when the workload is heavily skewed toward either reads or writes, most drives perform well. In between, performance typically suffers greatly, and that's where the winners and losers of this test are usually determined. Anything that's duplicating or transforming a large amount of data on the drive will produce I/O patterns similar to this test. Creating a System Restore snapshot, backing up files to a different location on the same drive, and file compression can all produce interleaved reads and writes of large blocks of data, though not necessarily fast enough to be limited by the drive's performance. Heavy multitasking can add up to a mixed workload.
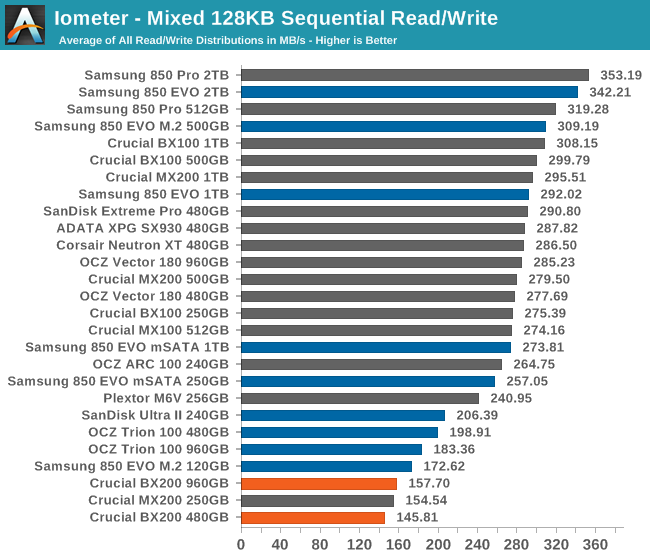
With average read speeds and poor write speeds, the BX200 is in last place for the overall average, since the competition didn't have any acute weaknesses.
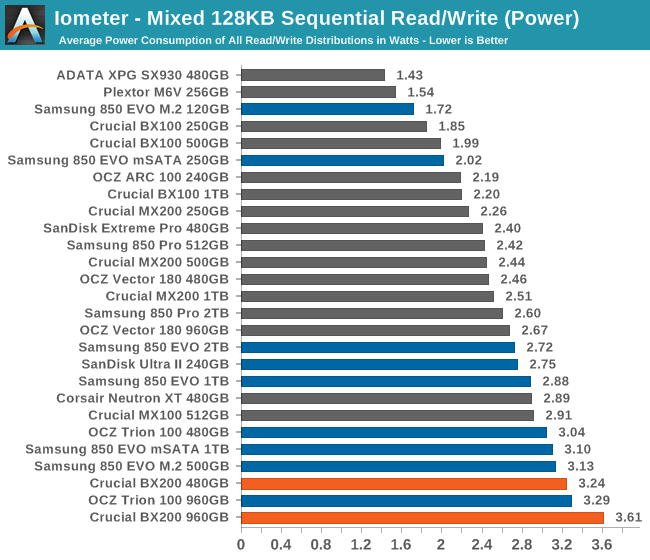
Average power consumption is once again high, and the 960GB is a particular outlier.
 | |||||||||
| Default | Crucial BX200 480GBCrucial BX200 960GBCrucial MX100 512GBCorsair Neutron XT 480GBSamsung 850 Pro 512GBSanDisk Extreme Pro 480GBOCZ Vector 180 960GBOCZ Vector 180 480GBSamsung 850 EVO mSATA 1TBSamsung 850 EVO M.2 500GBSanDisk Ultra II 240GBSamsung 850 EVO 1TBCrucial BX100 500GBCrucial BX100 1TBCrucial MX200 1TBCrucial MX200 512GBOCZ Trion 100 960GBOCZ Trion 100 480GBOCZ ARC 100 240GBADATA XPG SX930 480GBSamsung 850 Pro 2TBSamsung 850 EVO 2TBPlextor M6V 256GB | ||||||||
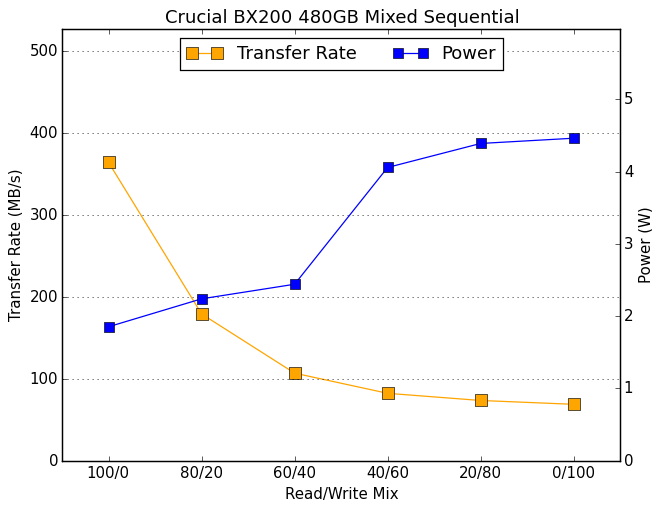
The graph of performance as more writes come into the mix shows just how quickly things get bad. There's a big jump in power consumption once writes are more common than reads, and the drive is almost as overwhelmed at 40/60 as it is for the pure writes.
로우엔드 TLC 모델답게 성능은 비교 모델간 하위권. 전력 효율도 낮은편.