


<br>")


![삼성, 잃어버린 10년 [풀영상] | 창 458회 (KBS 24.03.12) by 인공지능](https://raptor-hw.net/xe/files/thumbnails/453/204/271x205.crop.jpg "삼성, 잃어버린 10년 [풀영상] | 창 458회 (KBS 24.03.12)<br>")
, 전세계 일자리 파괴 가속화 “육체노동만 살아남나?”<br>")


’ 오픈<br>")


 다운로드 및 설치<br>")

 ' alt='위대한 인류최대 수퍼로켓 '스타십(Spacex Starship)' 발사 성공 by 인공지능' />
<br>")


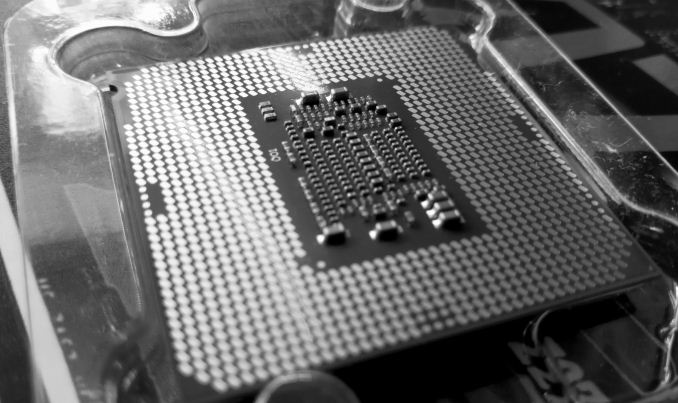
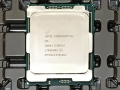
인텔의 신형 7세대 카비레이크 7700K 리뷰 - http://www.anandtech.com
| Intel Kaby Lake S SKUs | |||||||
| Cores/ Threads | Base/ Turbo | IGP | L3 | eDRAM | TDP | Cost | |
| i7-7700K | 4/8 | 4.2/4.5 | HD 630 | 8 MB | - | 91 W | $305 |
| i7-7700 | 4/8 | 3.6/4.2 | HD 630 | 8 MB | - | 65 W | $272 |
| i7-7700T | 4/8 | 2.9/3.8 | HD 630 | 8 MB | - | 35 W | $272 |
| i5-7600K | 4/4 | 3.8/4.2 | HD 630 | 6 MB | - | 91 W | $217 |
| i5-7600 | 4/4 | 3.5/4.1 | HD 630 | 6 MB | - | 65 W | $199 |
| i5-7600T | 4/4 | 2.8/3.7 | HD 630 | 6 MB | - | 35 W | $199 |
| i5-7500 | 4/4 | 3.4/3.8 | HD 630 | 6 MB | - | 65 W | $179 |
| i5-7500T | 4/4 | 2.7/3.3 | HD 630 | 6 MB | - | 35 W | $179 |
| i5-7400 | 4/4 | 3.0/3.5 | HD 630 | 6 MB | - | 65 W | $170 |
| i5-7400T | 4/4 | 2.4/3.0 | HD 630 | 6 MB | - | 35 W | $170 |
| i3-7350K | 2/4 | 4.2 | HD 630 | 4 MB | - | 60 W | $157 |
| i3-7320 | 2/4 | 4.1 | HD 630 | 4 MB | - | 51 W | $139 |
| i3-7300 | 2/4 | 4.0 | HD 630 | 4 MB | - | 51 W | $129 |
| i3-7300T | 2/4 | 3.5 | HD 630 | 4 MB | - | 35 W | $129 |
| i3-7100 | 2/4 | 3.9 | HD 630 | 3 MB | - | 51 W | $109 |
| i3-7100T | 2/4 | 3.4 | HD 630 | 3 MB | - | 35 W | $109 |
카비레이크 라인업 및 스펙표
CORE i7 - 4코어 8스레드(하이퍼스레딩), L3 8MB, 내장그래픽 HD 630 공통
CORE i5 - 4코어 4스레드, L3 6MB, 내장그래픽 HD 630 공통
CORE i3 - 2코어 4스레드(하이퍼스레딩), L3 4MB, 내장그래픽 HD 630 공통
각각의 모델은 베이스 - 부스트 클럭 차이, 배수락 해제 여부, 저전력 모델 차이
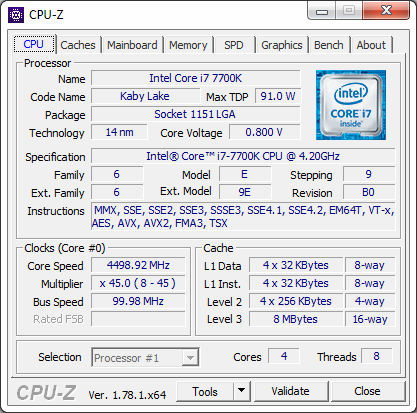
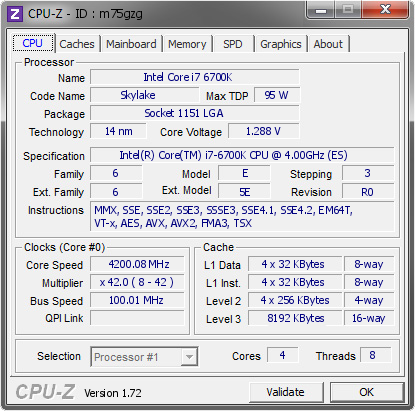
구형 스카이레이크 6700K와 카비레이크 7700K 스펙 비교
TDP, 코어 전압, 동작 클럭 차이 확인

신형 카비레이크 특징 - 인텔 3D XPoint 기술의 옵테인 메모리 지원
- 테스트 시스템
| Test Setup | |
| Processor | Intel Core i7-7700K (Retail Stepping), 91W, $303 4 Cores, 8 Threads, 4.2 GHz (4.5 GHz Turbo) |
| Motherboards | ASRock Z270 Extreme4 MSI Z270 Gaming M7 |
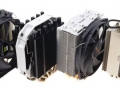
| Cooling | Cooler Master Nepton 140XL |
| Power Supply | OCZ 1250W Gold ZX Series Corsair AX1200i Platinum PSU |
| Memory | Corsair DDR4-2400 C15 2x8 GB 1.2V or G.Skill Ripjaws 4 DDR4-2400 C15 2x8 GB 1.2V |
| Memory Settings | JEDEC @ 2400 |
| Video Cards | ASUS GTX 980 Strix 4GB MSI R9 290X Gaming 8GB MSI GTX 770 Lightning 2GB (1150/1202 Boost) MSI R9 285 Gaming 2G ASUS R7 240 2GB |
| Hard Drive | Crucial MX200 1TB |
| Optical Drive | LG GH22NS50 |
| Case | Open Test Bed |
| Operating System | Windows 7 64-bit SP1 |
Dolphin Benchmark: link
Many emulators are often bound by single thread CPU performance, and general reports tended to suggest that Haswell provided a significant boost to emulator performance. This benchmark runs a Wii program that raytraces a complex 3D scene inside the Dolphin Wii emulator. Performance on this benchmark is a good proxy of the speed of Dolphin CPU emulation, which is an intensive single core task using most aspects of a CPU. Results are given in minutes, where the Wii itself scores 17.53 minutes.
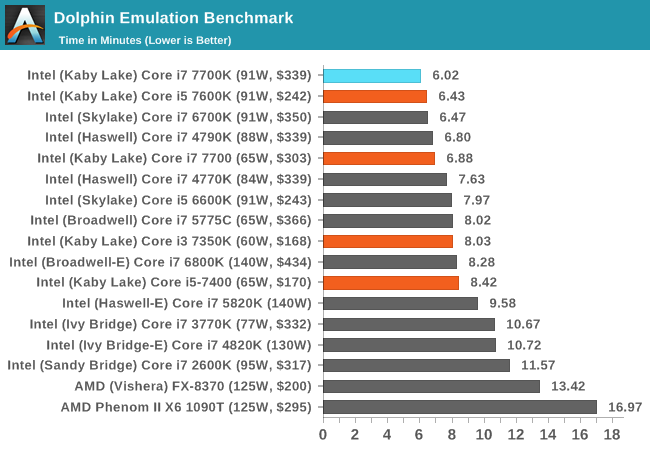
As shown by the data, the i7-7700K takes the top spot. At stock it edges out an overclocked Core i7-4790K at 4.7 GHz, which is no mean feat. Dolphin is all about high frequency and IPC, which the i7-7700K has the best of both.
WinRAR 5.0.1: link
Our WinRAR test from 2013 is updated to the latest version of WinRAR at the start of 2014. We compress a set of 2867 files across 320 folders totaling 1.52 GB in size – 95% of these files are small typical website files, and the rest (90% of the size) are small 30 second 720p videos.
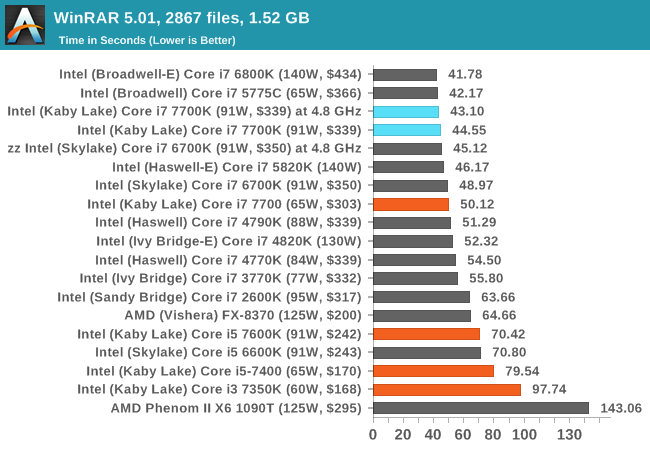
WinRAR is more geared towards a variable threaded environment but also memory speed. While two channels of DDR4-2400 does well for the Core i7-7700K, to the point where it beats the 6-core i7-5930K, anything with eDRAM (i7-5775C) and the higher end quad channel processors with up to 10 cores do win out. But at $1700 for 10-core, the Kaby Lake CPU does well – the only processor that beats it in its price range is that eDRAM-based i7 part.
3D Particle Movement v2
3DPM is a self-penned benchmark, taking basic 3D movement algorithms used in Brownian Motion simulations and testing them for speed. High floating point performance, MHz and IPC wins the day. This is the second variant of this benchmark, fixing for false sharing in the first version, and lending itself to better multithreaded performance.
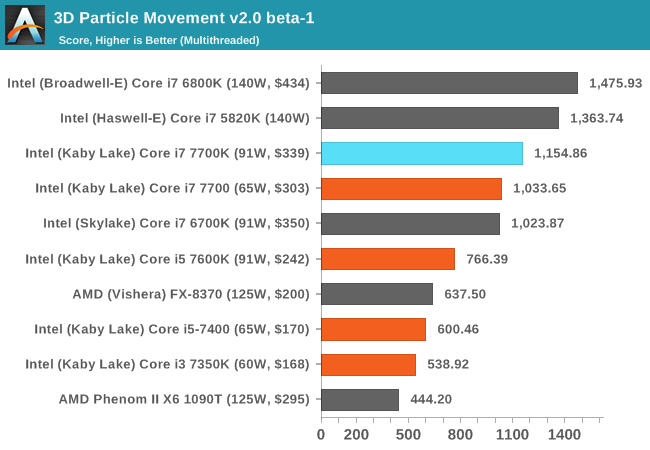
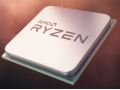
3DPMv2 is still new, so we don’t have too many results for it so far, but it hits the top of the mainstream processor stack as was perhaps to be expected. It scores almost double an FX-8370, showing how far Intel’s mainstream has come from AMD’s old CPUs, but the Core i7-7700K matches up to just over double the Core i3-7350K, as it has double the cores/threads and slightly more frequency.
SYSMark 2014
Engineered by BAPco (to which Intel is a consortium member), this set of tests are designed to be an office/data/media/financial range of tests using common well-known CAD, image editing, web browsing and other tools to put out a score, where a score of 1000 is attributed to an old Core i3 using a mechanical harddrive. Here we report the overall score, however the test breakdowns can be found in Bench.
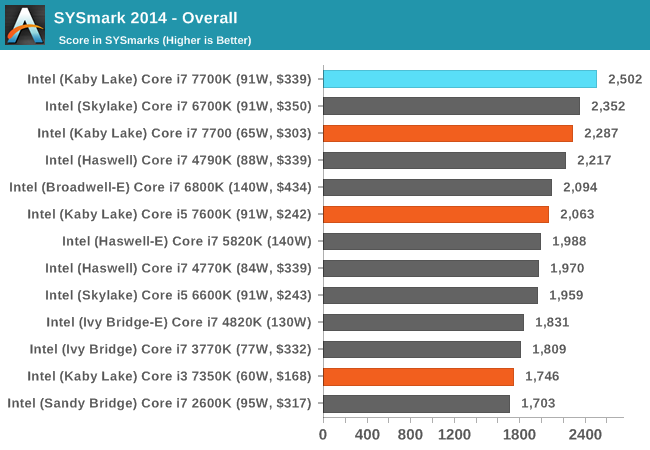
Because SYSMark is a variety of tests that rely on response and throughput, the Core i7-7700K hits the mix just right and scores higher than even a 10-core Core i7 Extreme part launched last year, as well as a highly overclocked Devil’s Canyon. Aside from the Core i5, the 7700K does well in price/performance here.
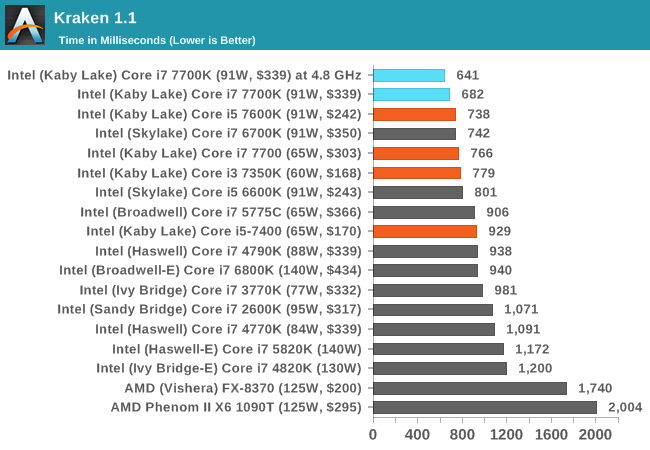
Web Benchmarks
On the lower end processors, general usability is a big factor of experience, especially as we move into the HTML5 era of web browsing. For our web benchmarks, we take well known tests with Chrome as installed by SYSMark as a consistent browser.
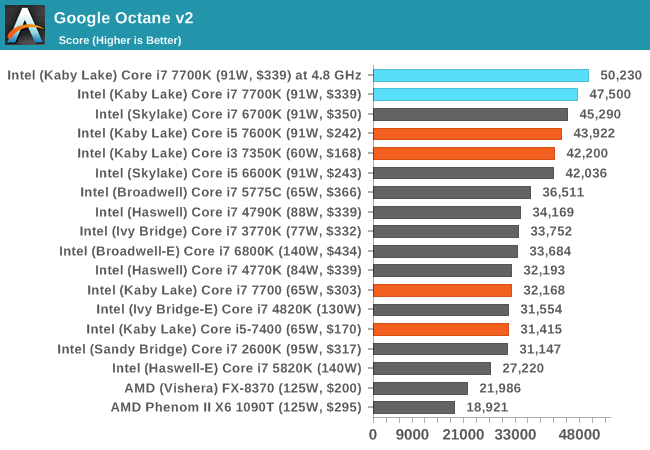
Mozilla Kraken 1.1
Google Octane v2
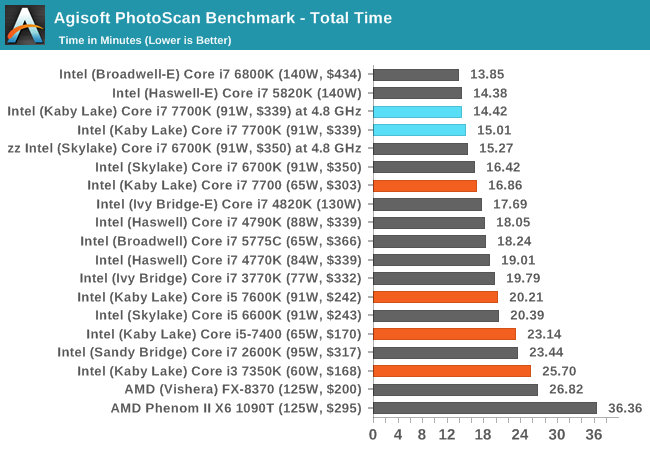
Here’s another instance where a stock Core i7-7700K can overcome an overclocked Devil’s Canyon. Agisoft spends a good time of its workload using cache heavy threads, showing that large core parts do really well, however the i7-7700K is on par with the six-core Core i7-3960X, showing that extra IPC and frequency can make up for a core or two.
Cinebench R15
Cinebench is a benchmark based around Cinema 4D, and is fairly well known among enthusiasts for stressing the CPU for a provided workload. Results are given as a score, where higher is better.
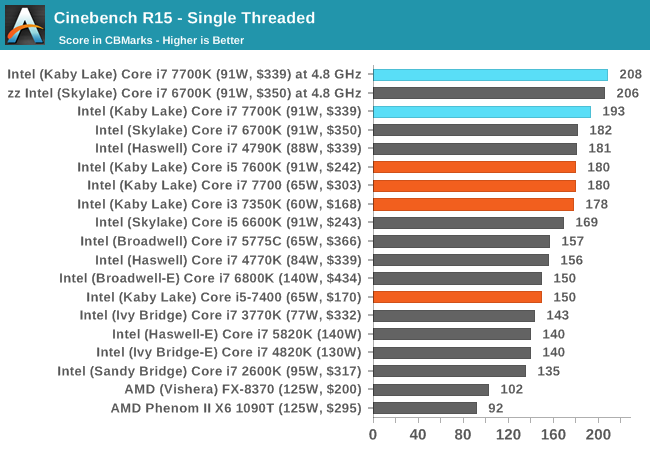
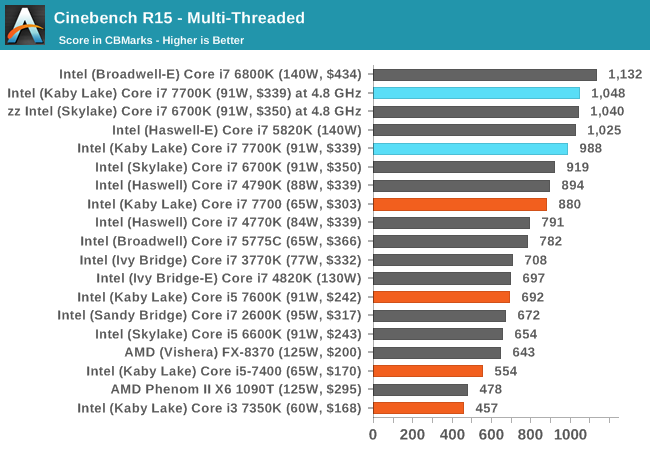
While Cinebench R15 is more a synthetic, it remains a popular test to measure professional performance and is free to use. For single threaded performance, the Core i7-7700K hits the top of the pile. With the Skylake and Kaby Lake parts both at 4.8 GHz, there’s almost nothing between them, showing the identical IPC. In multithreaded mode the 7700K is on top of all the mainstream processors as expected, and when overclocked can mix it up with some of the extreme processors as well.
HandBrake v0.9.9: link
For HandBrake, we take two videos (a 2h20 640x266 DVD rip and a 10min double UHD 3840x4320 animation short) and convert them to x264 format in an MP4 container. Results are given in terms of the frames per second processed, and HandBrake uses as many threads as possible.
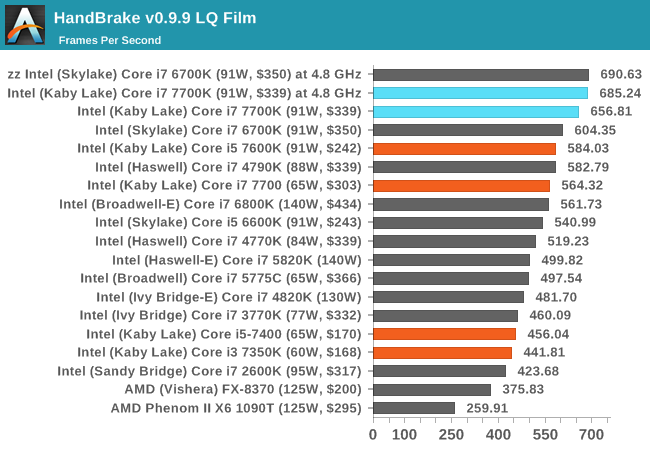
The LQ video emphasizes IPC due to its low cache overhead, meaning that the i7-7700K wins again, and when overclocked, performs the same as the 6700K at the same frequency.
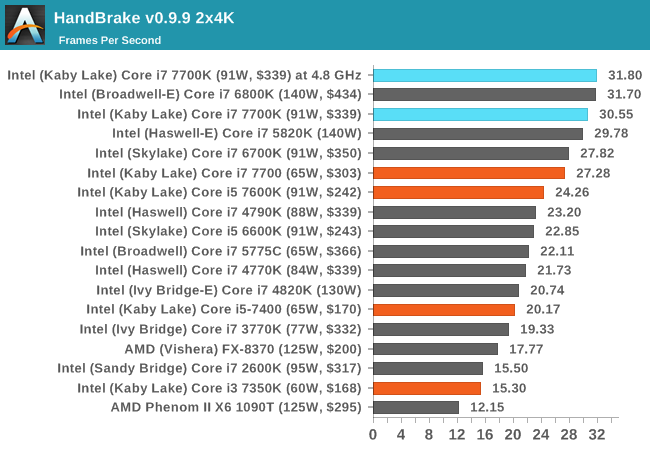
The higher resolution video however means that cores with frequency dominate. The i7-7700K stands above processors such as the i7-5820K, the i7-4930K and the i7-3960X, which is no small feat. But if you really want performance here, the big boys are still top performers (if you can afford them).
Hybrid x265
Hybrid is a new benchmark, where we take a 4K 1500 frame video and convert it into an x265 format without audio. Results are given in frames per second.
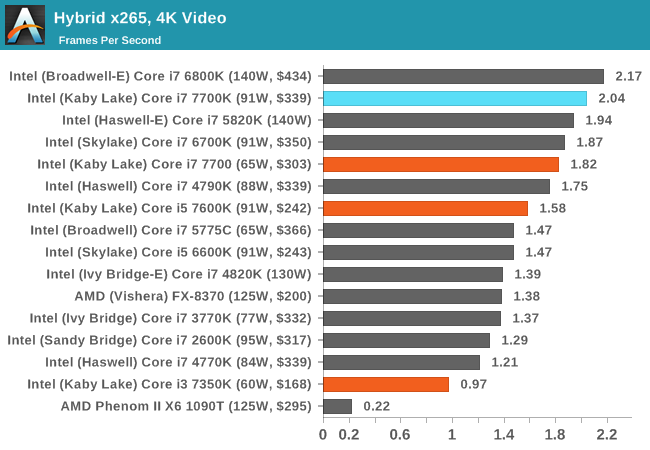
Our Hybrid test is somewhat similar to the HandBrake HQ test, showing the i7-7700K sitting tall as the mainstream champion.
Legacy Tests
At AnandTech, I’ve taken somewhat of a dim view to pure synthetic tests, as they fail to be relatable. Nonetheless, our benchmark database spans to a time when that is all we had! We take a few of these tests for a pin with the latest hardware.
Cinebench R10
The R10 version of Cinebench is one of our oldest benchmarks, with data going back more than a few generations. The benchmark is similar to that of the newest R15 version, albeit with a simpler render target and a different strategy for multithreading.
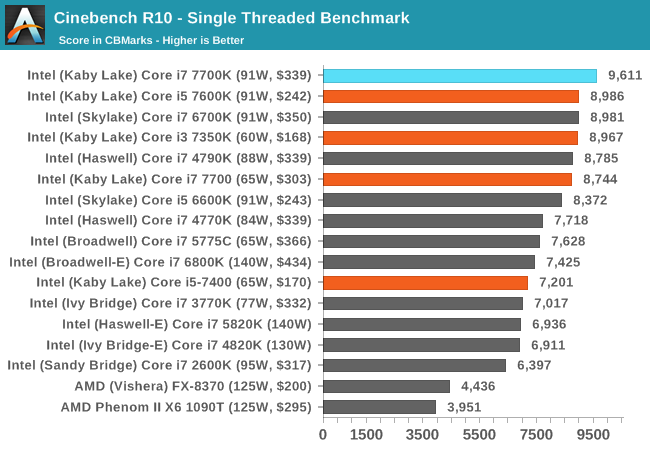
For a few years I was under the impression that CineBench’s workload was not amenable to more IPC increases, as we hovered around 7000 pts with new microarchitectures not making much of a difference. Being high frequency the i7-7700K pulls out a lead here, but it’s worth noting that Kaby Lake as a whole scores well, perhaps indicating that other features (such as frequency speed changing) can help.
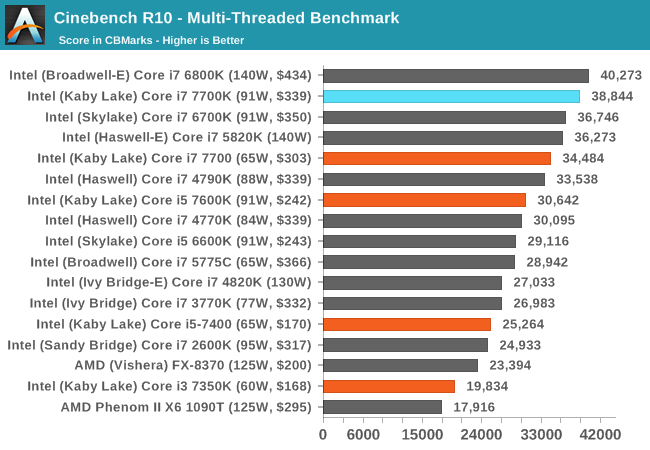
The multithreaded test gives different results, as this test typically prefers many cores. Rather than the new Cinebench tests dividing the scene up into over a hundred pieces (depends on threads), CB10 purely divides the scene into exactly how many threads are present. If a thread finishes early, it will try and cut the work of another thread in half. This sort of approach to multithreading has a different approach to frequency, cores and IPC, hence why R11.5 and R15 do bigger separations with core workloads.
Cinebench R11.5
CB11.5 has been popular for many years as a performance test, using easy to read and compare numbers that aren’t in the 1000s. We run the benchmark in an automated fashion three times in single-thread and multi-thread mode and take the average of the results.
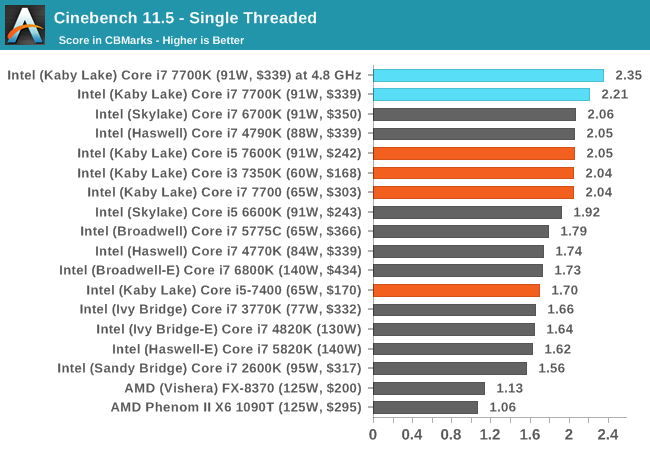
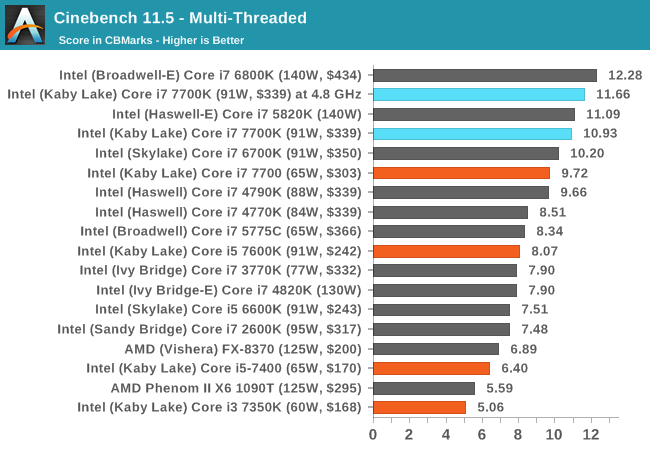
Similar to other tests, the i7-7700K takes the single thread crown, again beating an overclocked Devil’s Canyon i7-4790K, showing the out-of-the-box performance. Again, Kaby Lake as a whole seems to do well here, thanks to 4.2 GHz turbo modes on the i5-7600K and i3-7350K.
7-zip
As an open source compression/decompression tool, 7-zip is easy to test and features a built-in benchmark to measure performance. As a utility, similar to WinRAR, high thread counts, frequency and UPC typically win the day here.
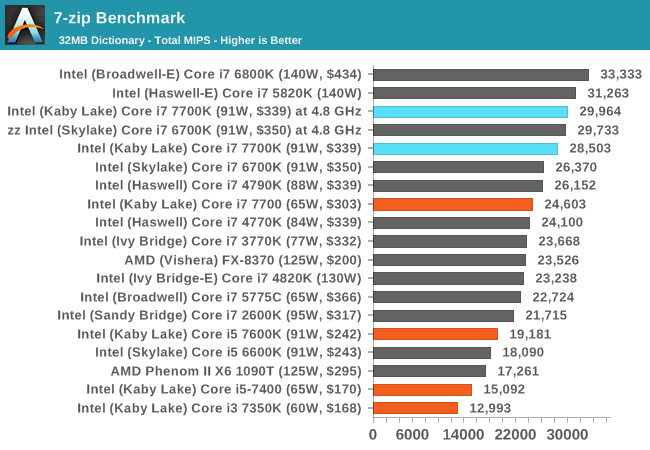
The Core i7-7700K shows the benefits of frequency over a stock i7-6700K, however at the same frequency they perform roughly the same as expected.
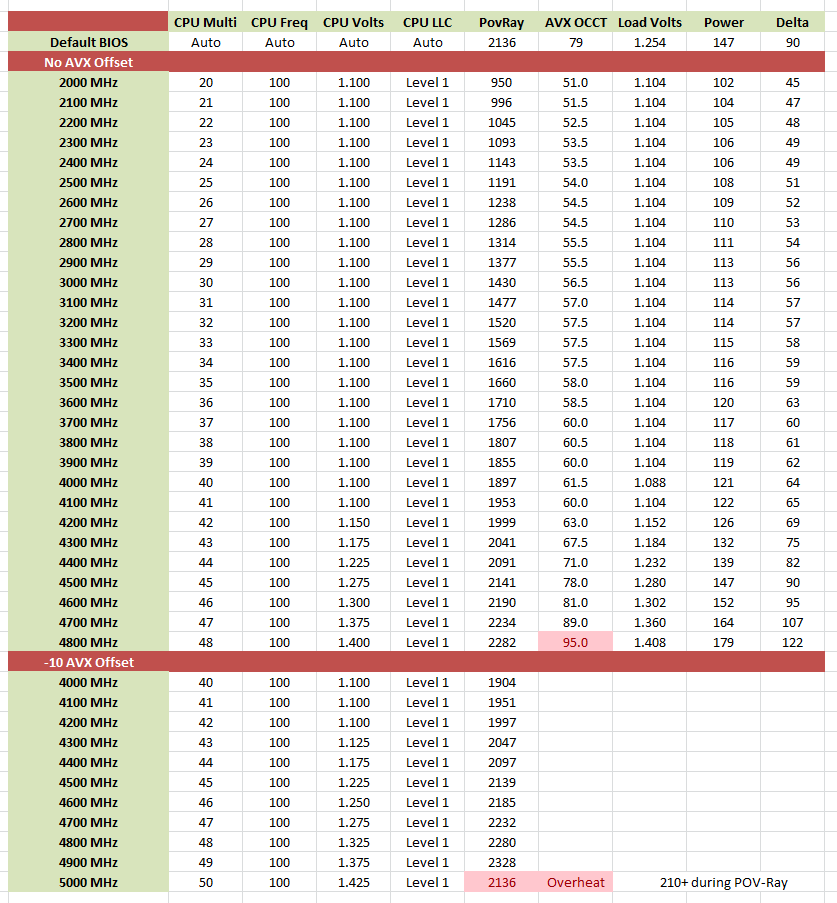
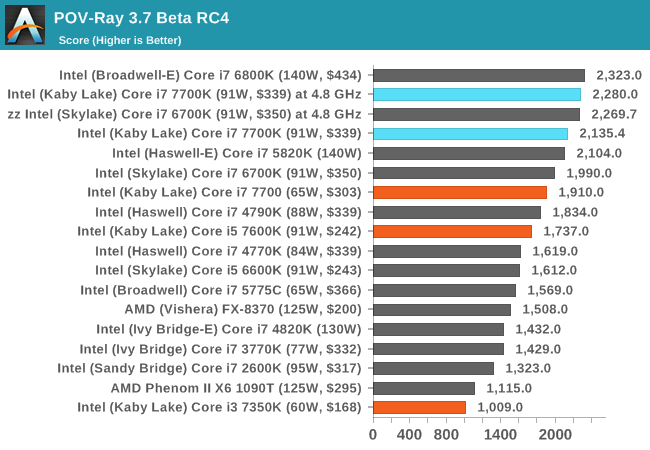
POV-Ray
Ray-tracing is a typical multithreaded test, with each ray being a potential thread in its own right ensuring that a workload can scale in complexity easily. This lends itself to cores, frequency and IPC: the more, the better.
AES via TrueCrypt
Despite TrueCrypt no longer being maintained, the final version incorporates a good test to measure different encryption methodologies as well as encryption combinations. When TrueCrypt was in full swing, the introduction of AES accelerated hardware dialed the performance up a notch, however most of the processors (save the Pentiums/Celerons) now support this and get good speed. The built-in TrueCrypt test does a mass encryption on in-memory data, giving results in GB/s.
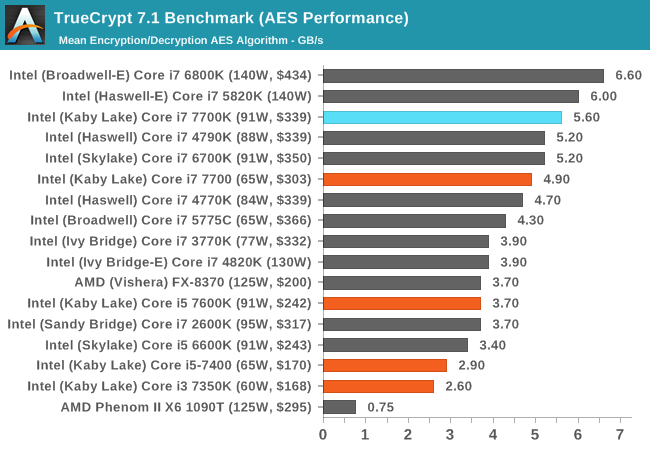
The encryption benchmark loves both threads and memory bandwidth, so we see the extreme processors pull out large leads due to 6+ cores and four memory channels. However, we see a similar picture as before to the Devil’s Canyon part: an out-of-the-box Core i7-7700K will beat an overclocked Core i7-4790K at 4.7 GHz.
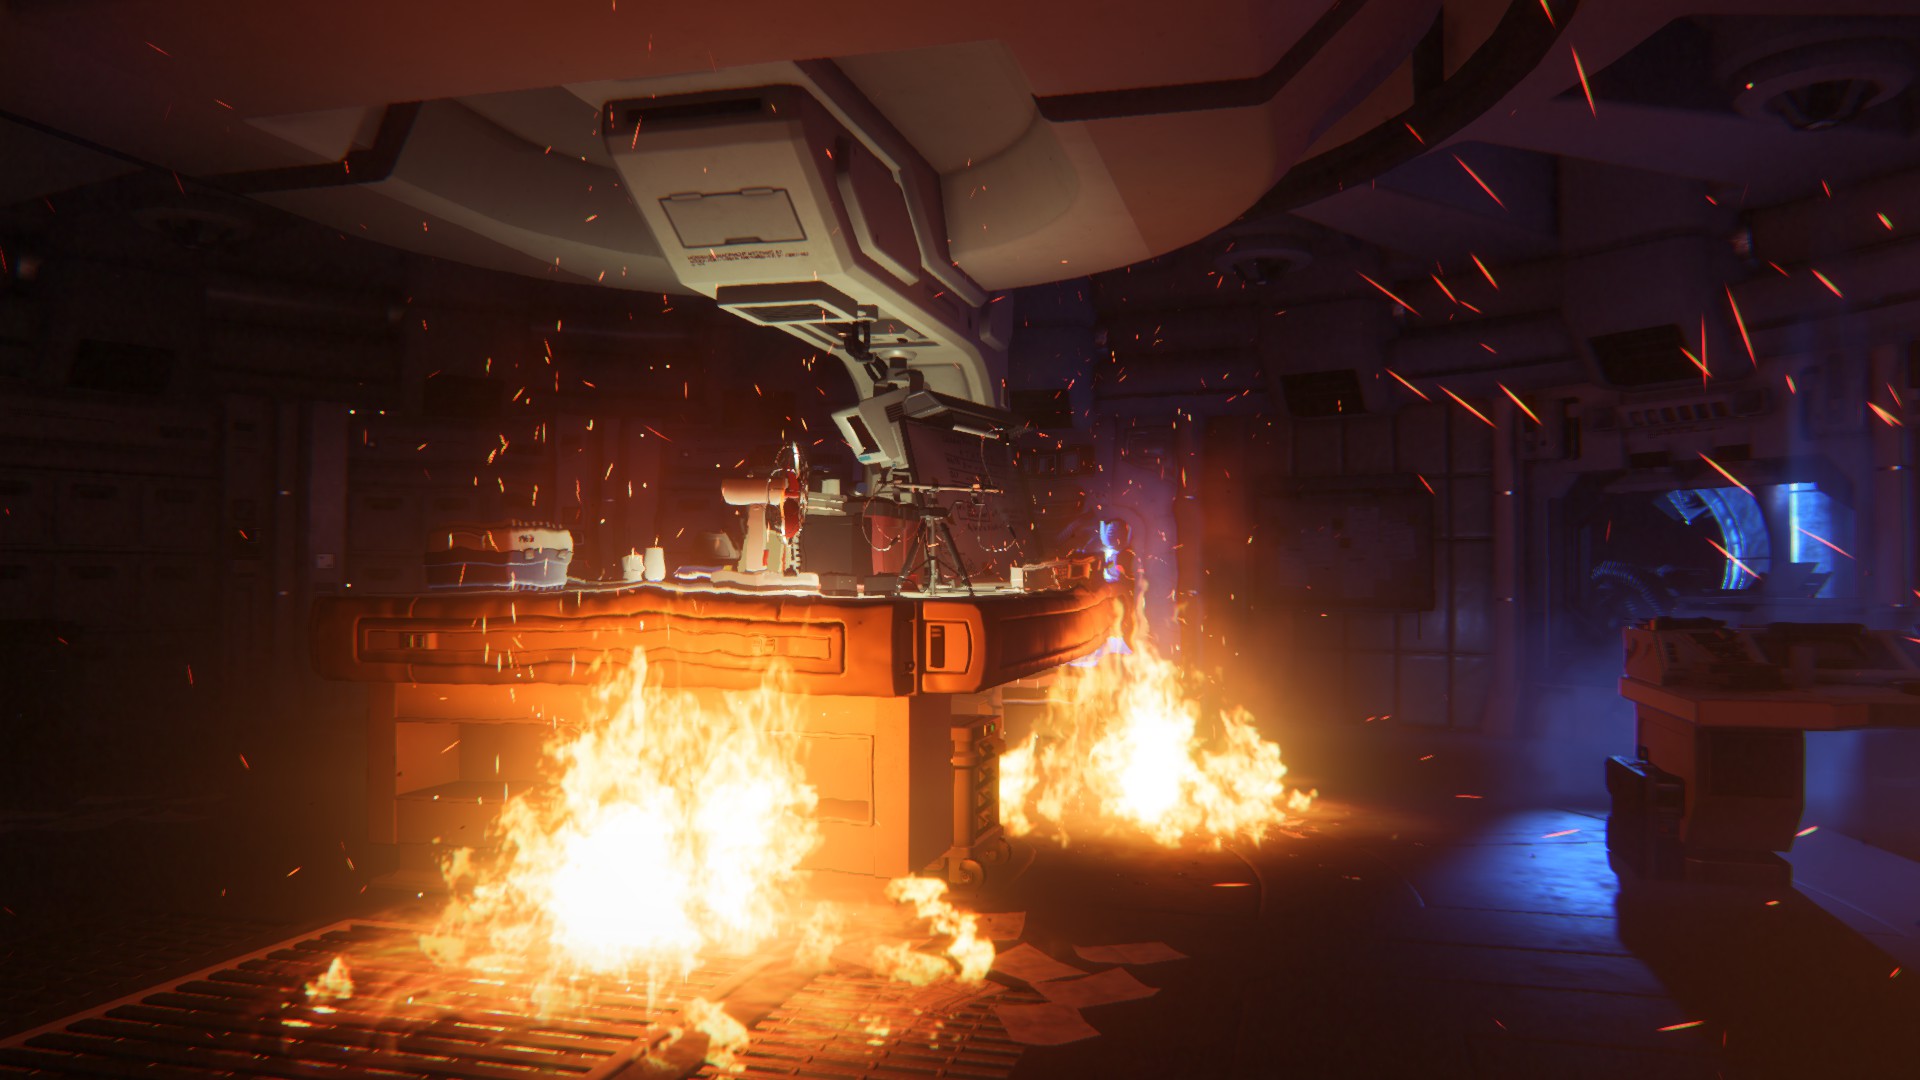
Alien: Isolation
If first person survival mixed with horror is your sort of thing, then Alien: Isolation, based off of the Alien franchise, should be an interesting title. Developed by The Creative Assembly and released in October 2014, Alien: Isolation has won numerous awards from Game Of The Year to several top 10s/25s and Best Horror titles, ratcheting up over a million sales by February 2015. Alien: Isolation uses a custom built engine which includes dynamic sound effects and should be fully multi-core enabled.
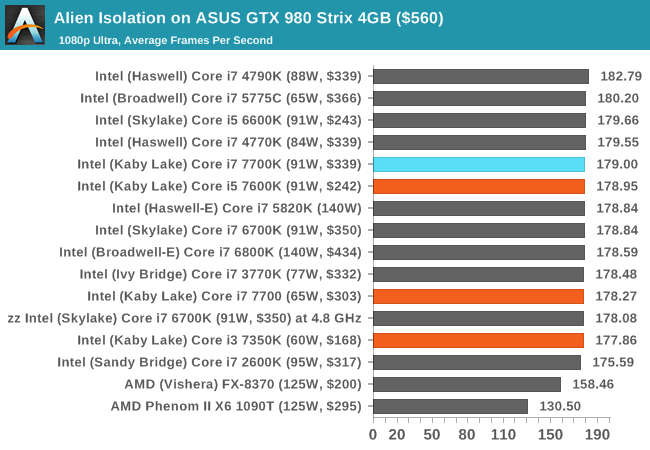
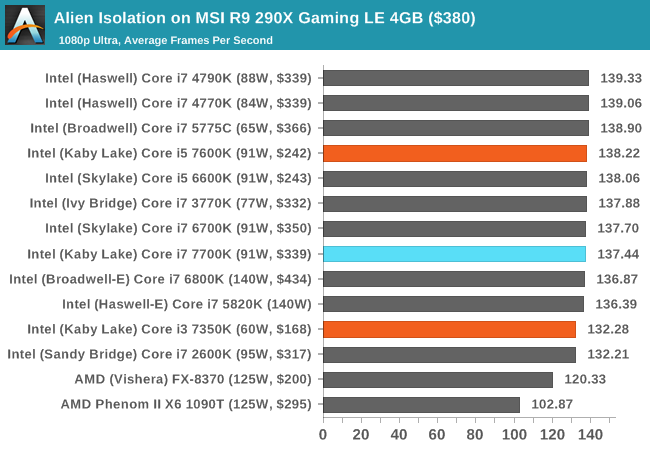
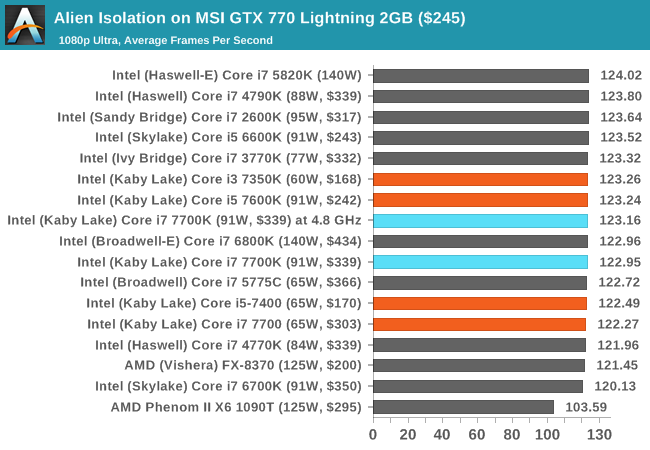
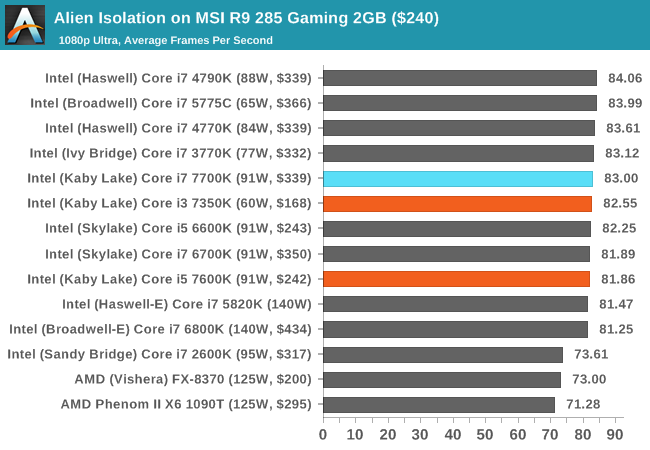
In al of our testing, aside from a couple of scores falling at the bottom depending on the CPU/GPU combo, all the CPUs perform similarly.
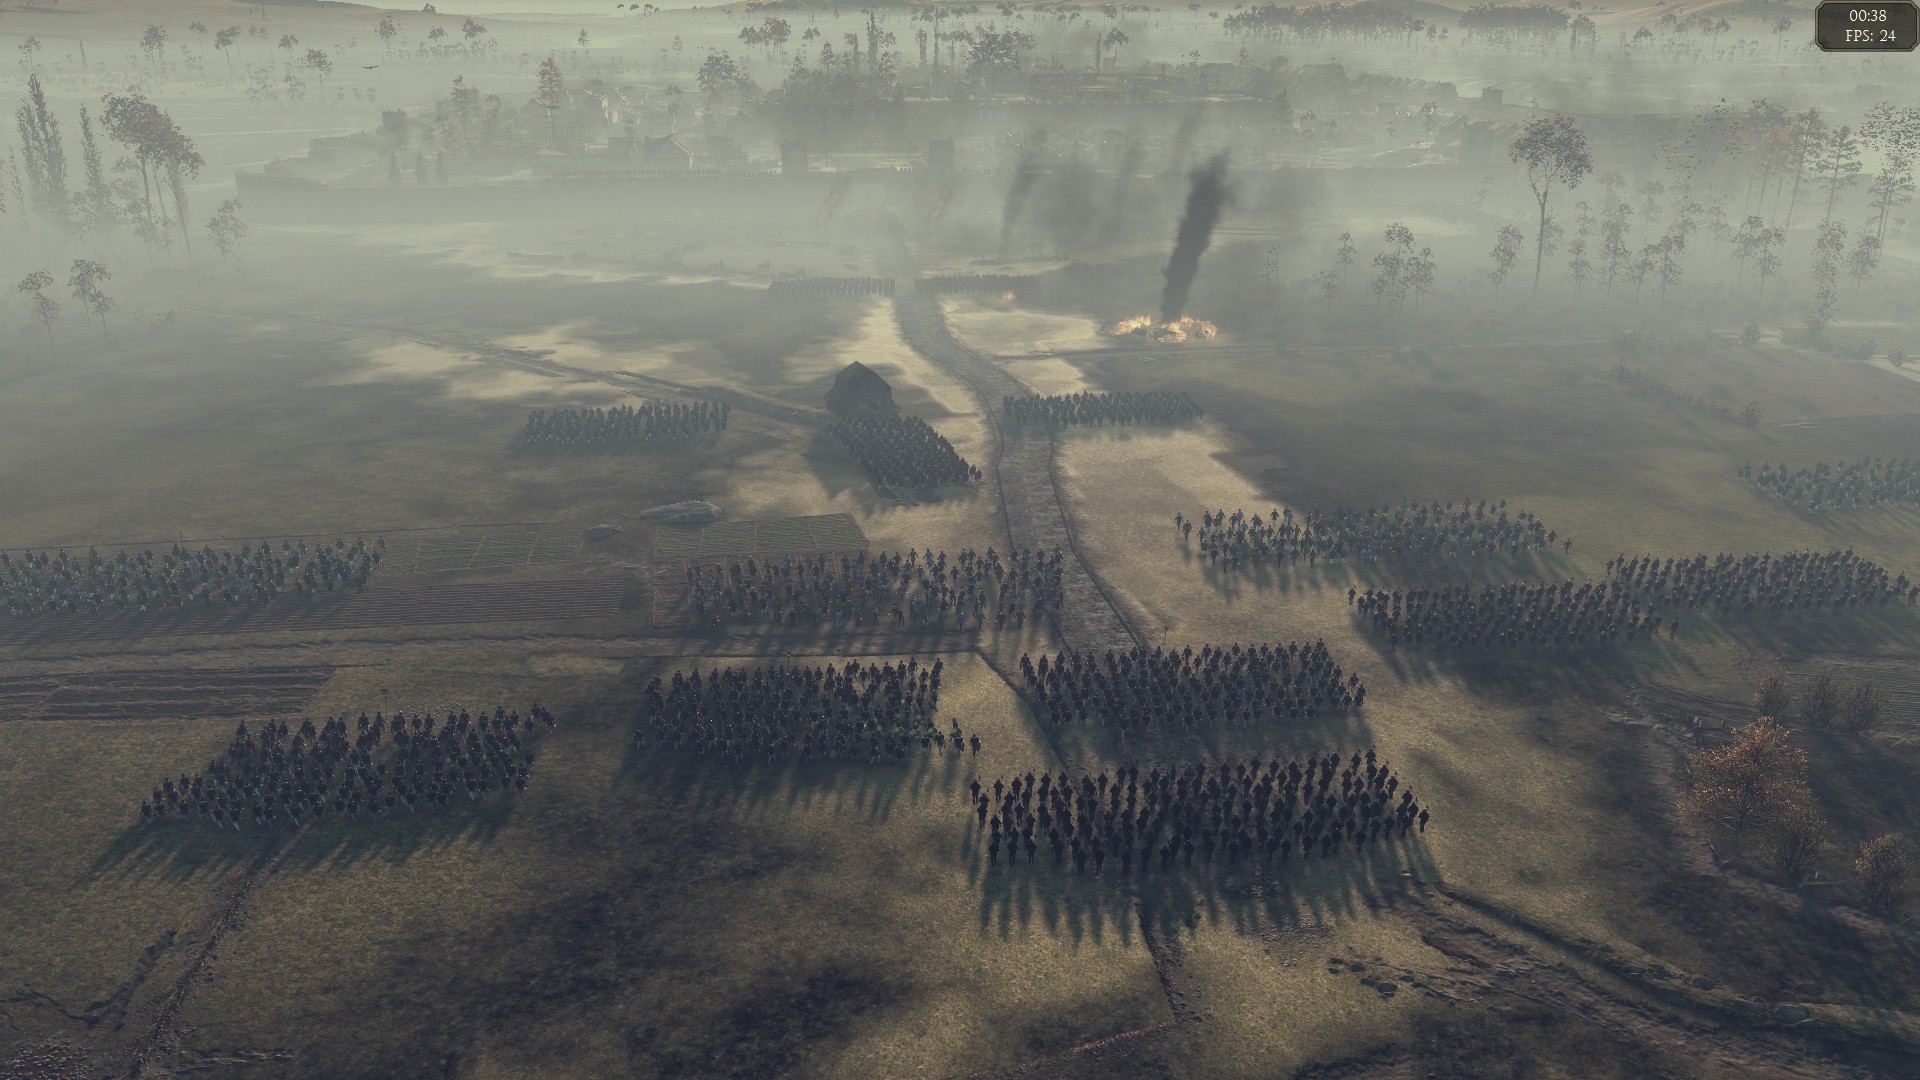
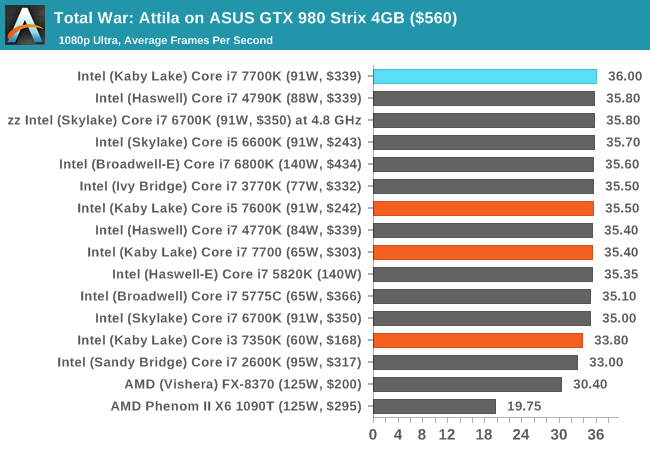
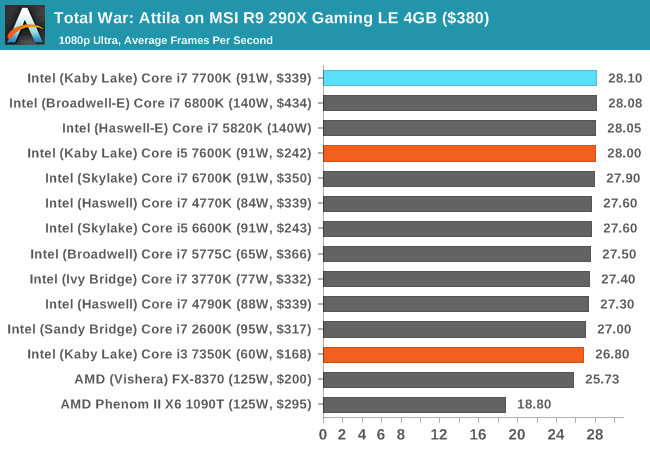
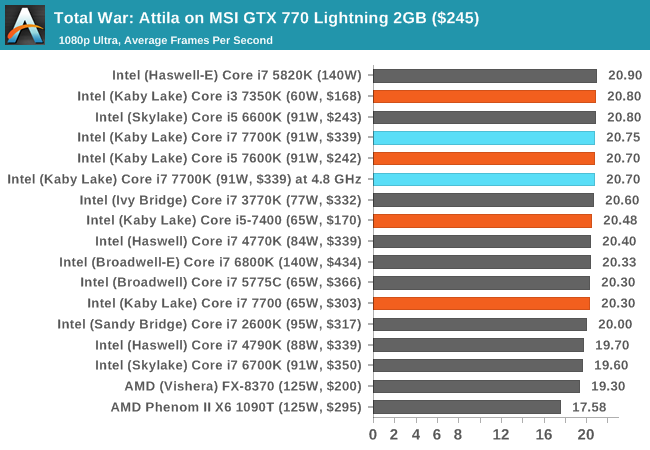
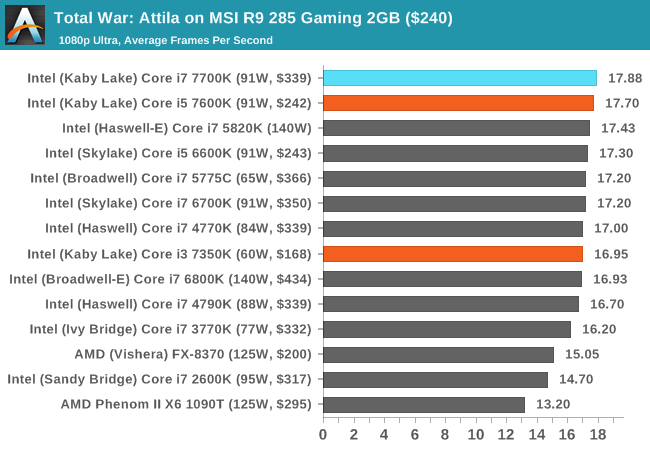
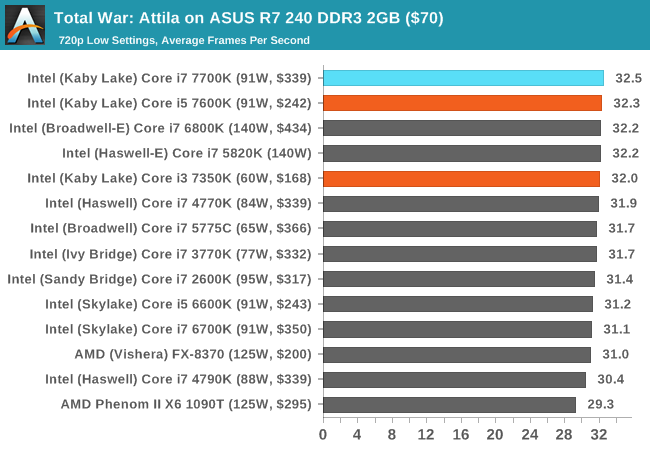
Total War: Attila
The Total War franchise moves on to Attila, another The Creative Assembly development, and is a stand-alone strategy title set in 395AD where the main story line lets the gamer take control of the leader of the Huns in order to conquer parts of the world. Graphically the game can render hundreds/thousands of units on screen at once, all with their individual actions and can put some of the big cards to task.
For low end graphics, we test at 720p with performance settings, recording the average frame rate. With mid and high range graphics, we test at 1080p with the quality setting. In both circumstances, unlimited video memory is enabled and the in-game scripted benchmark is used.
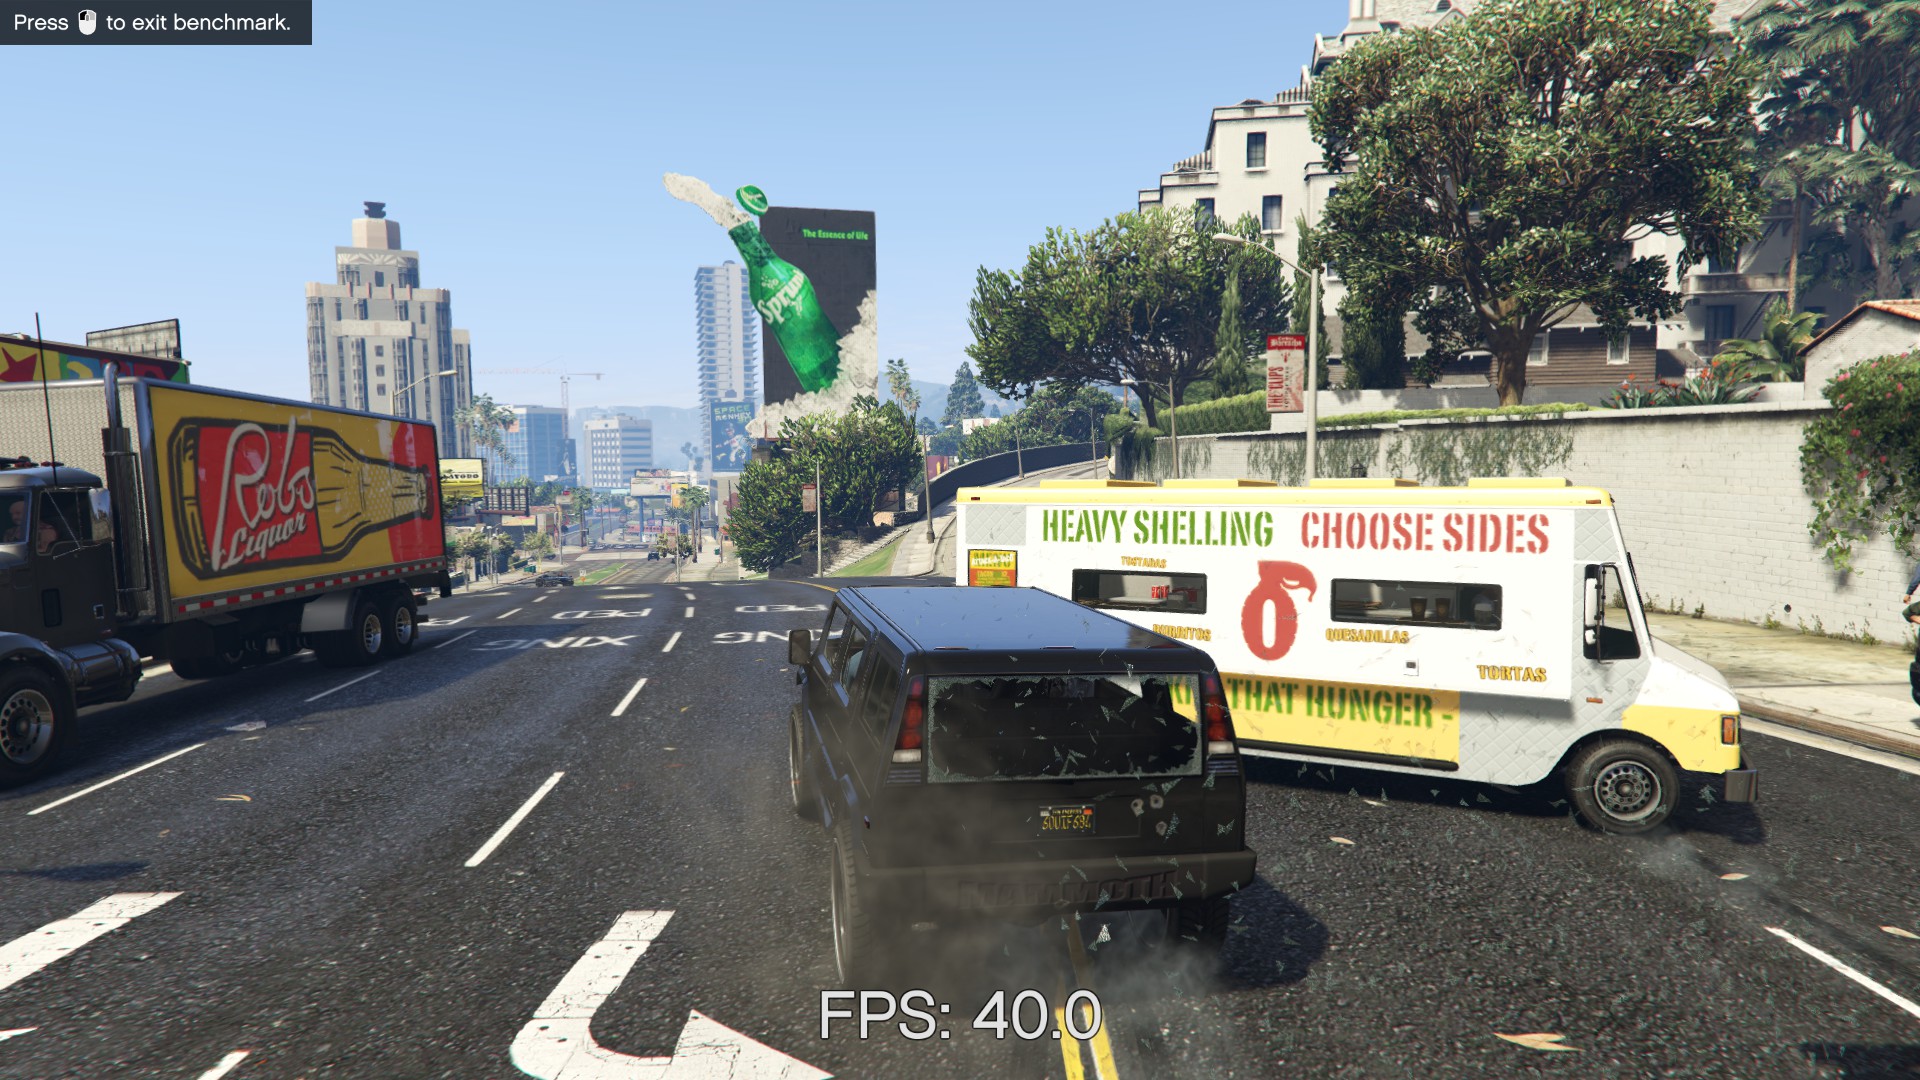
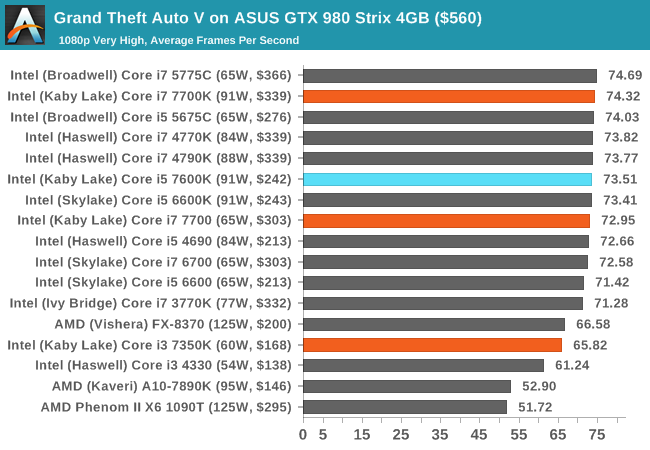
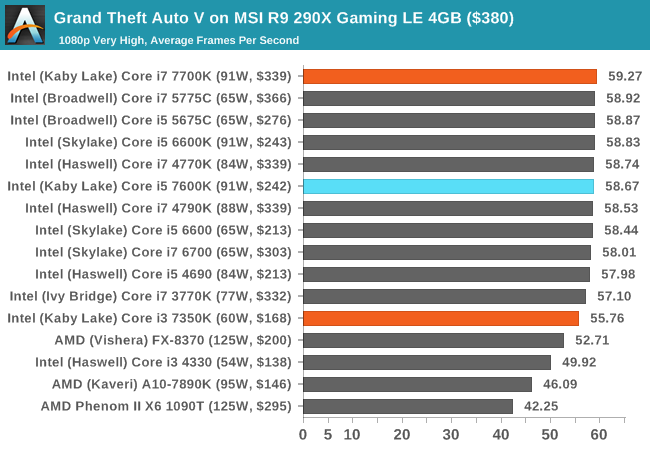
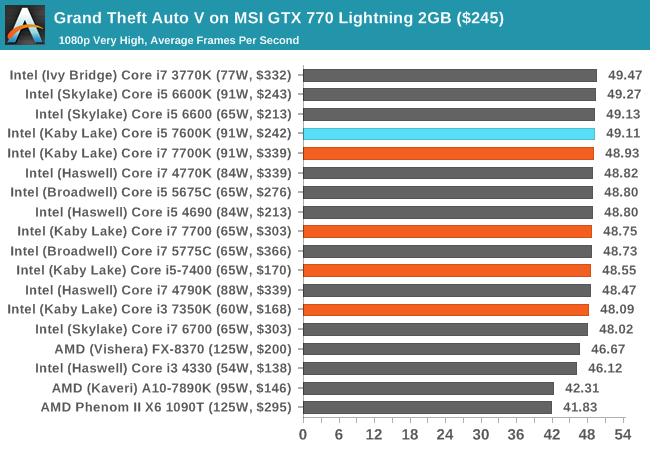
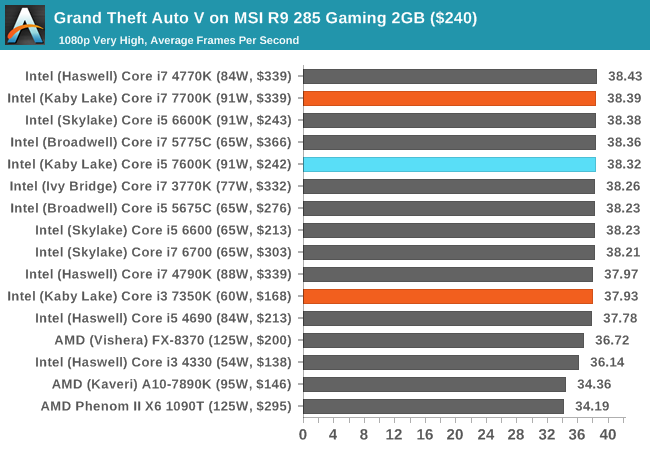
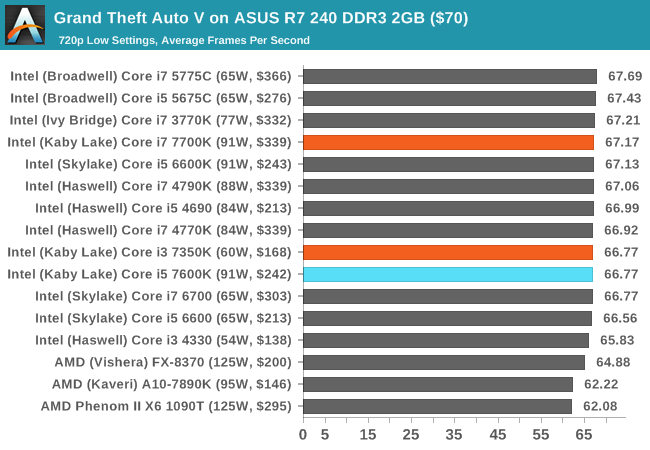
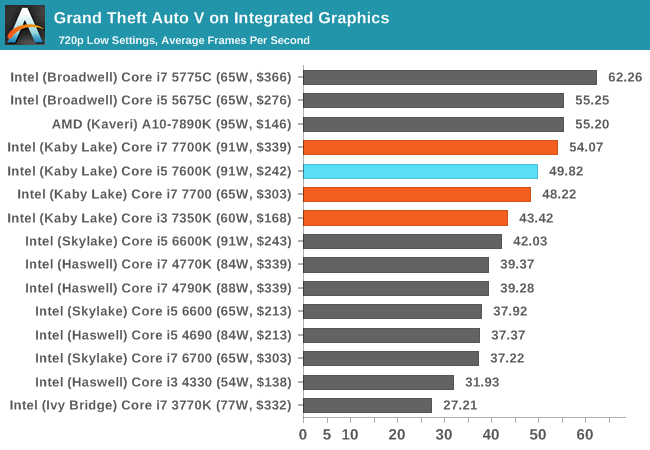
Grand Theft Auto V
The highly anticipated iteration of the Grand Theft Auto franchise finally hit the shelves on April 14th 2015, with both AMD and NVIDIA in tow to help optimize the title. GTA doesn’t provide graphical presets, but opens up the options to users and extends the boundaries by pushing even the hardest systems to the limit using Rockstar’s Advanced Game Engine. Whether the user is flying high in the mountains with long draw distances or dealing with assorted trash in the city, when cranked up to maximum it creates stunning visuals but hard work for both the CPU and the GPU.
For our test we have scripted a version of the in-game benchmark, relying only on the final part which combines a flight scene along with an in-city drive-by followed by a tanker explosion. For low-end systems we test at 720p on the lowest settings, whereas mid and high-end graphics play at 1080p with very high settings across the board. We record both the average frame rate and the percentage of frames under 60 FPS (16.6ms).
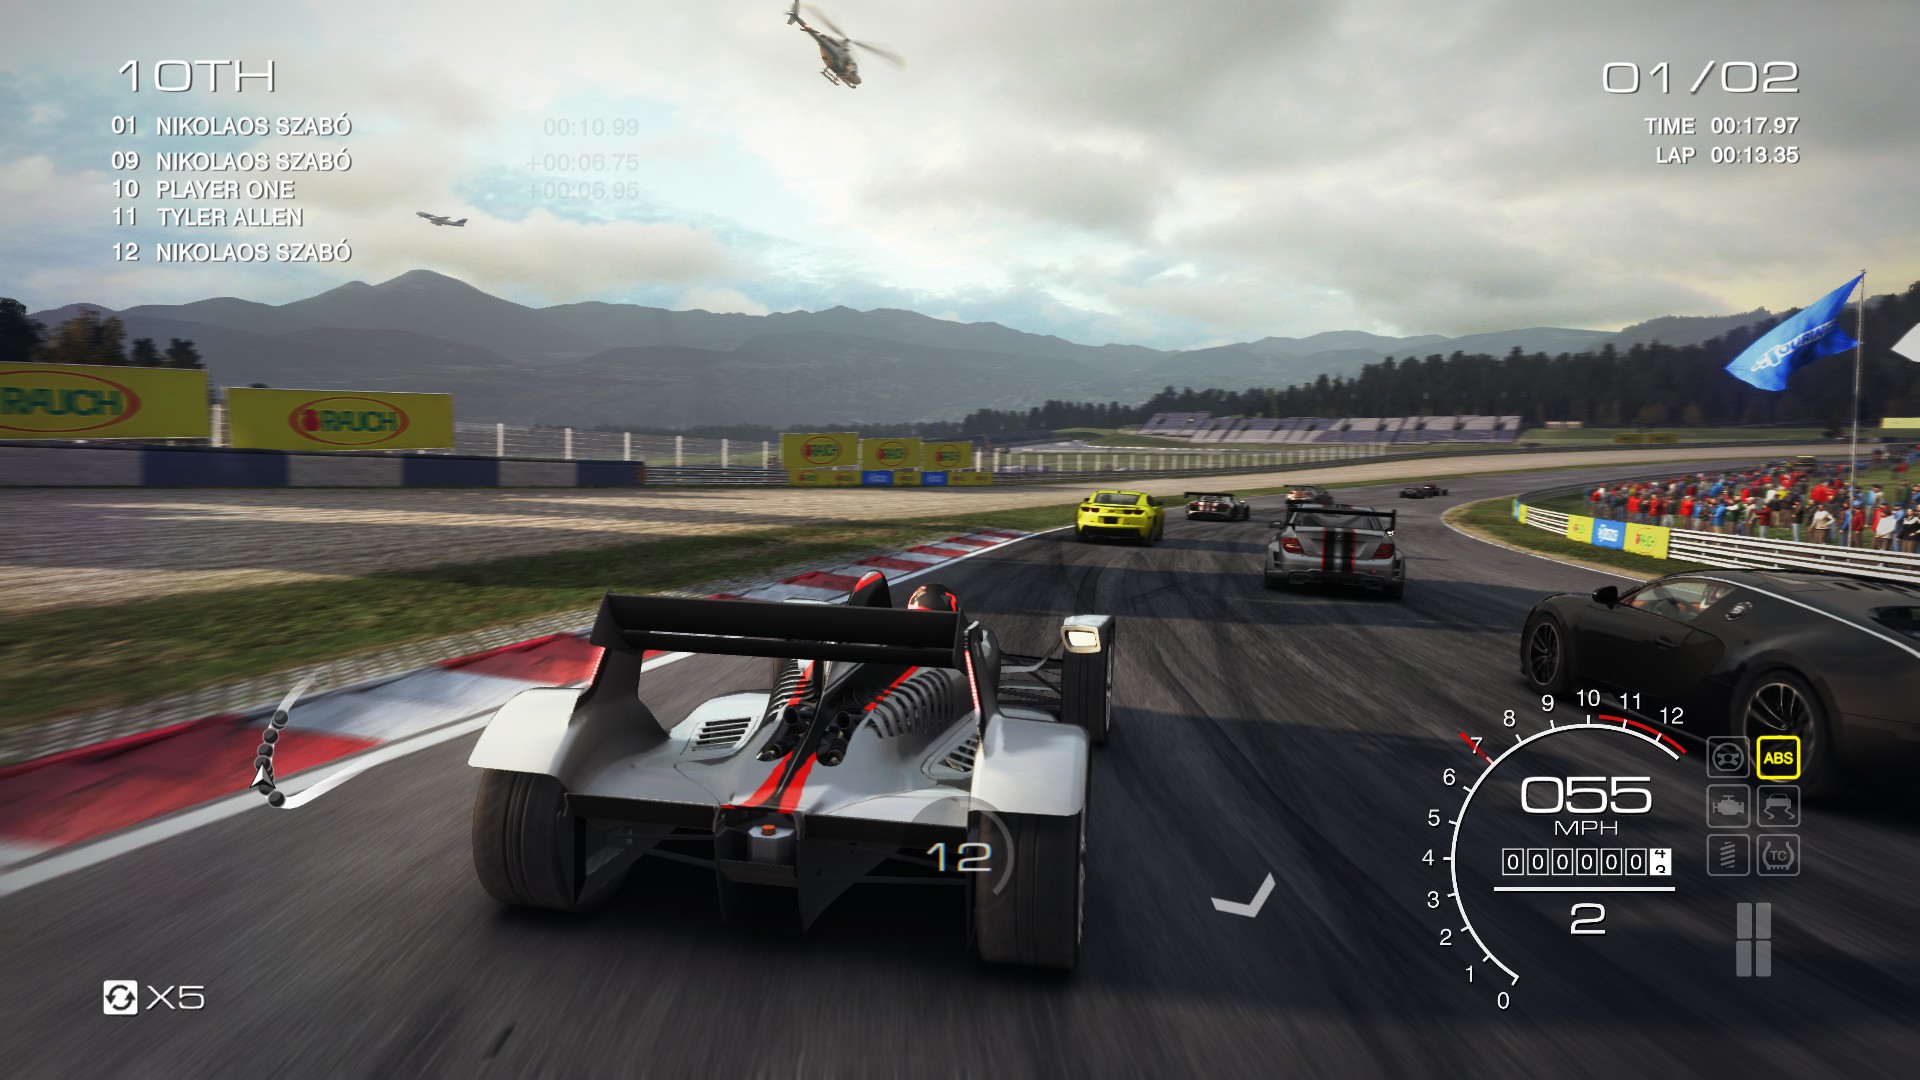
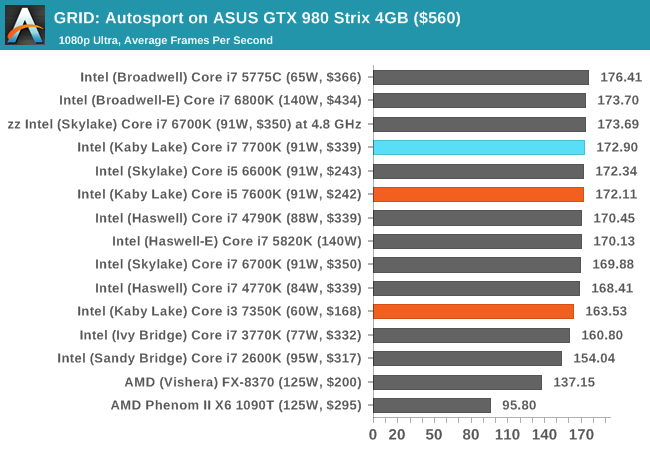
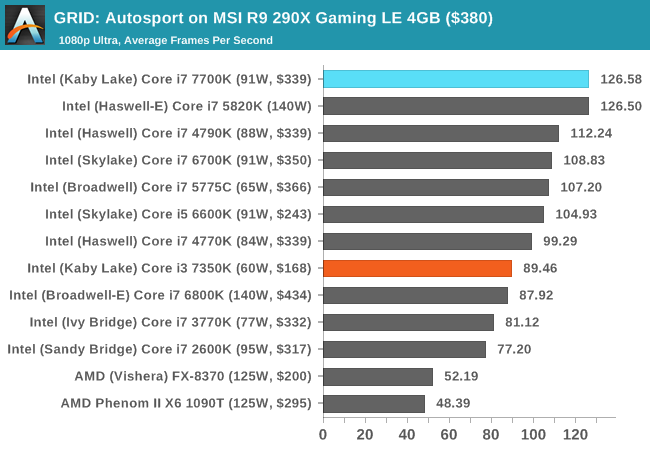
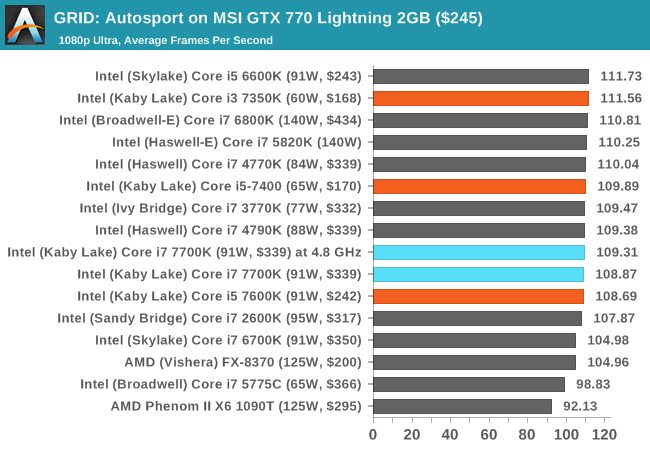
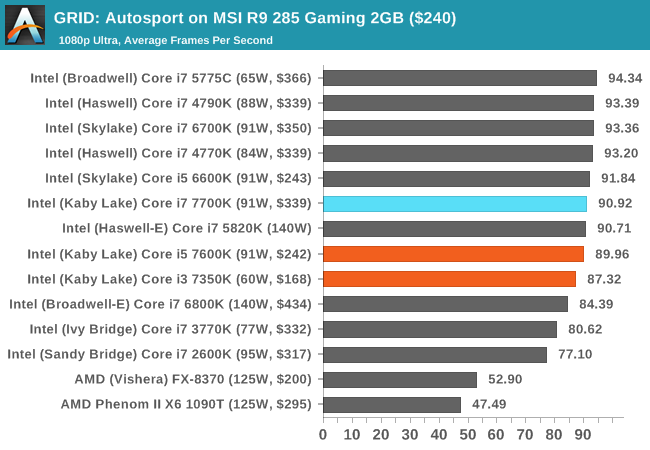
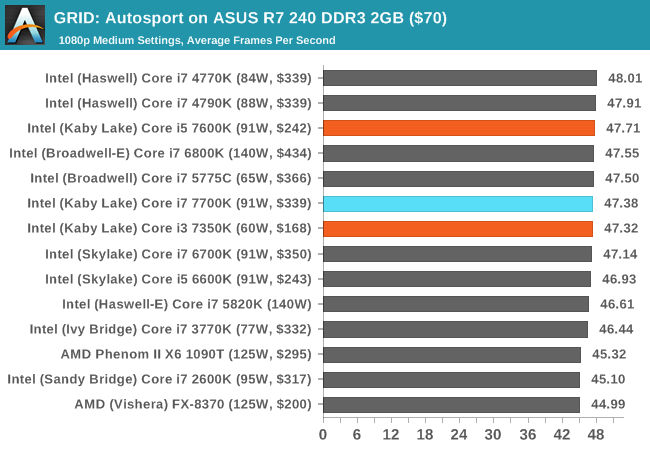
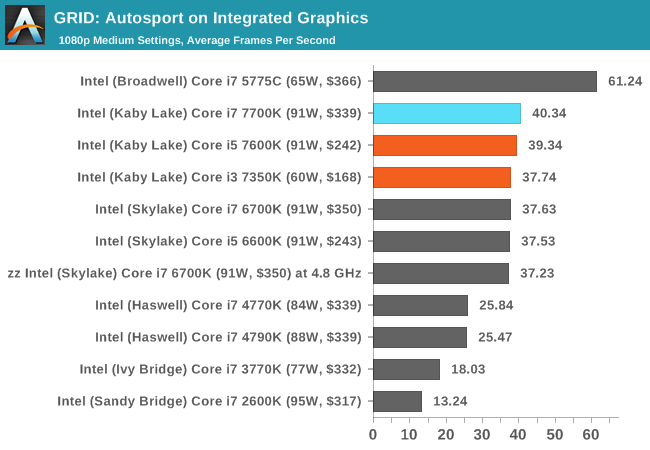
GRID Autosport
No graphics tests are complete without some input from Codemasters and the EGO engine, which means for this round of testing we point towards GRID: Autosport, the next iteration in the GRID and racing genre. As with our previous racing testing, each update to the engine aims to add in effects, reflections, detail and realism, with Codemasters making ‘authenticity’ a main focal point for this version.
GRID’s benchmark mode is very flexible, and as a result we created a test race using a shortened version of the Red Bull Ring with twelve cars doing two laps. The car is focus starts last and is quite fast, but usually finishes second or third. For low-end graphics we test at 1080p medium settings, whereas mid and high-end graphics get the full 1080p maximum. Both the average and minimum frame rates are recorded.