


<br>")

, 전세계 일자리 파괴 가속화 “육체노동만 살아남나?”<br>")


<br>")

 다운로드 및 설치<br>")
![삼성, 잃어버린 10년 [풀영상] | 창 458회 (KBS 24.03.12) by 인공지능](https://raptor-hw.net/xe/files/thumbnails/453/204/271x205.crop.jpg "삼성, 잃어버린 10년 [풀영상] | 창 458회 (KBS 24.03.12)<br>")


’ 오픈<br>")


 ' alt='위대한 인류최대 수퍼로켓 '스타십(Spacex Starship)' 발사 성공 by 인공지능' />


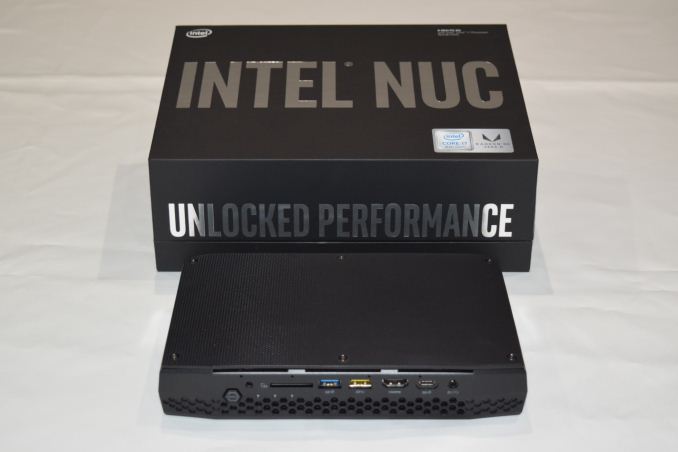
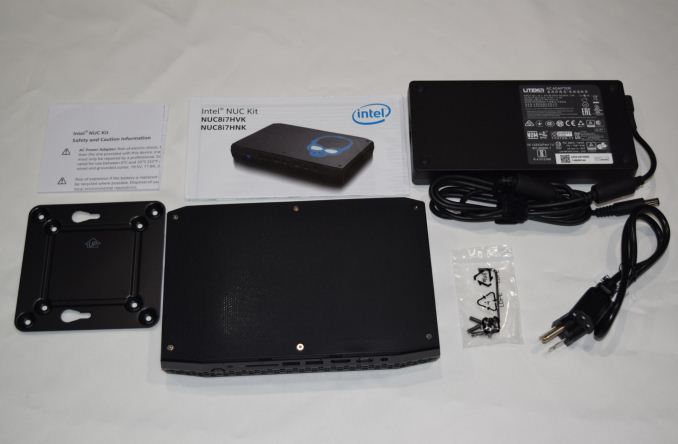
인텔 하데스캐년 탑재 누크 The Intel NUC8i7HVK 벤치마크
| Intel NUC8i7HVK (Hades Canyon) Specifications | |
| Processor | Intel Core i7-8809G Kaby Lake, 4C/8T, 3.1GHz (up to 4.2GHz), 14nm+, 8MB L2, 100W Package TDP |
| Memory | Kingston HyperX Impact HX432S20IB2K2/16 DDR4 20-22-22-42 @ 3200 MHz 2x8 GB |
| Graphics | Radeon RX Vega M GH 24 CUs, 64 PPC 1063-1190MHz GPU, 800MHz Memory 4GB / 1024-bit HBM2 On-Package |
| Disk Drive(s) | Intel Optane SSD 800p SSDPEK1W120GA (118 GB; M.2 Type 2280 PCIe 3.0 x2 NVMe; Optane) Intel SSD 545s SSDSCKKW512G8 (512 GB; M.2 Type 2280 SATA III; Intel 64L 3D TLC) |
| Networking | Intel Dual Band Wireless-AC 8265 (2x2 802.11ac - 866 Mbps) 1x Intel I219-LM Gigabit LAN 1x Intel I210 Gigabit LAN |
| Audio | 3.5mm Combo-audio Jack Capable of 5.1/7.1 digital output with HD audio bitstreaming (HDMI) |
| Miscellaneous I/O Ports | 2x Thunderbolt 3 (rear) 4x USB 3.0 Type-A (rear) 1x USB 3.1 Gen 2 Type-C (front) 1x USB 3.1 Gen 2 Type-A (front) 1x USB 3.0 Type-A Charging Port (front) 1x SDXC UHS-I Slot (front) CIR (front) 2x USB 3.0 / 2x USB 2.0 internal headers |
| Operating System | Retail unit is barebones, but we installed Windows 10 Enterprise x64 Build 16299.334 |
| Pricing (As configured) | $999 (barebones) / $1617 (as configured) |
| Full Specifications | Intel NUC8i7HVK Specifications |
인텔 Core i7-8809G의 CPU 부문은 4C/8T, 3.1GHz (최대 4.2GHz), 14nm+ 공정, 8MB L2 캐시, GPU 부문은 Radeon RX Vega M GH GPU가 탑재되어 24 CUs, 64 PPC, 1063-1190MHz, 800MHz Memory
4GB / 1024-bit HBM2 온 패키지 디자인, 칩 전체 TDP는 100W
%20Review%3A%20Kaby%20Lake-G%20Benchmarked&txt=%3Cimg%20alt%3D%22%22%20src%3D%22https%3A%2F%2Fimages.anandtech.com%2Fdoci%2F12572%2Fblock-diagram_575px.png%22%3E)
하데스캐년 블럭 다이어그램. 8809G CPU와 Radeon RX Vega M GH GPU는 PCI-EX 8X로 연결
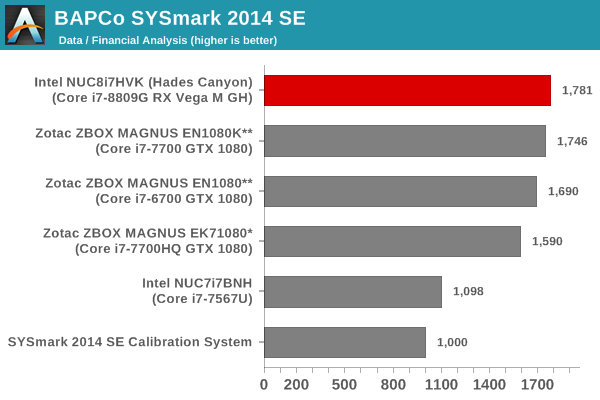
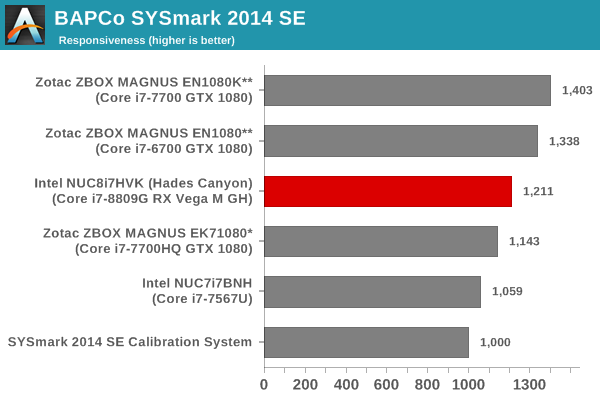
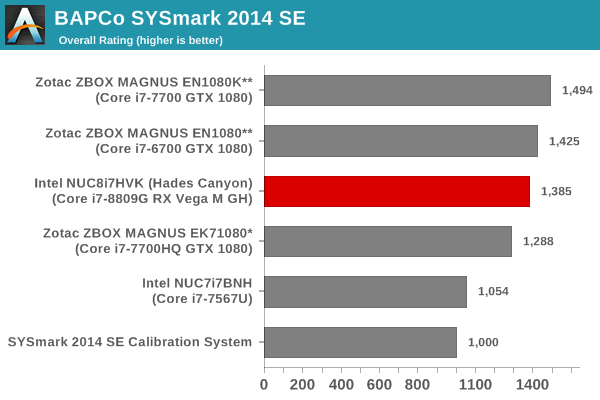
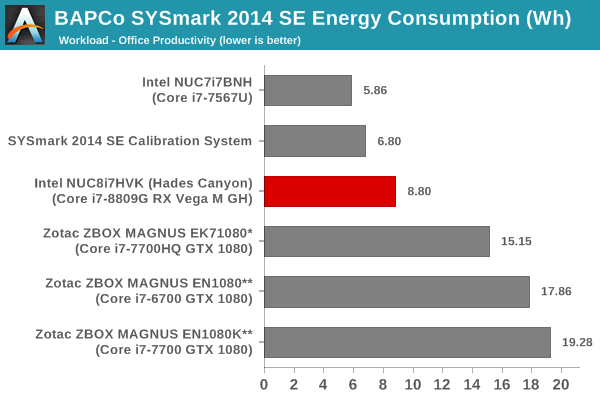
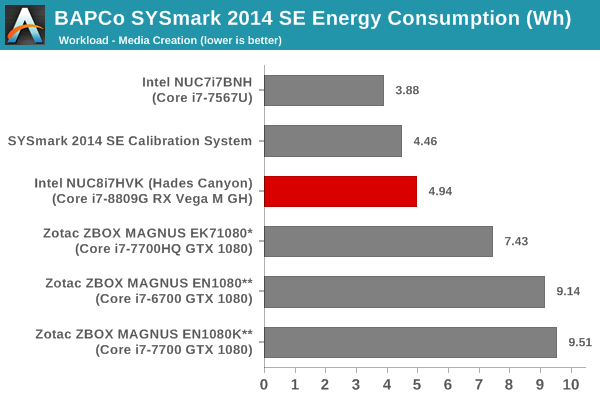
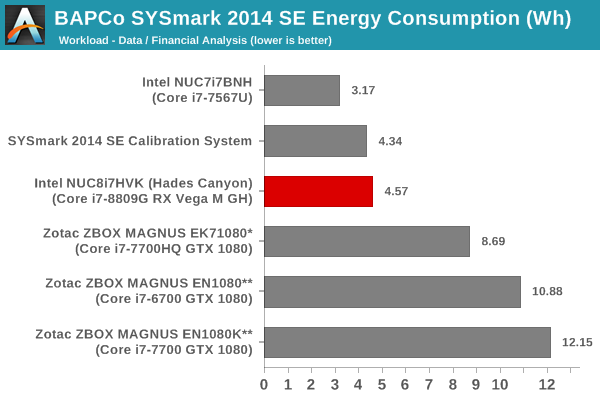

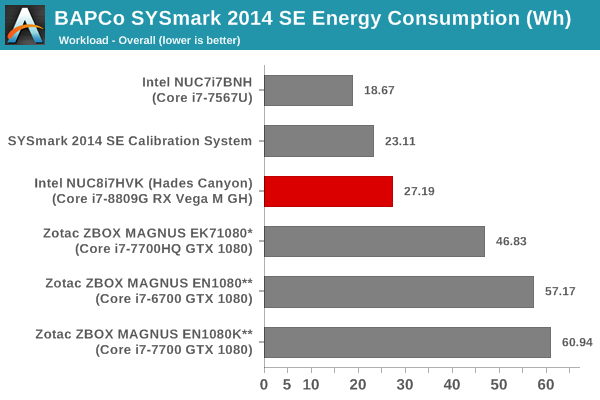
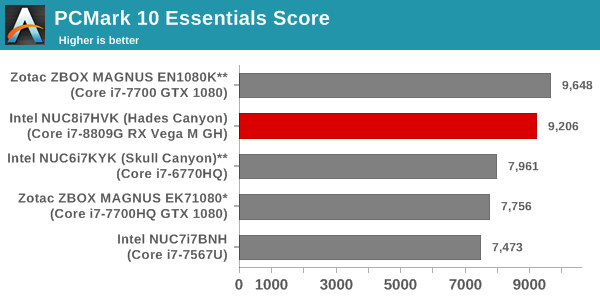
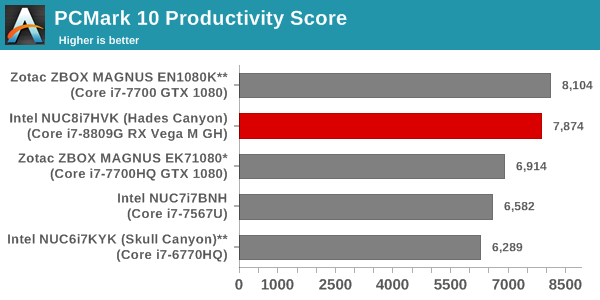
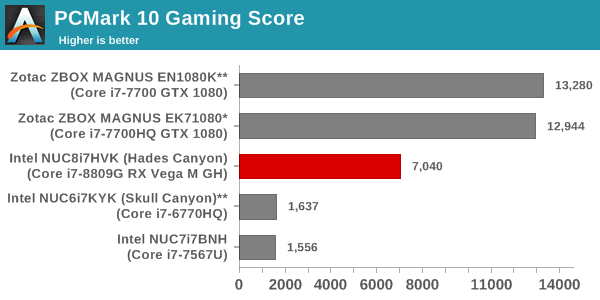
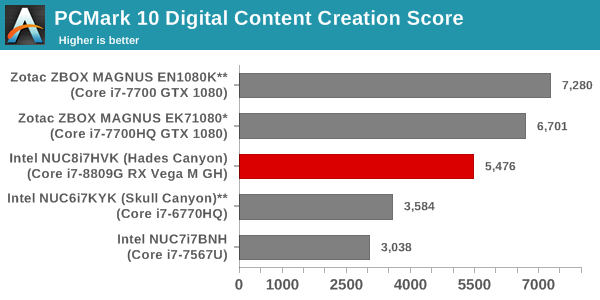
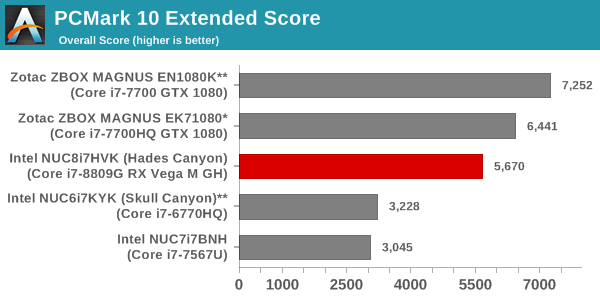
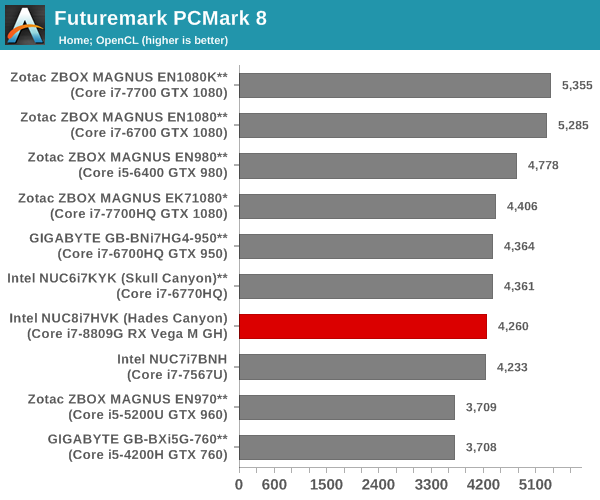
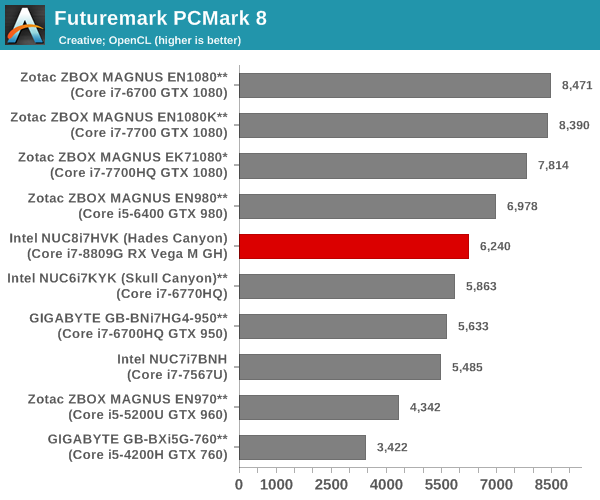
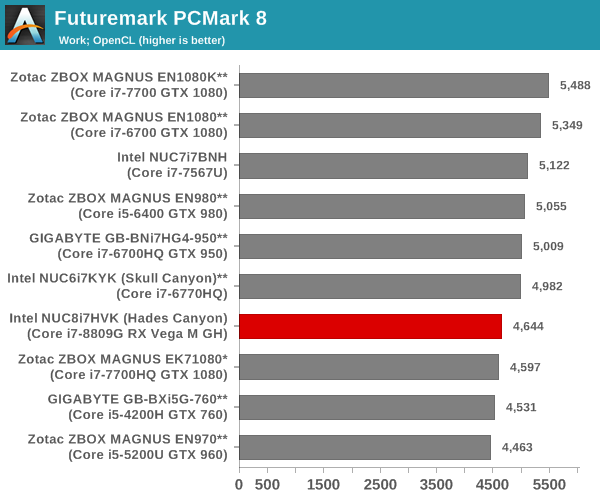
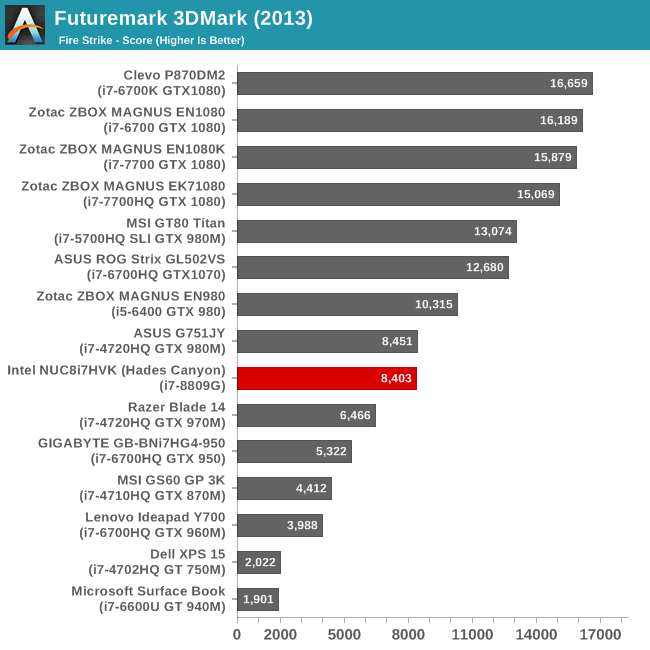
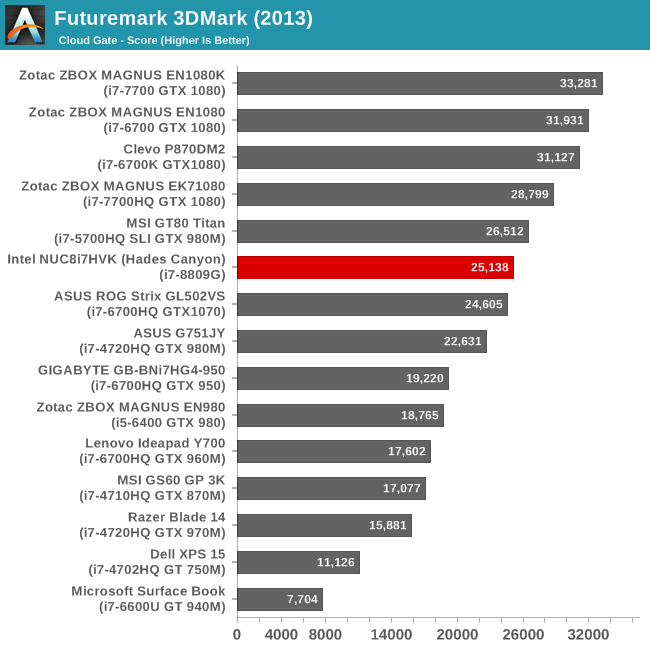
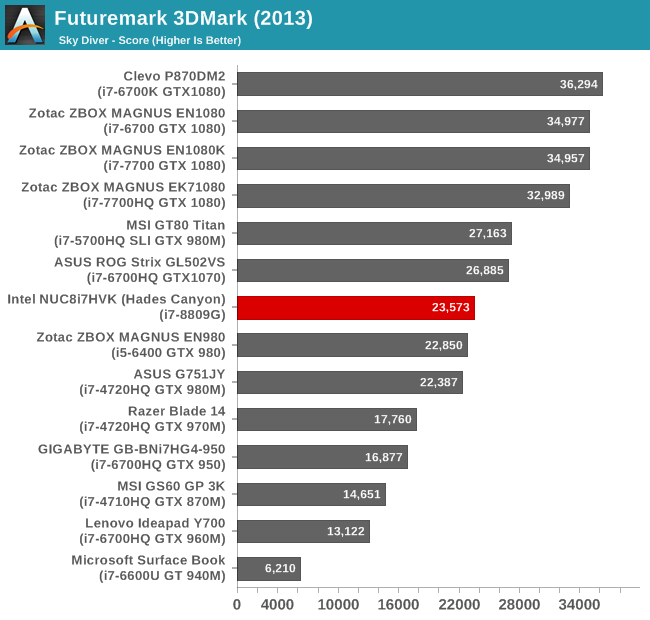
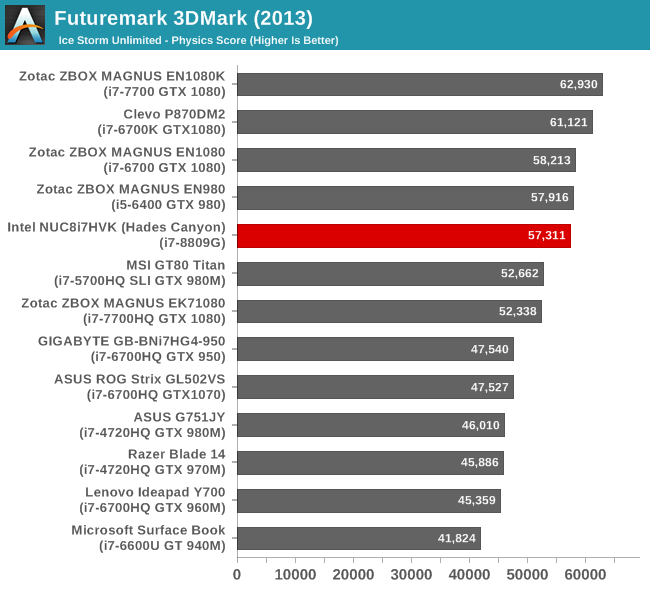
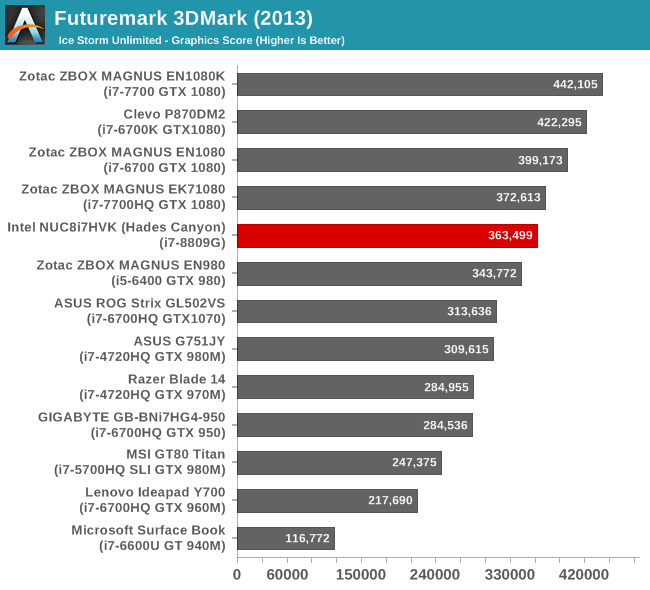
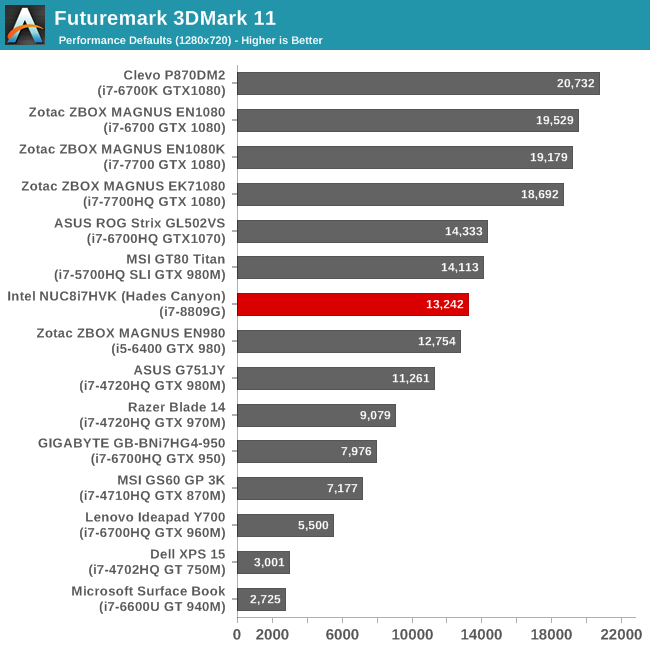
Miscellaneous Futuremark Benchmarks
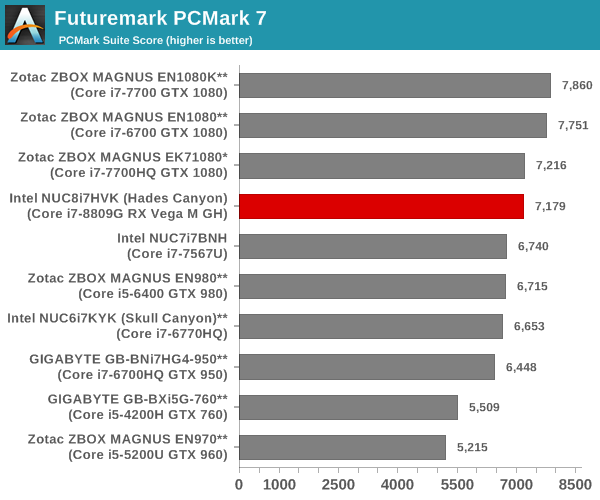
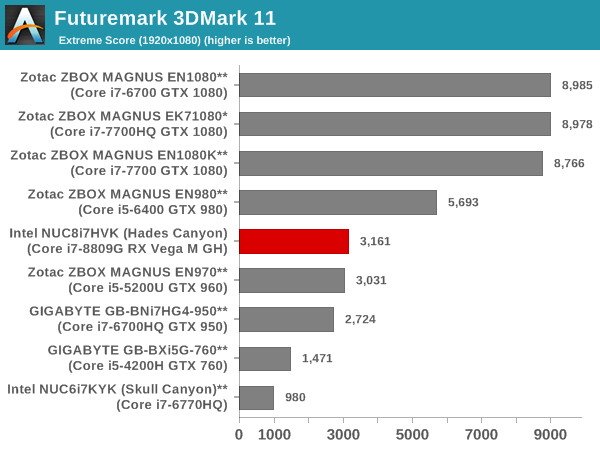
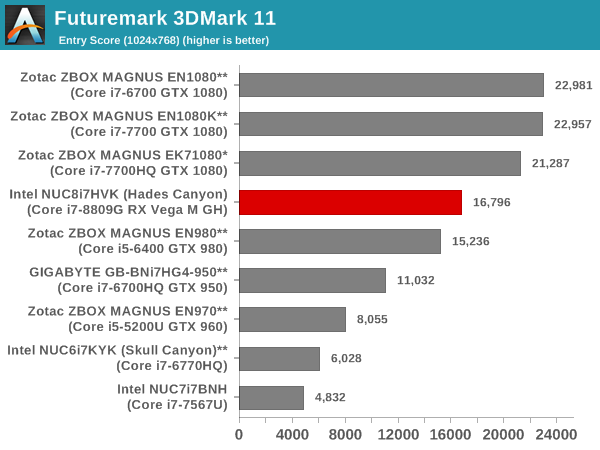
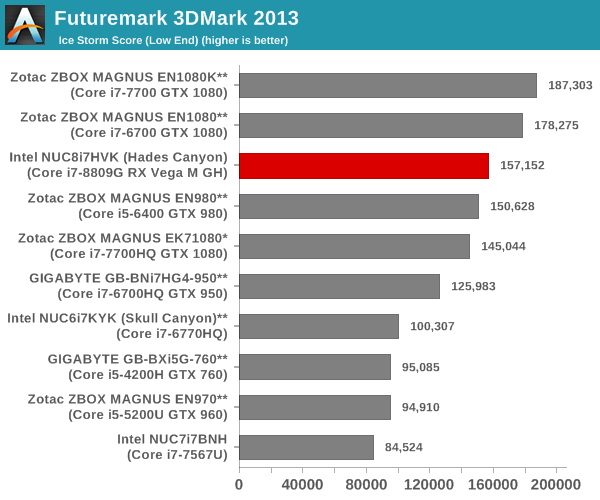
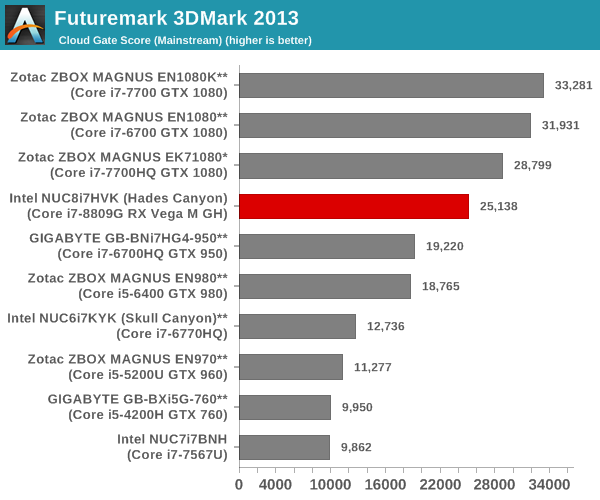
Miscellaneous Futuremark Benchmarks
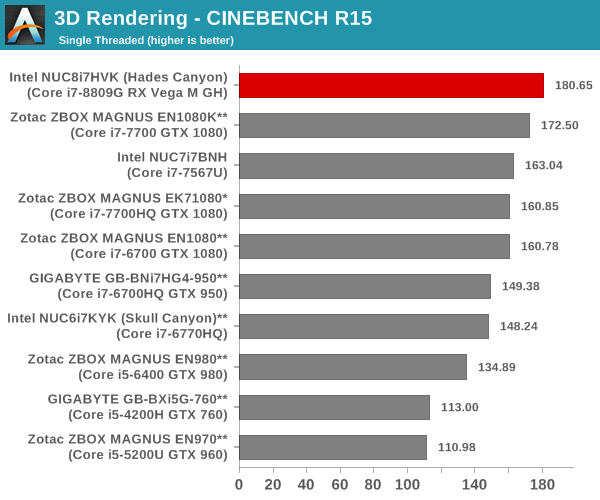
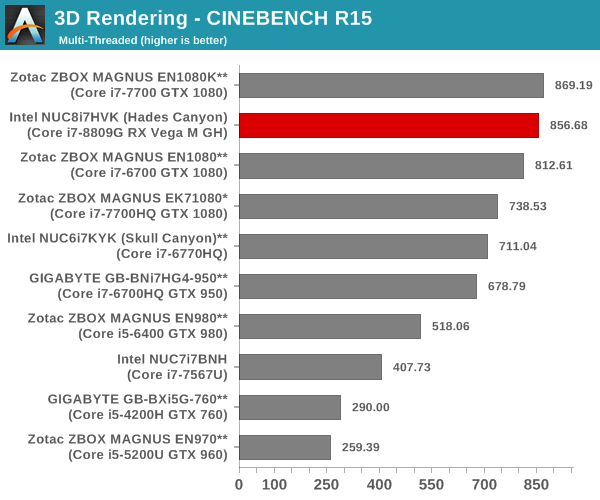
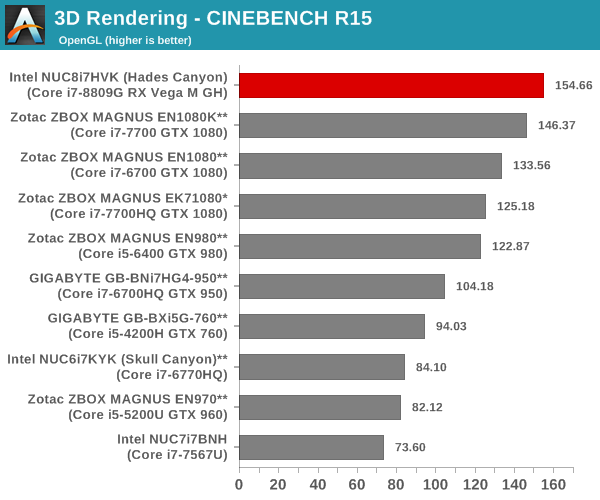
3D Rendering - CINEBENCH R15
We have moved on from R11.5 to R15 for 3D rendering evaluation. CINEBENCH R15 provides three benchmark modes - OpenGL, single threaded and multi-threaded. Evaluation of select PCs in all three modes provided us the following results. Here, we see the benefits of running the CPU die with a 65W TDP. The scores match or beat the results from the Core i7-7700 in the ZBOX MAGNUS EN1080K.
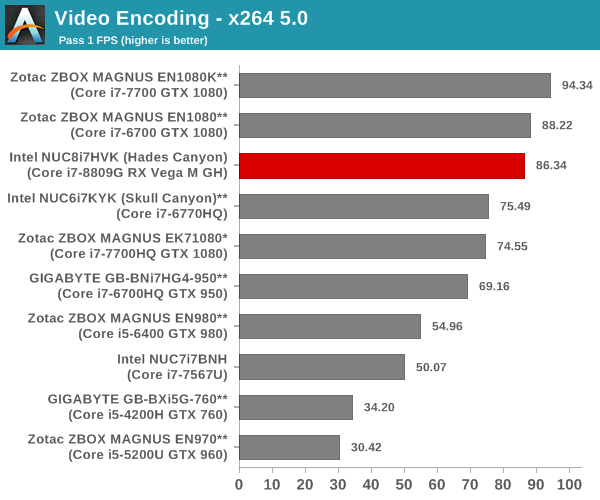
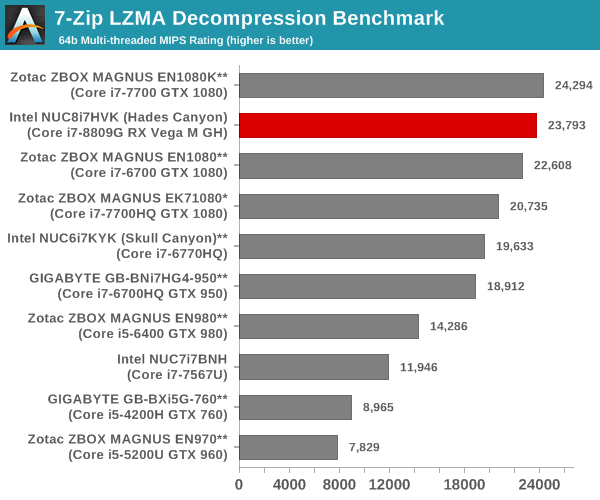
7-Zip
7-Zip is a very effective and efficient compression program, often beating out OpenCL accelerated commercial programs in benchmarks even while using just the CPU power. 7-Zip has a benchmarking program that provides tons of details regarding the underlying CPU's efficiency. In this subsection, we are interested in the compression and decompression MIPS ratings when utilizing all the available threads. The performance order is similar to the one encountered in the x264 benchmark.

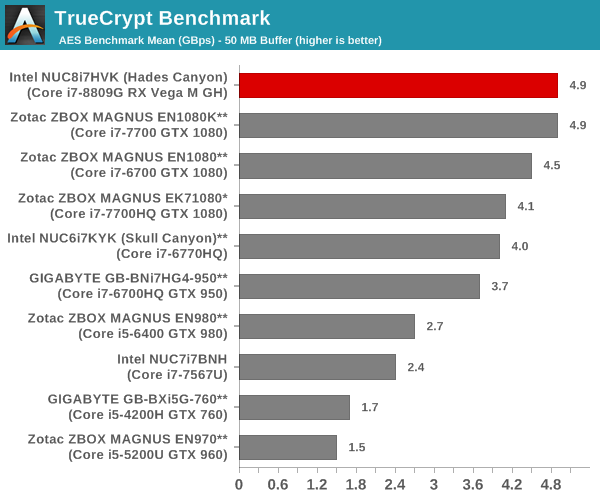
TrueCrypt
As businesses (and even home consumers) become more security conscious, the importance of encryption can't be overstated. CPUs supporting the AES-NI instruction for accelerating the encryption and decryption processes have become more widespread over the last few years. TrueCrypt, a popular open-source disk encryption program can take advantage of the AES-NI capabilities. The TrueCrypt internal benchmark provides some interesting cryptography-related numbers to ponder. In the graph below, we can get an idea of how fast a TrueCrypt volume would behave in the Intel NUC8i7HVK (Hades Canyon) and how it would compare with other select PCs. This is a purely CPU feature / clock speed based test.
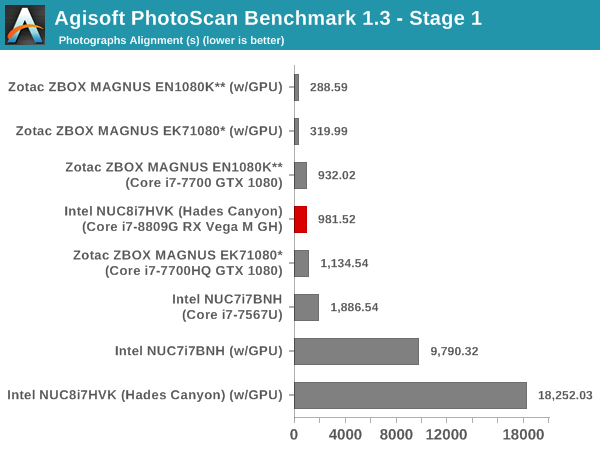
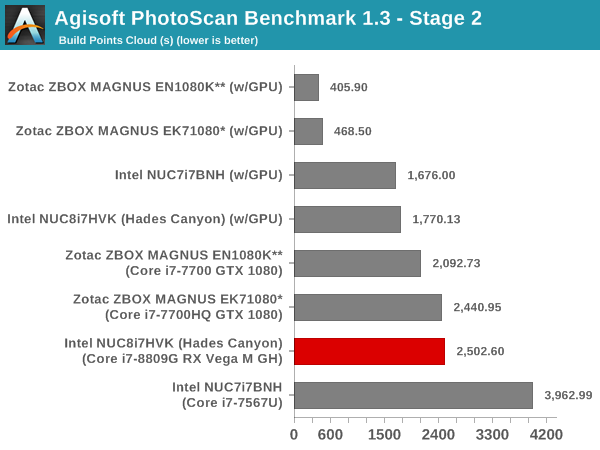
Agisoft Photoscan
Agisoft PhotoScan is a commercial program that converts 2D images into 3D point maps, meshes and textures. The program designers sent us a command line version in order to evaluate the efficiency of various systems that go under our review scanner. The command line version has two benchmark modes, one using the CPU and the other using both the CPU and GPU (via OpenCL). We have been using an old version of the program with 50 photogaphs in our reviews till now. The updated benchmark (v1.3) now takes around 84 photographs and does four stages of computation:
- Stage 1: Align Photographs (capable of OpenCL acceleration)
- Stage 2: Build Point Cloud (capable of OpenCL acceleration)
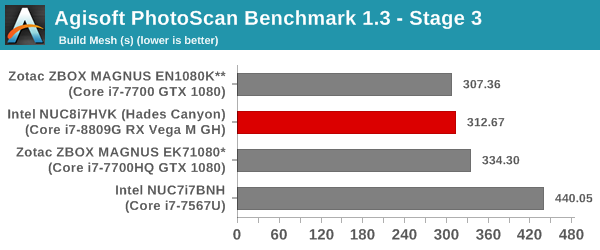
- Stage 3: Build Mesh
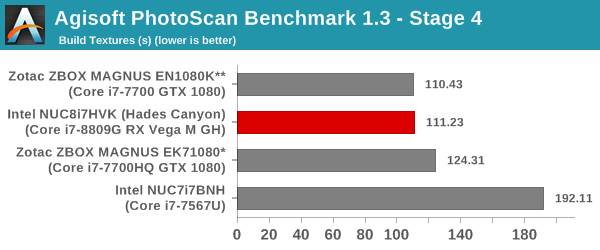
- Stage 4: Build Textures
We record the time taken for each stage. Since various elements of the software are single threaded, others multithreaded, and some use GPUs, it is interesting to record the effects of CPU generations, speeds, number of cores, DRAM parameters and the GPU using this software.
The GPU-enabled numbers for Stage 1 and 2 below are with the use of the Intel HD Graphics 630, since our benchmark version only supports use of the first enumerated GPU. Unfortunately, when we tried to disable the integrated GPU and use only the discrete GPU after changing the BIOS setting, the benchmark consistently crashed while starting the first stage itself.
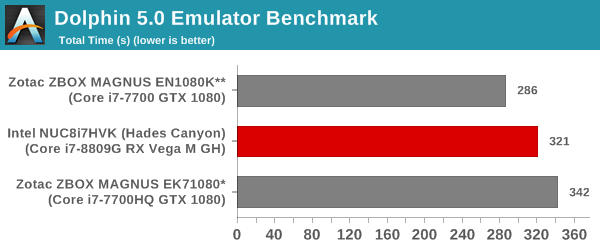
Dolphin Emulator
Wrapping up our application benchmark numbers is the new Dolphin Emulator (v5) benchmark mode results. This is again a test of the CPU capabilities, and the Core i7-8809G slots inbetween the 45W TDP Core i7-7700HQ and the 65W Core i7-7700.
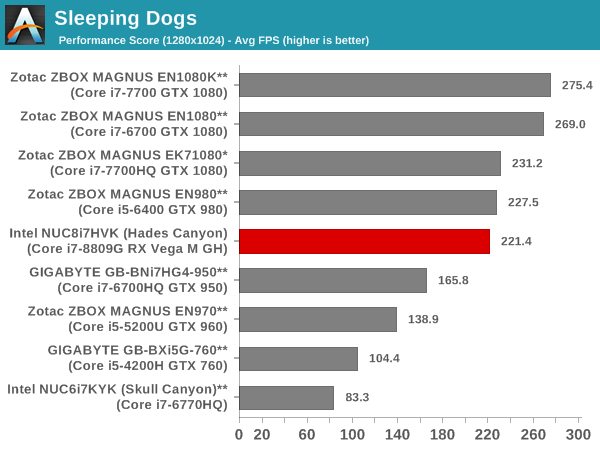
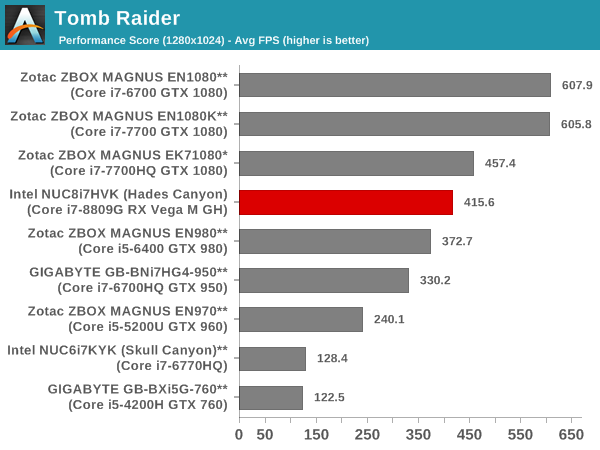
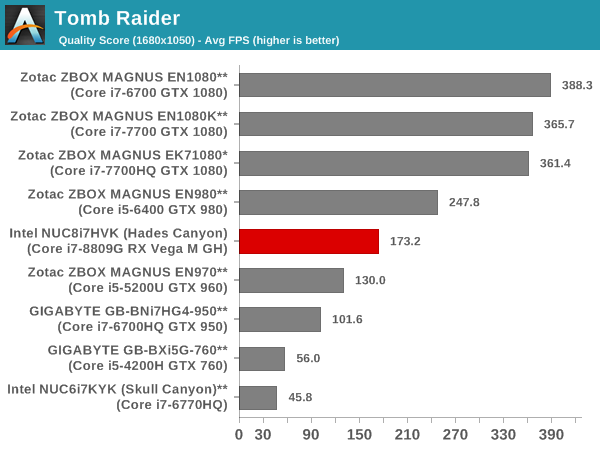
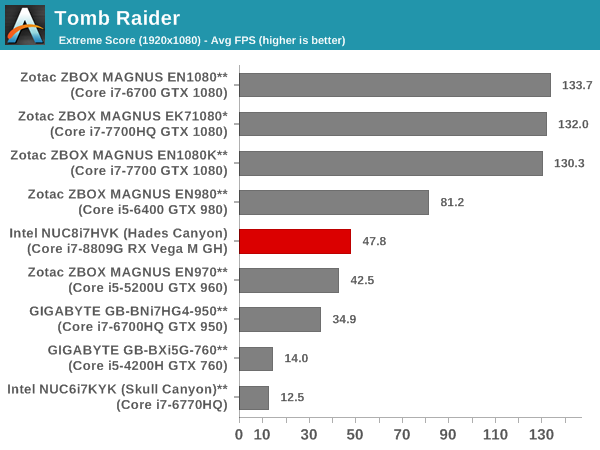
Tomb Raider
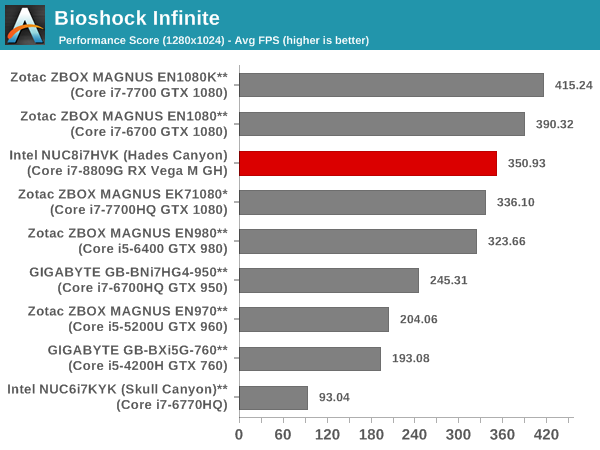
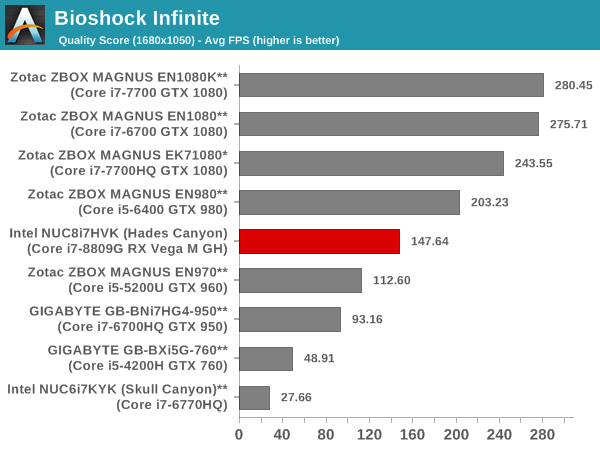
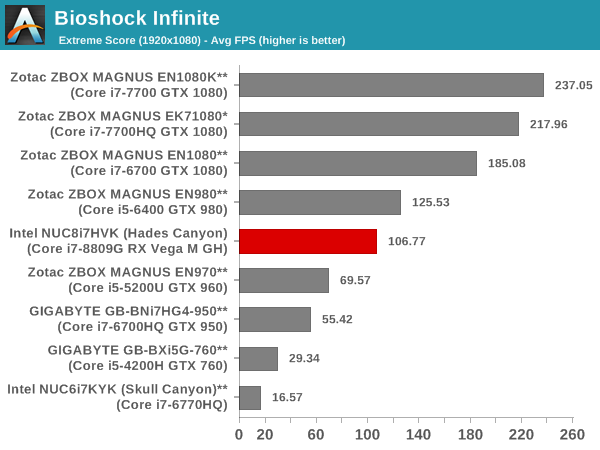
Bioshock Infinite
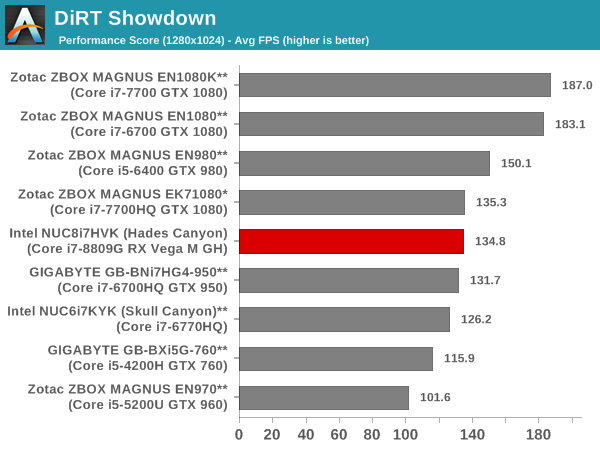
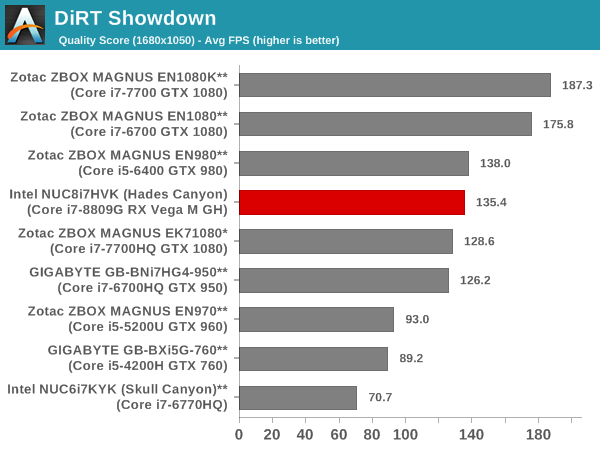
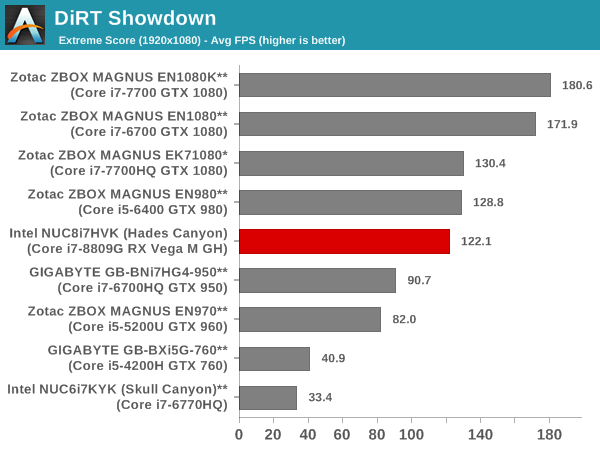
DiRT Showdown
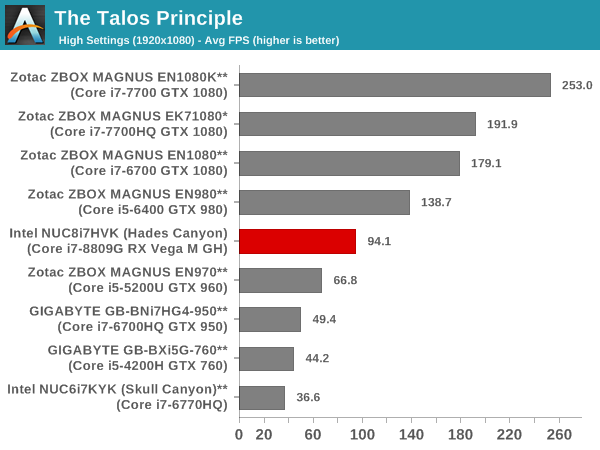
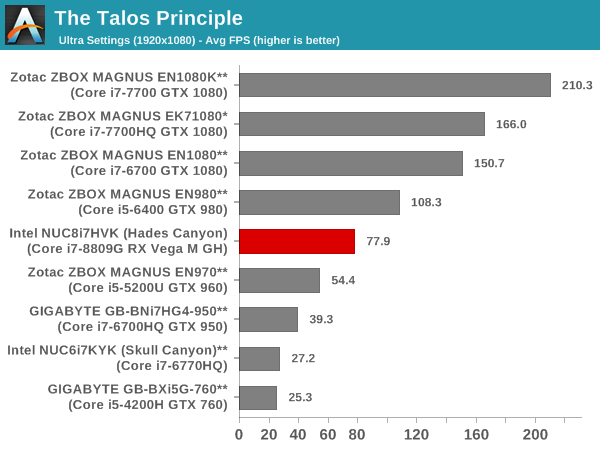
The Talos Principle
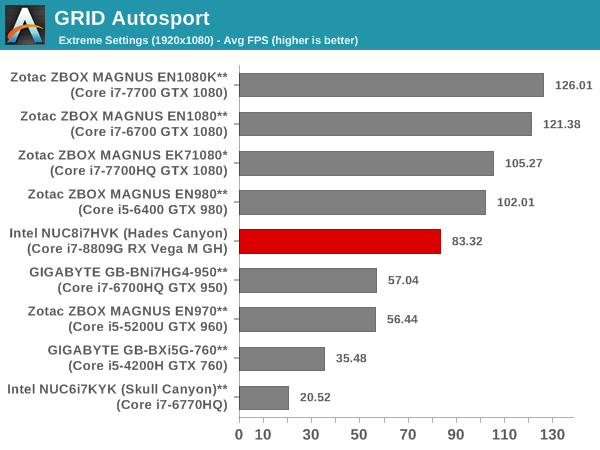
GRID Autosport
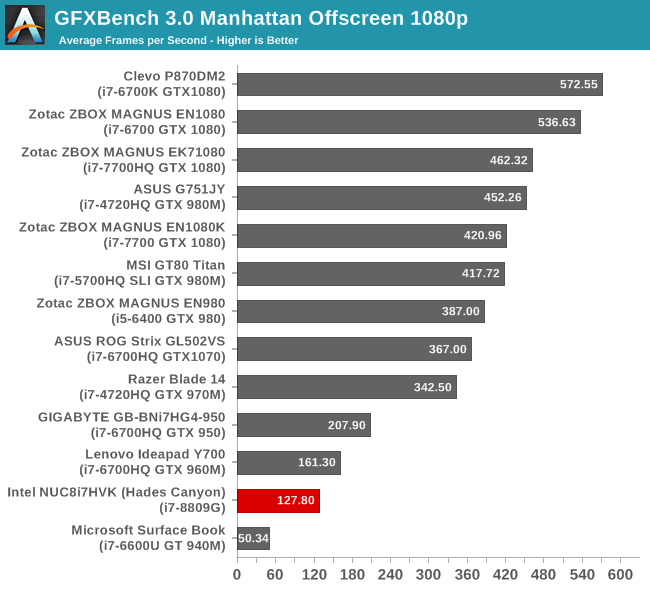
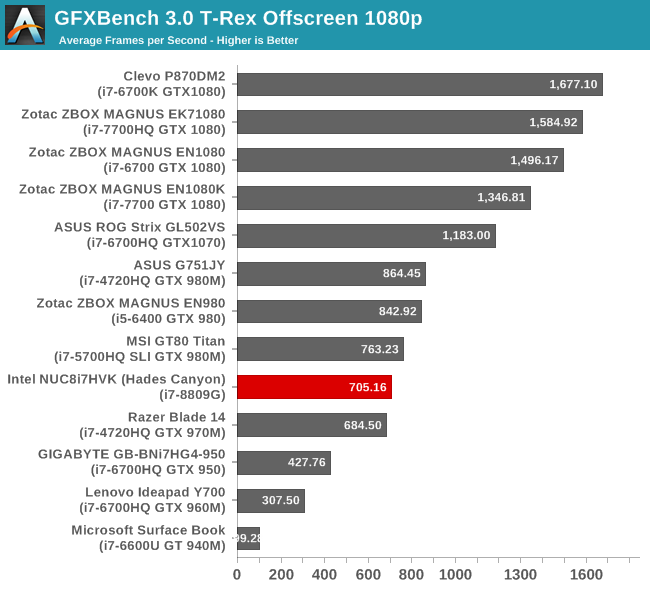
GFXBench
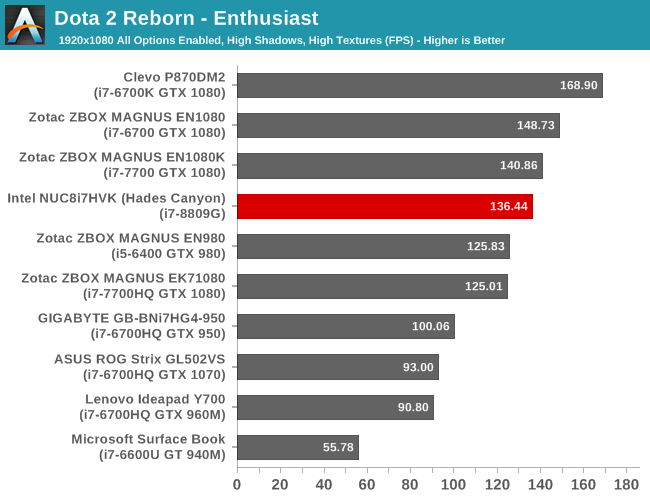
Dota 2
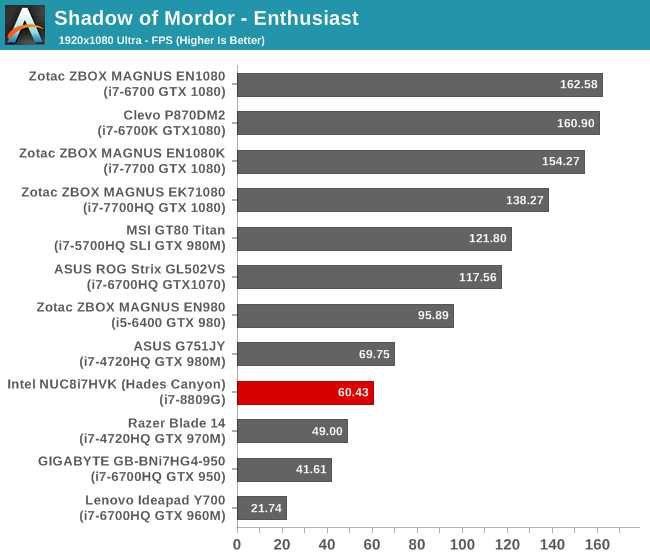
Middle Earth: Shadow of Mordor
출처 - https://www.anandtech.com
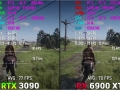
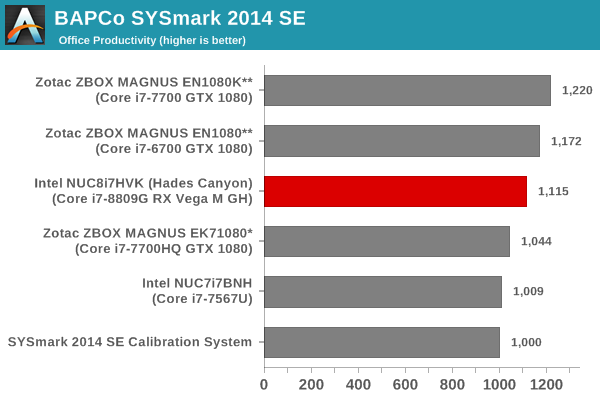
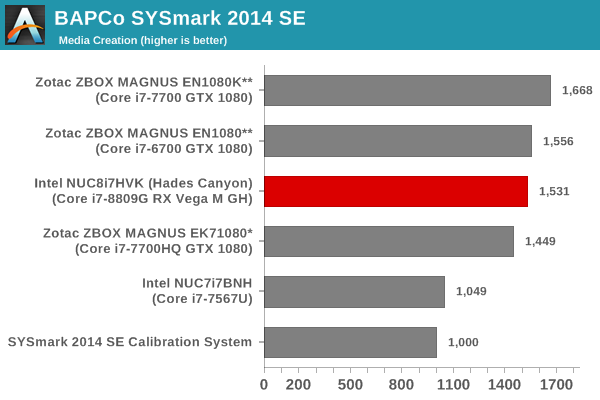
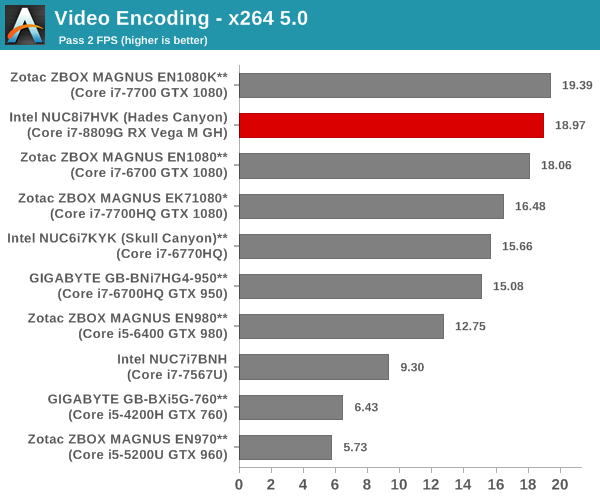
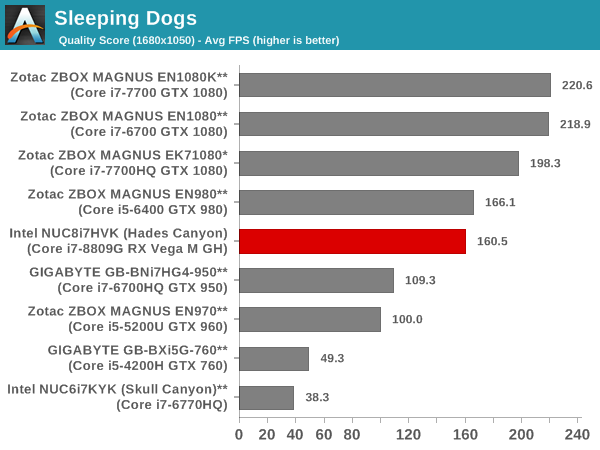
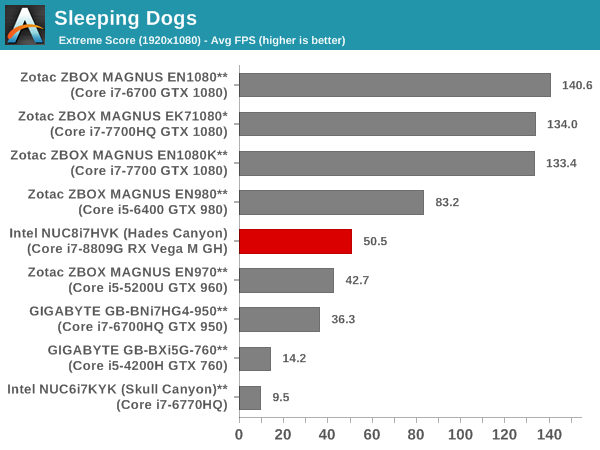
인텔 카비레이크-G Core i7-8809G 프로세서의 CPU는 i7-7700HQ 급 성능에 지포스GTX 960~980급 사이에 위치하는 GPU 성능으로 엄청난 CPU + GPU 성능을 나타내고 있다.