4월 28일 (일) 오후 6:21
랩터 인터내셔널에 오신걸 환영 합니다
>

logo

  • head
  • news
  • product
  • mobile
  • benchmark
  • analysis
  • computing
  • multimedia

"SAN"은 "Storage Area Network"...
웹 애플리케이션에서의 버퍼 오버...
XSS(크로스 사이트 스크립팅) 취...

EVGA.png


GeForce GTX 1070 Ti Specification Comparison
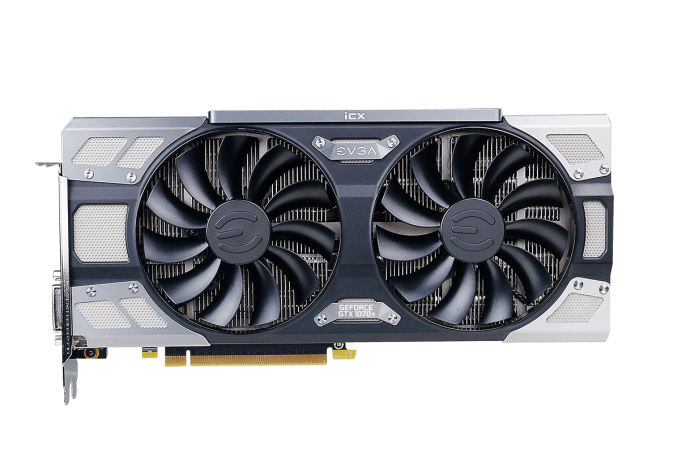
 EVGA
GTX 1070 Ti FTW2
NVIDIA
GTX 1070 Ti Founders Edition
EVGA
GTX 1070 Ti SC Black Ed.
CUDA Cores243224322432
Texture Units152152152
ROPs646464
Core Clock1607+MHz1607MHz1607+MHz
Boost Clock1683+MHz1683MHz1683+MHz
Memory Clock8Gbps GDDR58Gbps GDDR58Gbps GDDR5
Memory Bus Width256-bit256-bit256-bit
VRAM8GB8GB8GB
TDP180W180W150W
Power Connectors2x 8-pin1x 8pin1x 8pin
CoolingDual fan open airBlowerDual fan open air
GPUGP104GP104GP104
Manufacturing ProcessTSMC 16nmTSMC 16nmTSMC 16nm
Launch Date11/02/201711/02/201711/02/2017
Launch MSRP$499$449$469
Current MSRP$569-$519


Battlefield 1 - 3840x2160 - Ultra Quality

Battlefield 1 - 2560x1440 - Ultra Quality

Battlefield 1 - 1920x1080 - Ultra Quality

Battlefield 1 - 99th Percentile - 3840x2160 - Ultra Quality

Battlefield 1 - 99th Percentile - 2560x1440 - Ultra Quality

Battlefield 1 - 99th Percentile - 1920x1080 - Ultra Quality

Ashes of the Singularity: Escalation - 3840x2160 - Extreme Quality

Ashes of the Singularity: Escalation - 2560x1440 - Extreme Quality

Ashes of the Singularity: Escalation - 1920x1080 - Extreme Quality

Ashes: Escalation - 99th Percentile - 3840x2160 - Extreme Quality

Ashes: Escalation - 99th Percentile - 2560x1440 - Extreme Quality

Ashes: Escalation - 99th Percentile - 1920x1080 - Extreme Quality


Doom - 3840x2160 - Ultra Quality

Doom - 2560x1440 - Ultra Quality

Doom - 1920x1080 - Ultra Quality

Doom - 99th Percentile - 3840x2160 - Ultra Quality

Doom - 99th Percentile - 2560x1440 - Ultra Quality

Doom - 99th Percentile - 1920x1080 - Ultra Quality


Ghost Recon Wildlands - 3840x2160 - Very High Quality

Ghost Recon Wildlands - 2560x1440 - Very High Quality

Ghost Recon Wildlands - 1920x1080 - Very High Quality


Dawn of War III - 3840x2160 - Ultra Quality

Dawn of War III - 2560x1440 - Ultra Quality

Dawn of War III - 1920x1080 - Ultra Quality

Dawn of War III - 99th Percentile - 3840x2160 - Ultra Quality

Dawn of War III - 2560x1440 - Ultra Quality

Dawn of War III - 1920x1080 - Ultra Quality


Deus Ex: Mankind Divided - 3840x2160 - Ultra Quality

Deus Ex: Mankind Divided - 2560x1440 - Ultra Quality

Deus Ex: Mankind Divided - 1920x1080 - Ultra Quality


Grand Theft Auto V - 3840x2160 - Very High Quality

Grand Theft Auto V - 2560x1440 - Very High Quality

Grand Theft Auto V - 1920x1080 - Very High Quality

Grand Theft Auto V - 99th Percentile - 3840x2160 - Very High Quality

Grand Theft Auto V - 99th Percentile - 2560x1440 - Very High Quality

Grand Theft Auto V - 99th Percentile - 1920x1080 - Very High Quality


F1 2016 - 3840x2160 - Ultra Quality

F1 2016 - 2560x1440 - Ultra Quality

F1 2016 - 1920x1080 - Ultra Quality

Total War: Warhammer - 3840x2160 - Ultra Quality

Total War: Warhammer - 2560x1440 - Ultra Quality

Total War: Warhammer - 1920x1080- Ultra Quality

Total War: Warhammer - 99th Percentile - 3840x2160 - Ultra Quality

Total War: Warhammer - 99th Percentile - 2560x1440 - Ultra Quality

Total War: Warhammer - 99th Percentile - 1920x1080 - Ultra Quality


Idle Power Consumption

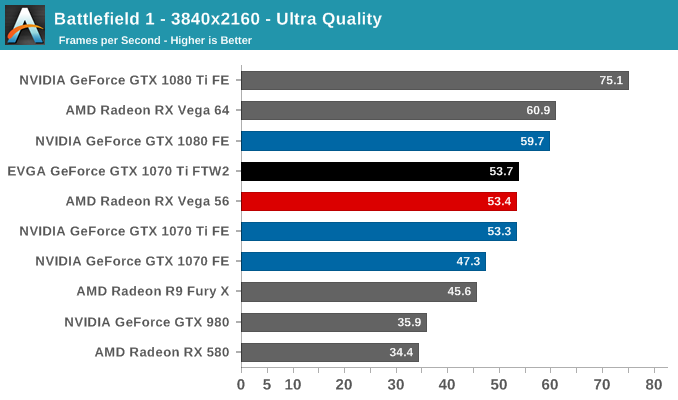
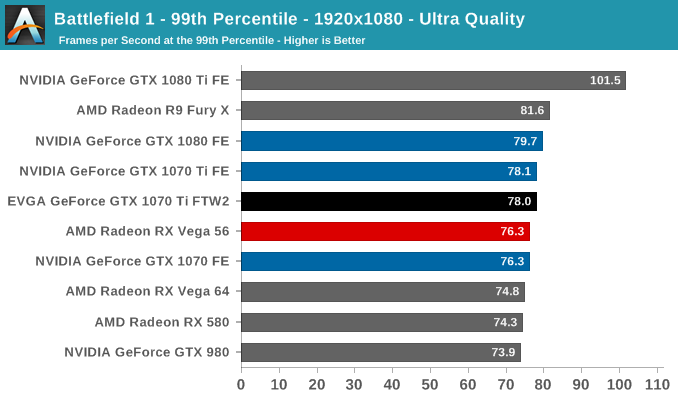
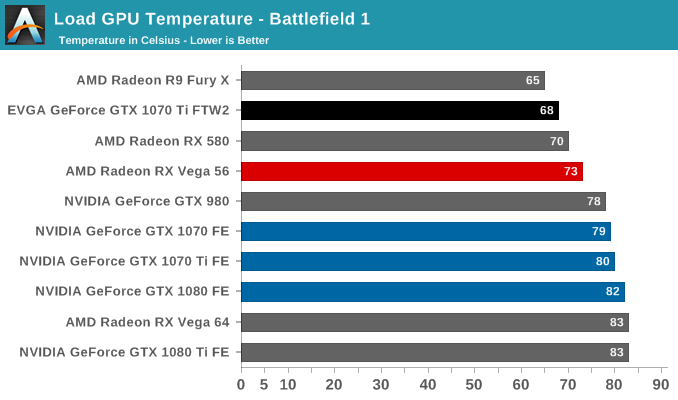
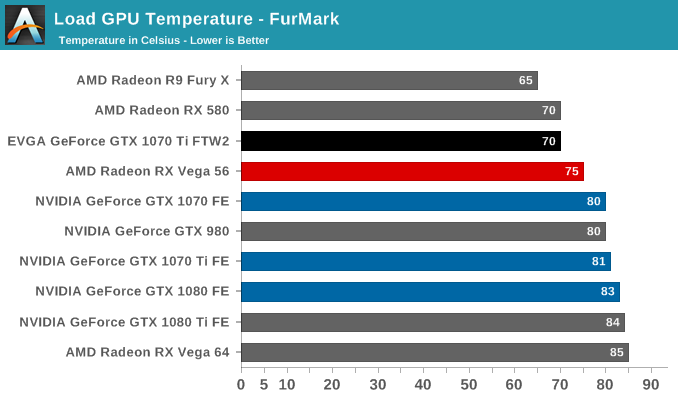
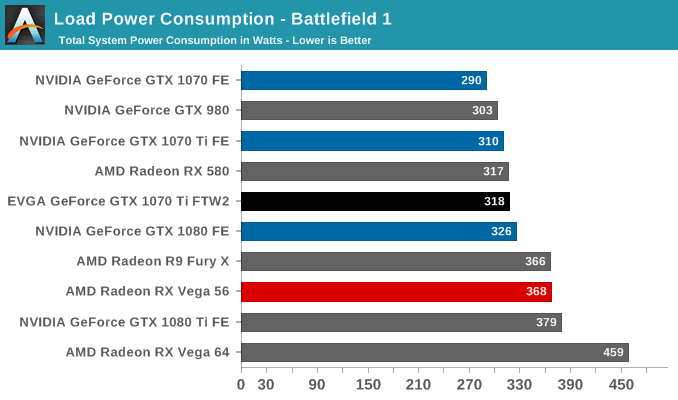
While the stated TDP remains 180W, the GTX 1070 FTW2 does possess two 8-pin PCIe power connectors over the Founders Edition’s single 6-pin. Considering the default 100% power limit, this extra power draw capacity can hardly be used in most applications, and for Battlefield 1 system consumption only ends up around 8W higher. But a power virus like FurMark has much less qualms about taking as much as it can, with the GTX 1070 Ti FTW2 immediately pulling a little extra, in the region of 30W at the wall.

Load Power Consumption - Battlefield 1

Load Power Consumption - FurMark

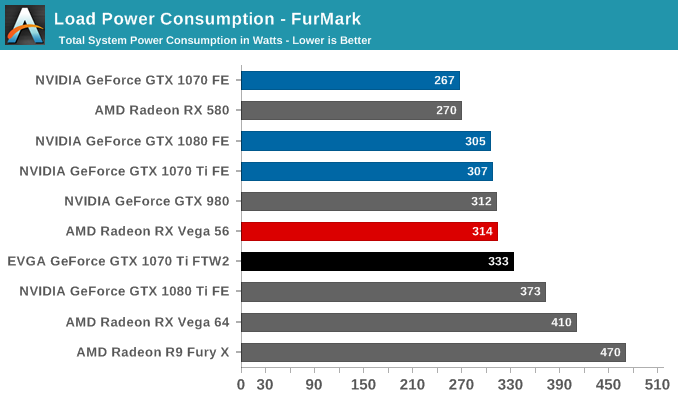
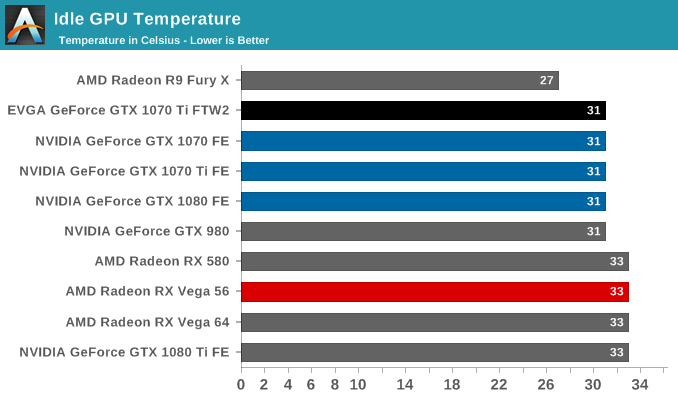
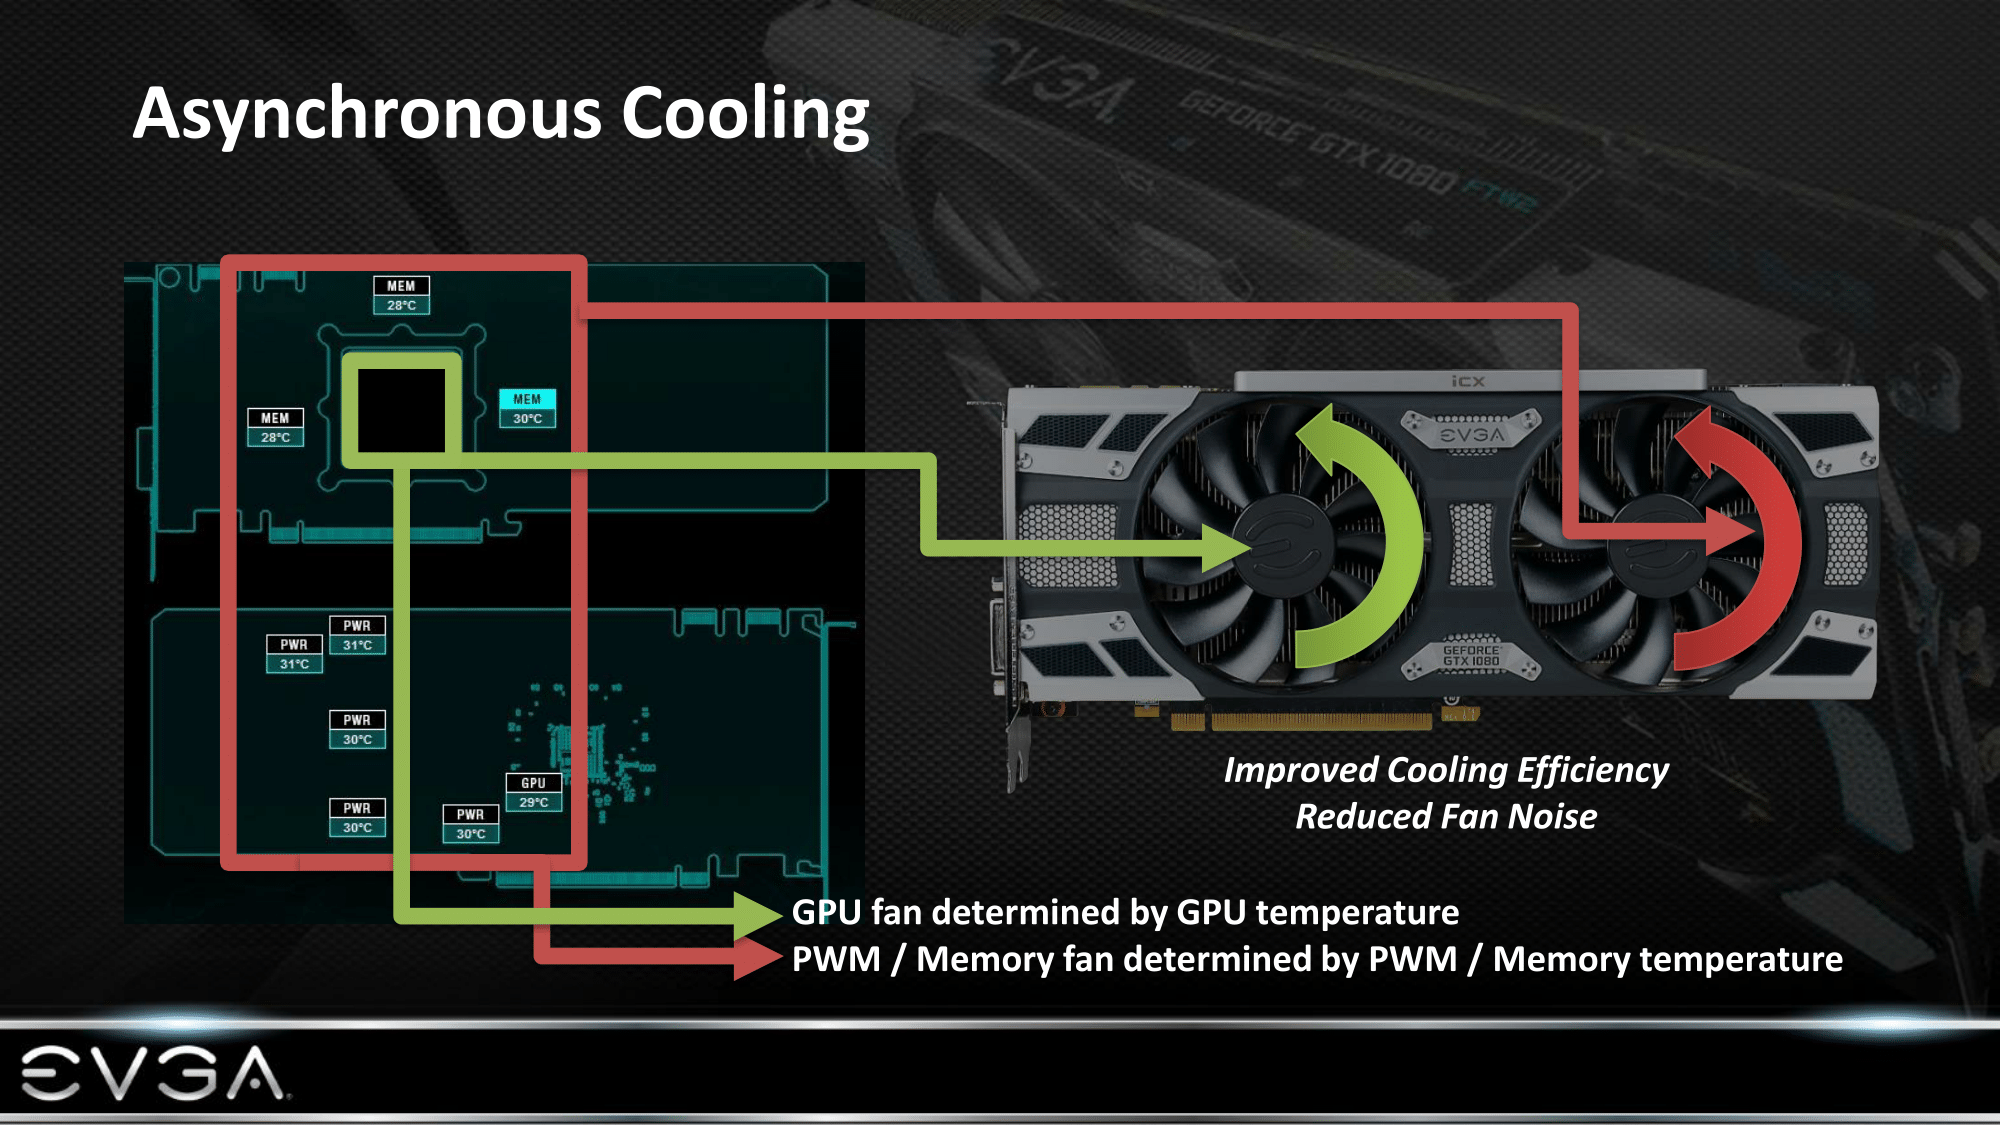
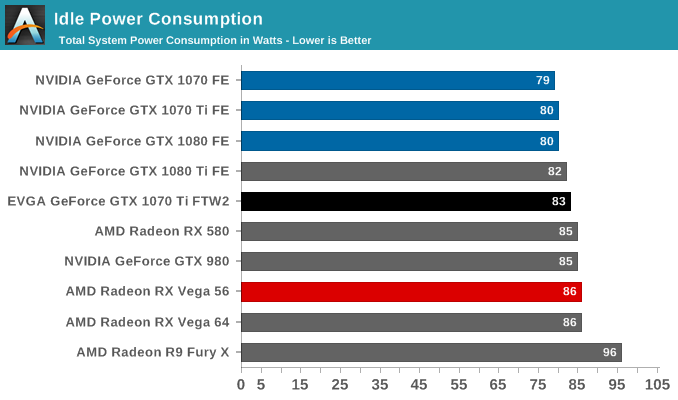
Like most high quality custom boards, the GTX 1070 Ti FTW2 can maintain a typical idling temperature with passive cooling. Under load, the fans kick in and the card settles just below its default 72 degree throttle point, even while running FurMark.

Idle GPU Temperature

Load GPU Temperature - Battlefield 1

Load GPU Temperature - FurMark


출처 - https://www.anandtech.com


List of Articles
제목 날짜 조회 수
마이크로소프트 서피스 프로4 CPU,GPU,낸드 성능 2015.10.30 167127
인텔 카비레이크 Core i7 7700K 리뷰 - 새로운 챔피언 2017.01.24 84827
인텔 옵테인 SSD 900p 480GB 리뷰 : Diving Deeper Into 3D XPoint 2017.12.25 75726
18개의 CPU 쿨러 벤치마크 1 2009.12.01 69126
세계 1위 게임, 배틀그라운드를 통한 인텔 vs AMD CPU 성능 비교 3 2017.12.30 58054
인텔 스카이레이크X 7900X, 7820X, 7800X, 카비레이크X 7740 테스트 2017.06.25 57467
[8086 40주년 기념판] The Intel Core i7-8086K Review 2018.06.11 56976
지포스 GTX295 & 285 벤치마크 2009.03.16 54462
AMD 라이젠3 1300X, 1200 vs. 인텔 i3 7100 / G4560 대결 2 2017.07.29 33907
라이젠 1800X+지포스GTX 1080TI 조합 vs 인텔 조합 게임 대결 2017.03.11 30322
태블릿 황제, 마이크로소프트 서피스 프로 공식 리뷰 8 2013.02.08 30114
하스웰 내장 그래픽 인텔 아이리스 프로 그래픽 5200 성능 (HD4600포함) 3 2013.06.02 28230
인텔 하스웰 펜티엄 G3430,G3420,G3220 성능 2013.09.17 24369
4890CF vs GTX 285 SLI 벤치마크 2 2009.04.24 23879
게이밍 환경에서 AMD 라이젠 vs. 인텔 CPU 성능 비교 6 2017.06.11 23163
AMD Radeon RX 550 2GB Review, Polaris 12 GPU 3 2017.05.01 22850
윈도우7 vs 윈도우 8.1 배틀필드4 성능 비교 벤치마크 2013.10.15 22364
인텔 베이트레일 성능 공식 리뷰, 태블릿도 인텔의 시대가 시작 5 2013.09.12 21277
AMD 잠베지 FX 6100, FX 4100의 성능은? 6 2011.12.16 21007
지포스 9800GT vs 지포스GTX 660의 성능 차이 (과거와 현재) 2012.09.24 20979
삼성 PM981 SSD 리뷰 : Next Generation Controller And 3D NAND 2017.12.25 20296
AMD 카비니 리뷰 : A4 5000 APU 테스트 2013.05.25 20146
충격과 공포의 샌디브릿지 성능 6 2011.01.03 19005
AMD 라데온RX 580 & RX 570 리뷰 : A Second Path to Polaris 6 2017.04.23 18337
Board Pagination Prev 1 2 3 4 5 6 7 8 9 10 ... 26 Next
/ 26