


![[All Around AI 1편] AI의 시작과 발전 과정, 미래 전망 by 인공지능](https://raptor-hw.net/xe/files/thumbnails/198/205/271x205.crop.jpg "[All Around AI 1편] AI의 시작과 발전 과정, 미래 전망<br>")


 ' alt='위대한 인류최대 수퍼로켓 '스타십(Spacex Starship)' 발사 성공 by 인공지능' />


<br>")
, 전세계 일자리 파괴 가속화 “육체노동만 살아남나?”<br>")


<br>")


’ 오픈<br>")
![삼성, 잃어버린 10년 [풀영상] | 창 458회 (KBS 24.03.12) by 인공지능](https://raptor-hw.net/xe/files/thumbnails/453/204/271x205.crop.jpg "삼성, 잃어버린 10년 [풀영상] | 창 458회 (KBS 24.03.12)<br>")


 다운로드 및 설치<br>")


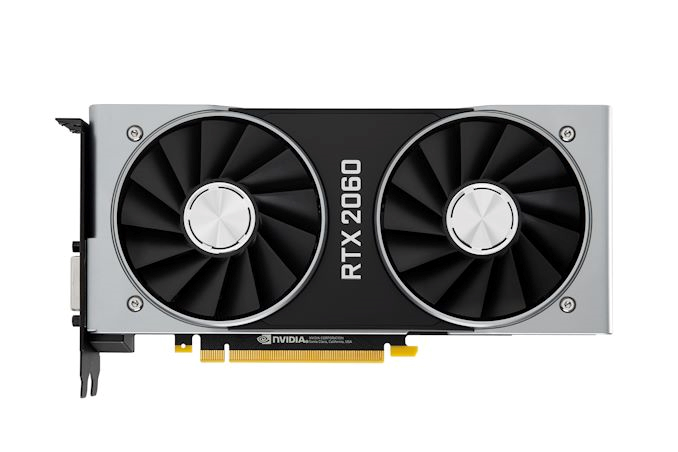
엔비디아의 차세대 "튜링 아키텍처" 적용, RTX 2080TI - 2080 - 2070에 이은 RTX 2060 파운더스 에디션 리뷰
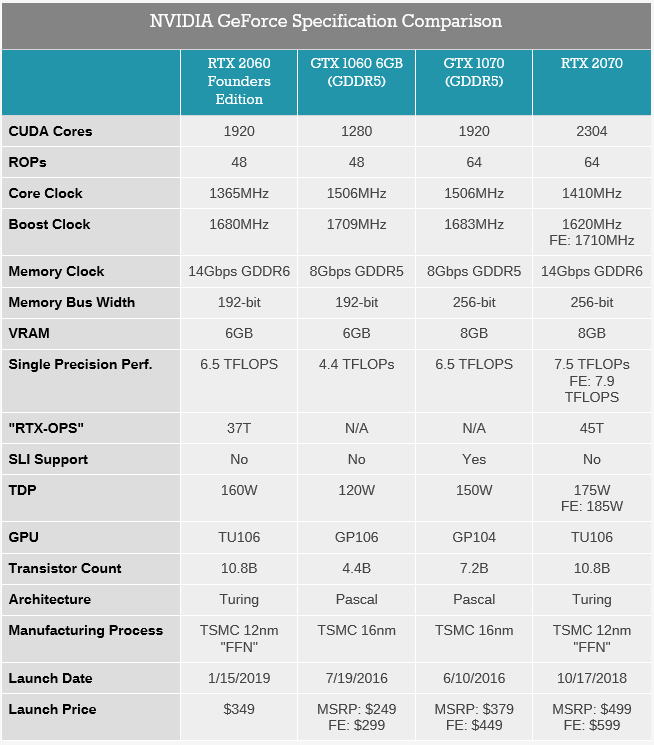
RTX 2060은 1920 쿠다코어, 48ROPs, 베이스 클럭 1365MHz, 부스트 클럭 1680MHz, 메모리 클럭은 GDDR6 14Gbps, 192비트 메모리 인터페이스, 6GB 메모리 용량, 싱글 프리시전 성능 6.5테라플롭스, RTX-OPS 37T, TDP 160와트, 트랜지스터 카운트 10.8B, TSMC 12나노 공정 적용, 가격은 349달러
%20Founders%20Edition%20-%20The%20NVIDIA%20GeForce%20RTX%202060%206GB%20Founders%20Edition%20Review%3A%20Not%20Quite%20Mainstream&txt=%3Cimg%20alt%3D%22%22%20src%3D%22https%3A%2F%2Fimages.anandtech.com%2Fdoci%2F13762%2FGeForce_RTX_2060_3QTR_Front_Right_1546621157_575px.jpg%22%3E)
%20Founders%20Edition%20-%20The%20NVIDIA%20GeForce%20RTX%202060%206GB%20Founders%20Edition%20Review%3A%20Not%20Quite%20Mainstream&txt=%3Cimg%20alt%3D%22%22%20src%3D%22https%3A%2F%2Fimages.anandtech.com%2Fdoci%2F13762%2FGeForce_RTX_2060_Bracket_1546621177_575px.jpg%22%3E)
테스트 시스템
| CPU: | Intel Core i7-7820X @ 4.3GHz |
| Motherboard: | Gigabyte X299 AORUS Gaming 7 (F9g) |
| Power Supply: | EVGA 1000 G3 |
| Hard Disk: | OCZ Toshiba RD400 (1TB) |
| Memory: | G.Skill TridentZ DDR4-3200 4 x 8GB (16-18-18-38) |
| Case: | NZXT Phantom 630 Windowed Edition |
| Monitor: | LG 27UD68P-B |
| Video Cards: | AMD Radeon RX Vega 64 (Air Cooled) AMD Radeon RX Vega 56 AMD Radeon RX 590 AMD Radeon RX 580 AMD Radeon R9 390 NVIDIA GeForce RTX 2080 NVIDIA GeForce RTX 2070 NVIDIA GeForce RTX 2060 (6GB) Founders Edition NVIDIA GeForce GTX 1080 Founders Edition NVIDIA GeForce GTX 1070 Ti Founders Edition NVIDIA GeForce GTX 1070 Founders Edition NVIDIA GeForce GTX 1060 6GB Founders Edition |
| Video Drivers: | NVIDIA Release 417.54 (Press) AMD Radeon Software Adrenalin 2019 Edition 18.12.3 |
| OS: | Windows 10 Pro (1803) |
| Spectre/Meltdown Mitigations | Yes (both) |
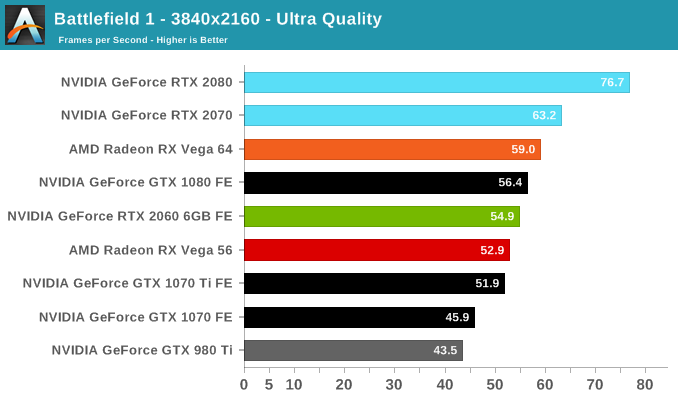
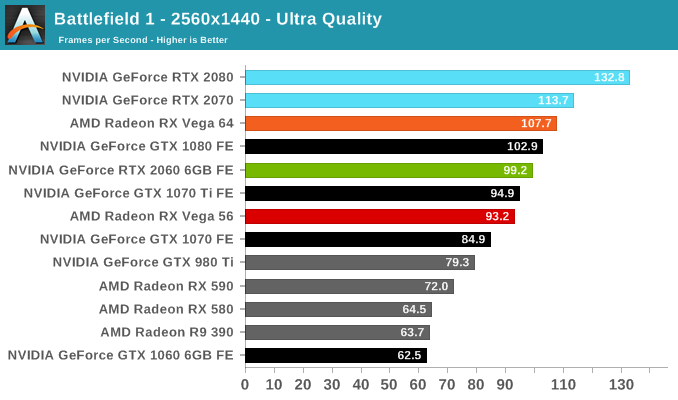
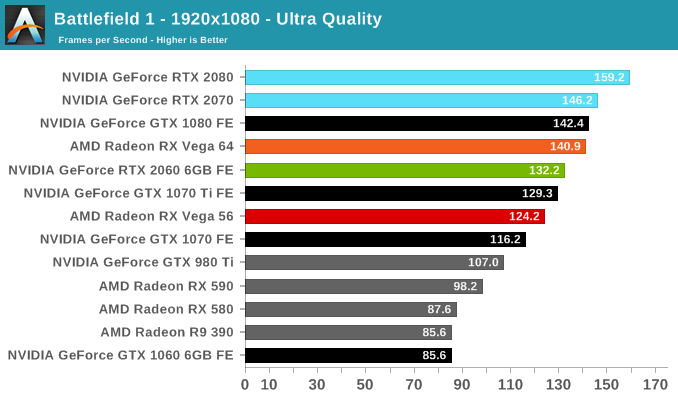
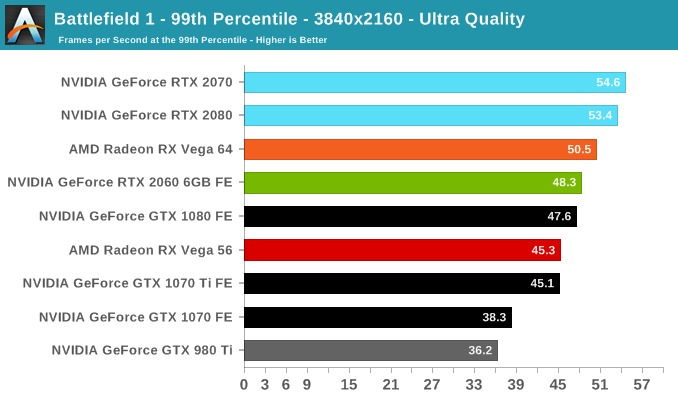
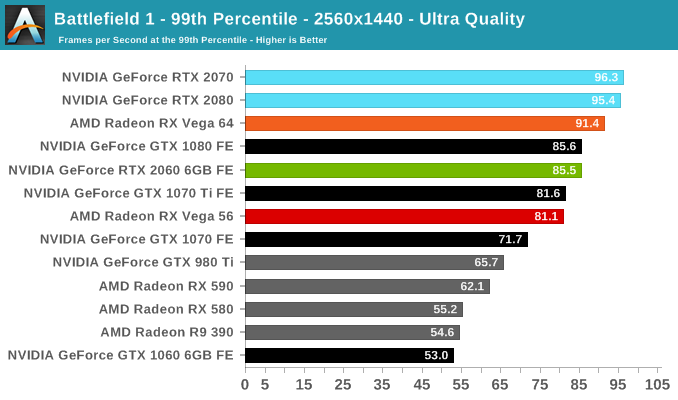
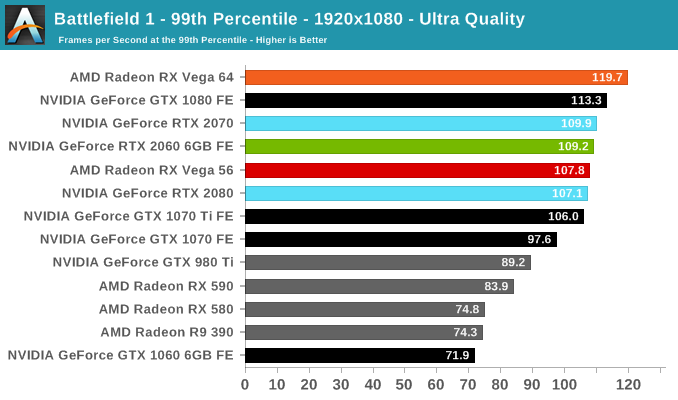
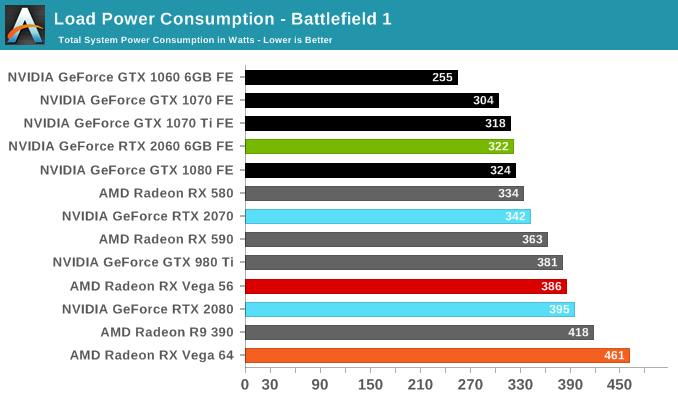
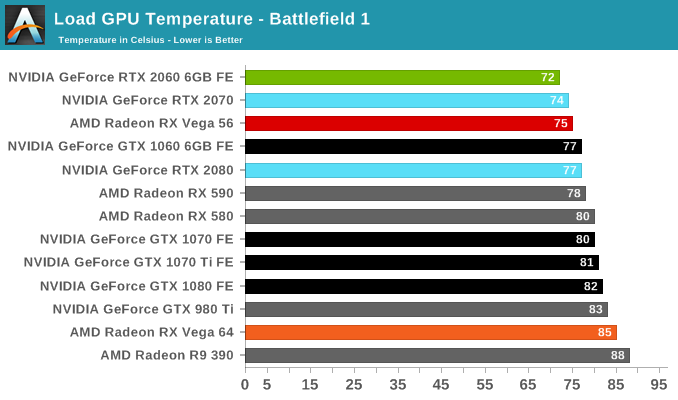
Battlefield 1 has made the rounds for some time, and after the optimizations over the years both manufacturers generally enjoy solid performance across the board. The RTX 2060 (6GB) is no exception and fares well, splitting the difference between the GTX 1070 Ti and GTX 1080. This also means it opens a lead on the RX Vega 56.
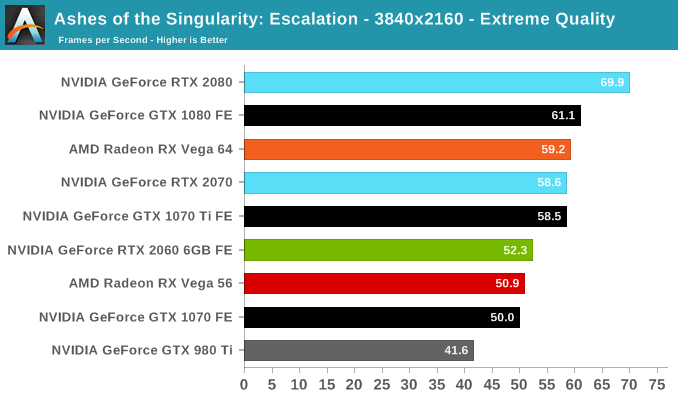
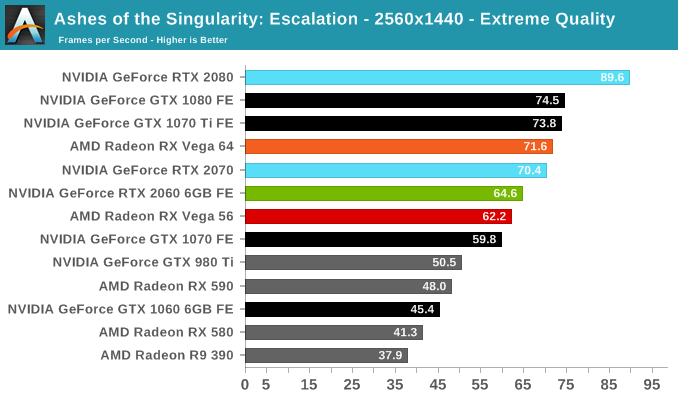

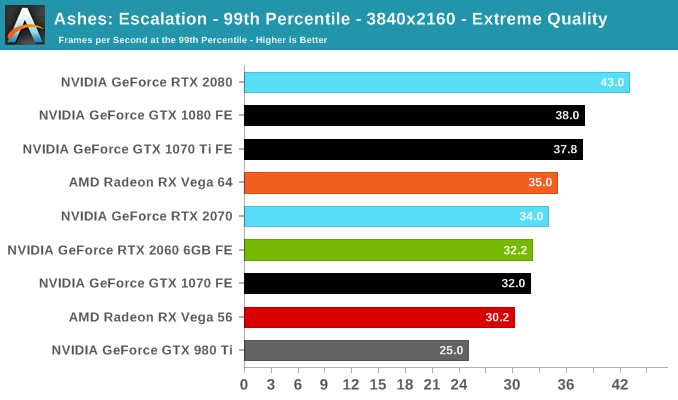
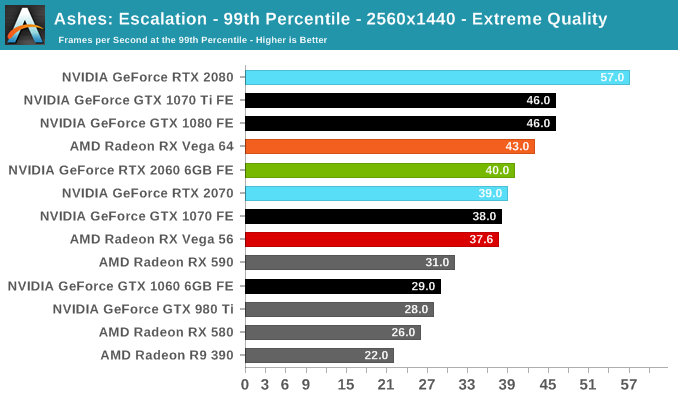
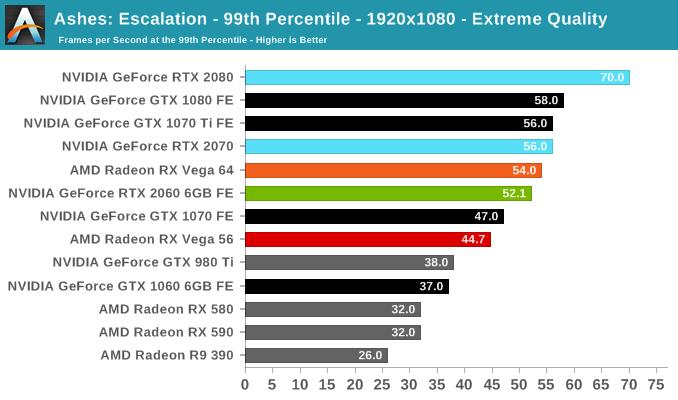
Somewhat surprisingly, the RTX 2060 (6GB) performs poorly in Ashes, closer to the GTX 1070 than the GTX 1070 Ti. Although it is still ahead of the RX Vega 56, it's not an ideal situation, where the lead over the GTX 1060 6GB is cut to around 40%.
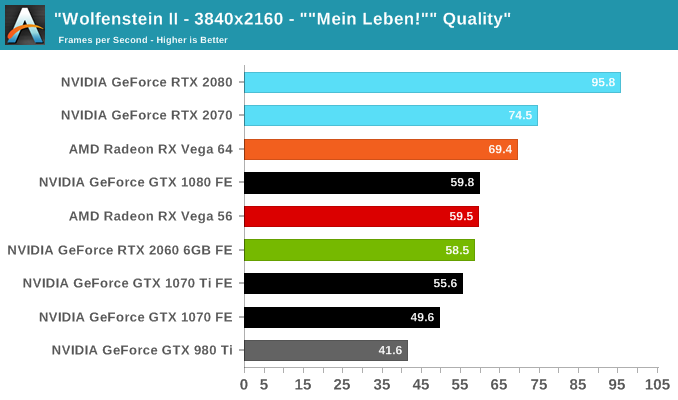
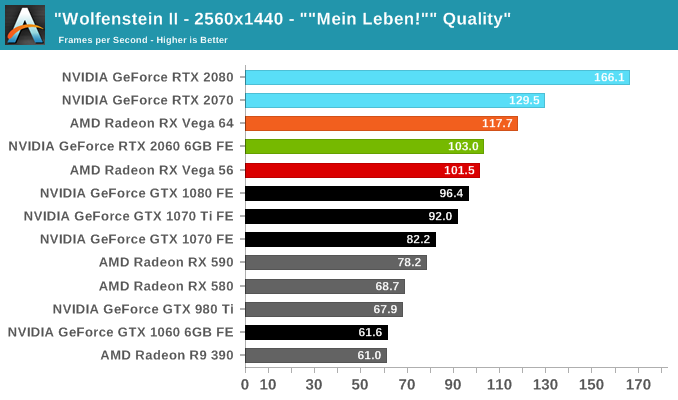
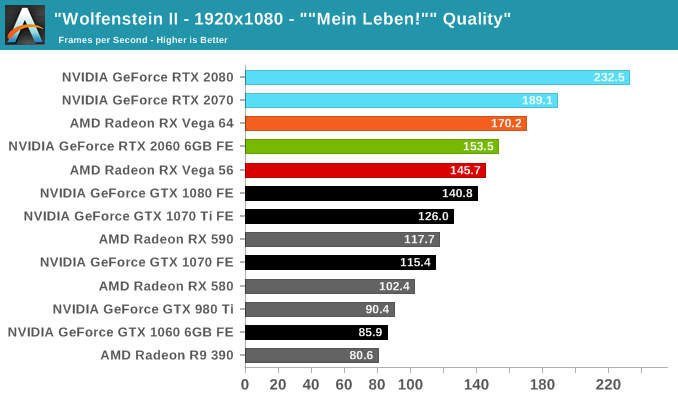
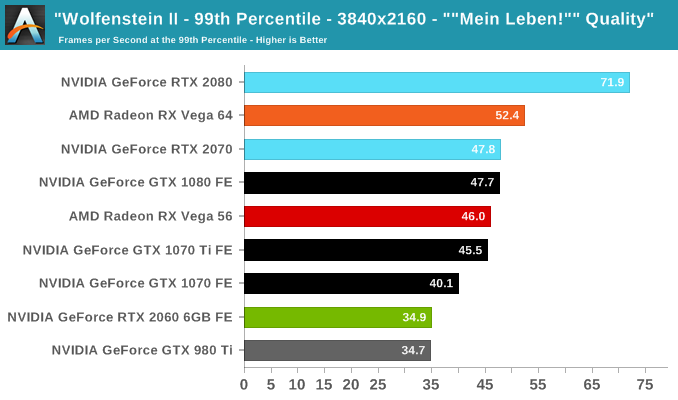
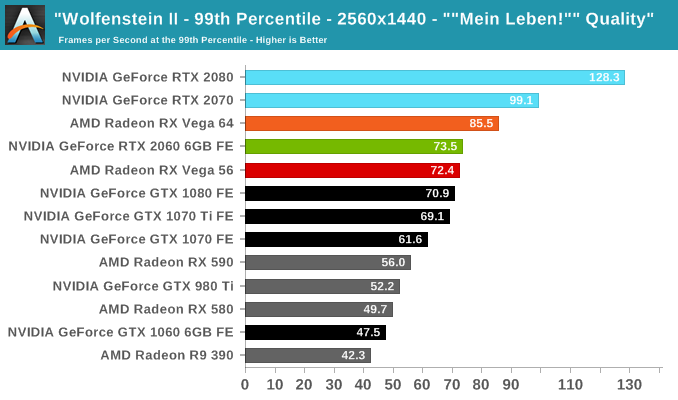
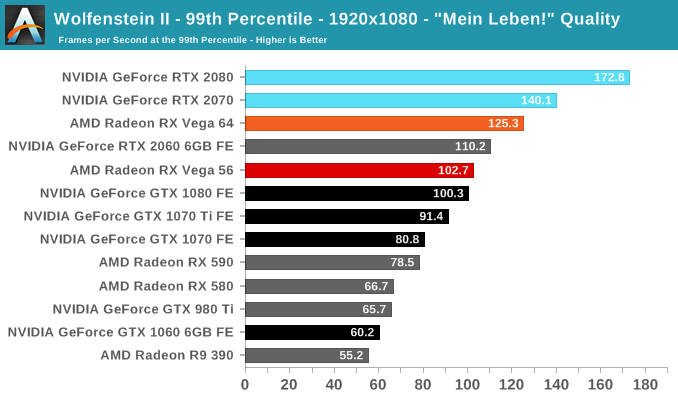
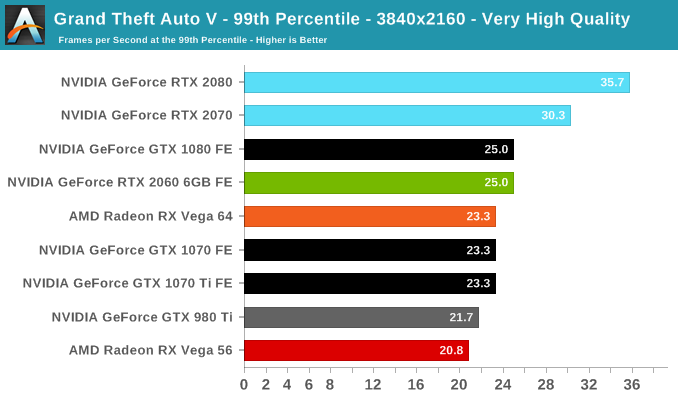
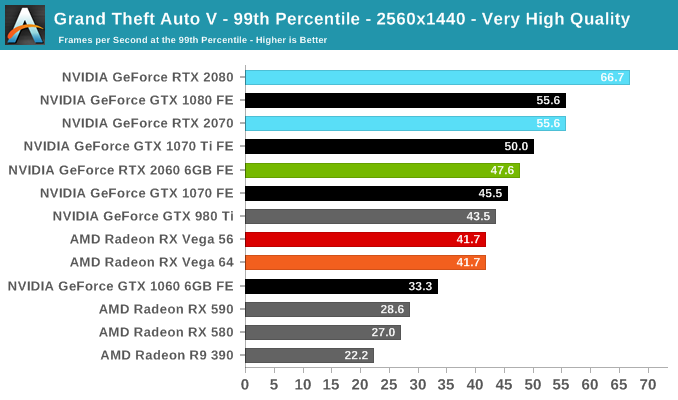
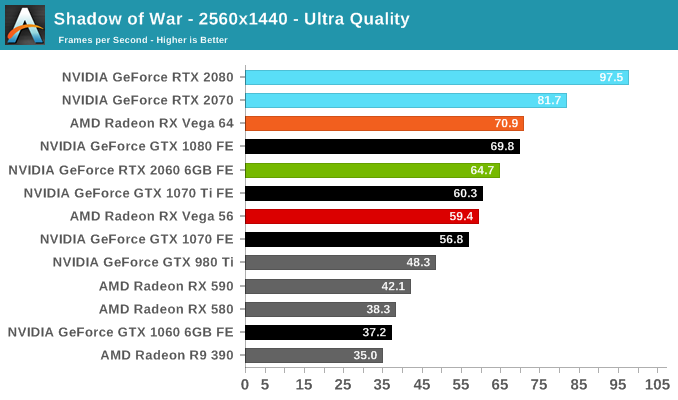
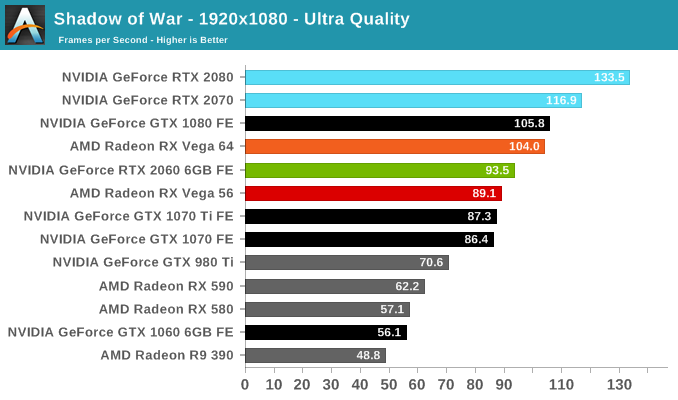
In summary, Wolfenstein II tends to scales well, enables high framerates with minimal CPU bottleneck, enjoys running on modern GPU architectures, and consumes VRAM like nothing else. For the Turing-based RTX 2060 (6GB), this results in outpacing the GTX 1080 as well as RX Vega 56 at 1080p/1440p. The 4K results can be deceiving; looking closer at 99th percentile framerates shows a much steeper dropoff, more likely than not to be related to the limitations of the 6GB framebuffer. We've already seen the GTX 980 and 970 struggle at even 1080p, chained by 4GB video memory.
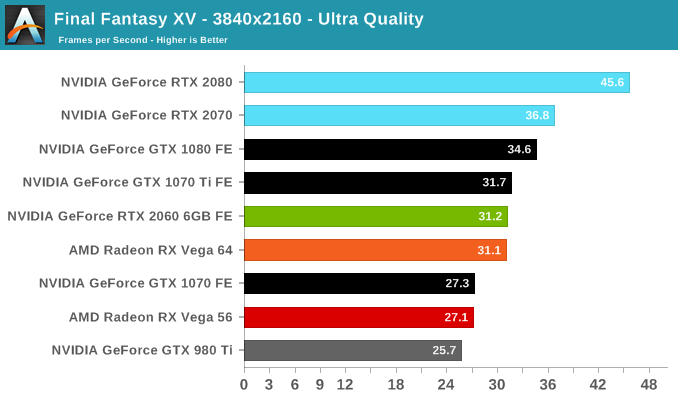
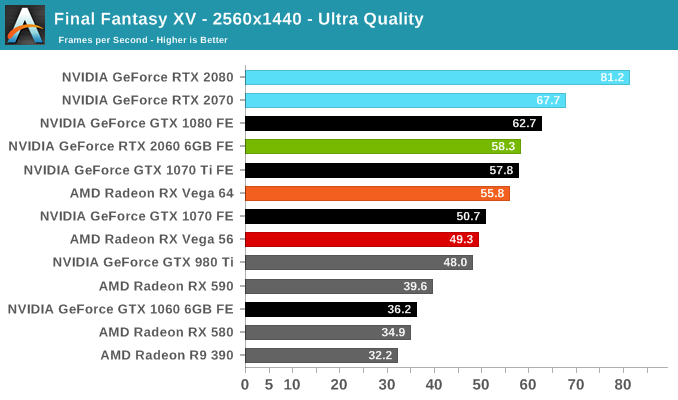
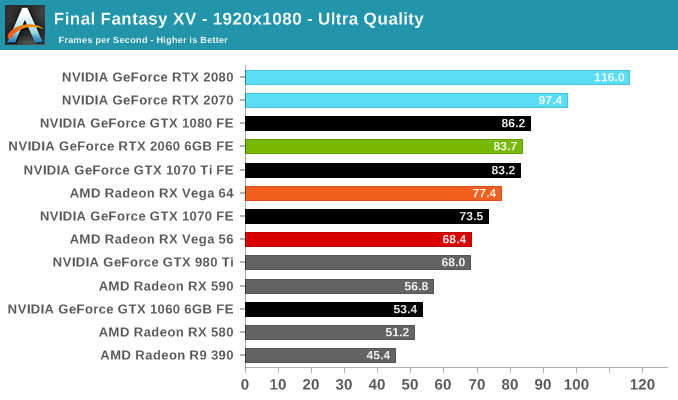
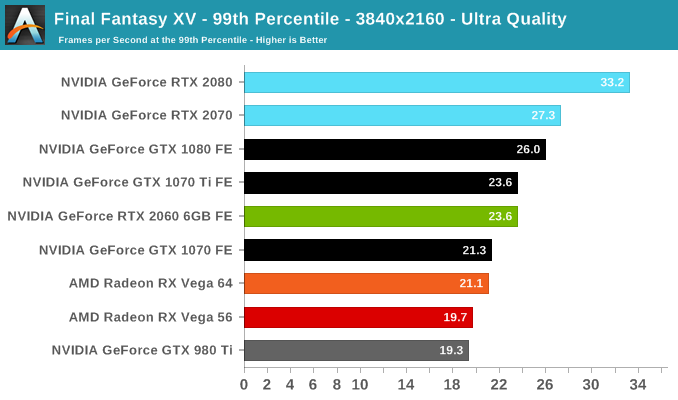
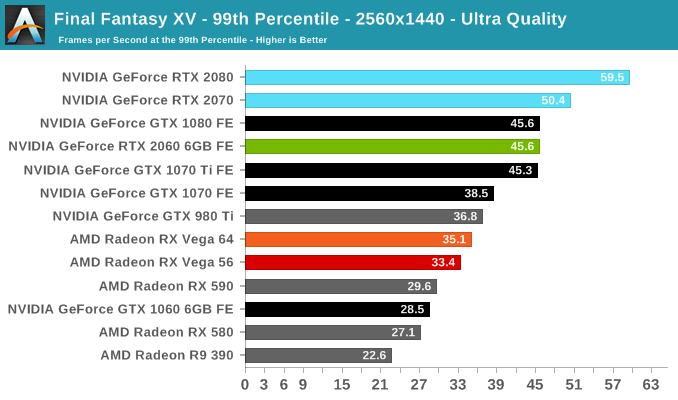
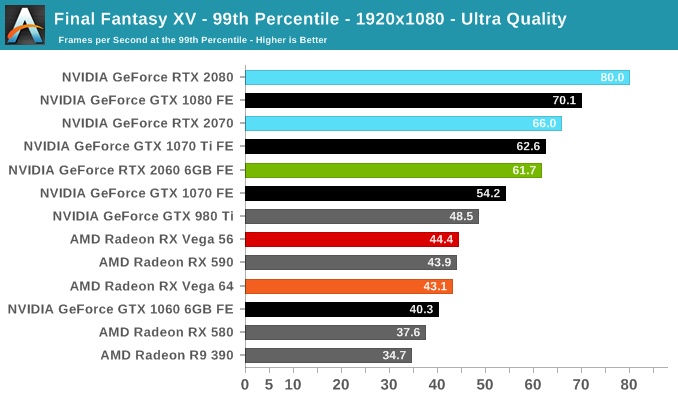
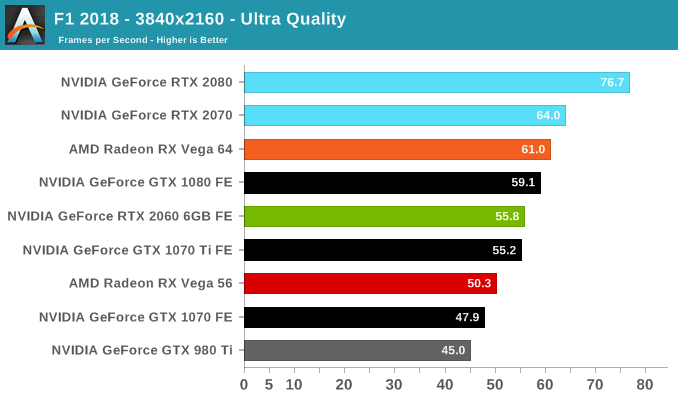
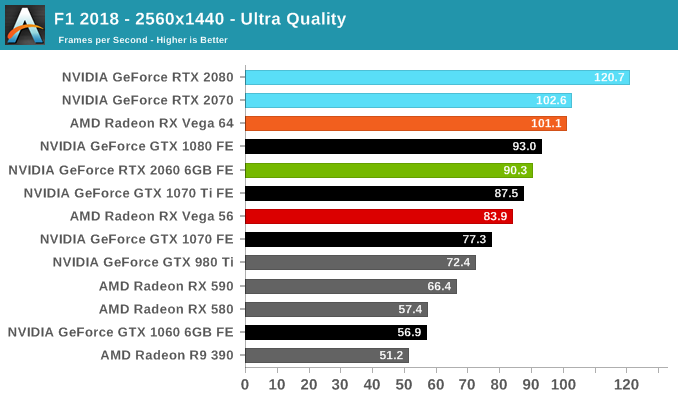
At 1080p and 1440p, the RTX 2060 (6GB) returns to its place between the GTX 1080 and GTX 1070 Ti. Final Fantasy is less favorable to the Vega cards so the RTX 2060 (6GB) is already faster than the RX Vega 64. With the relative drop in 4K performance, there are more hints of 6GB being potentially insufficient.
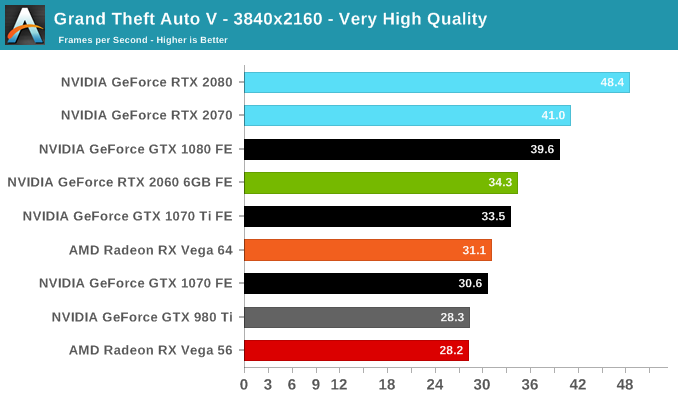
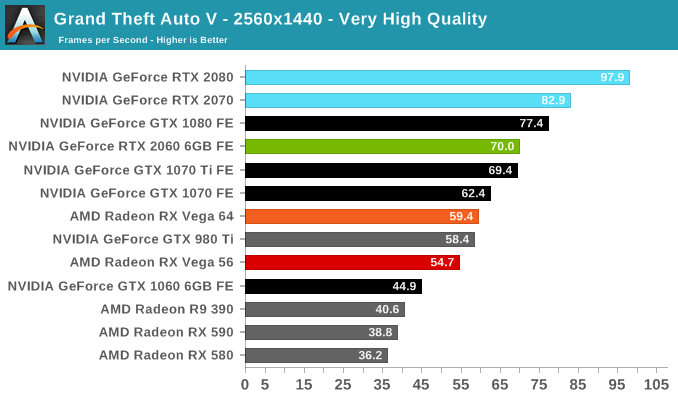
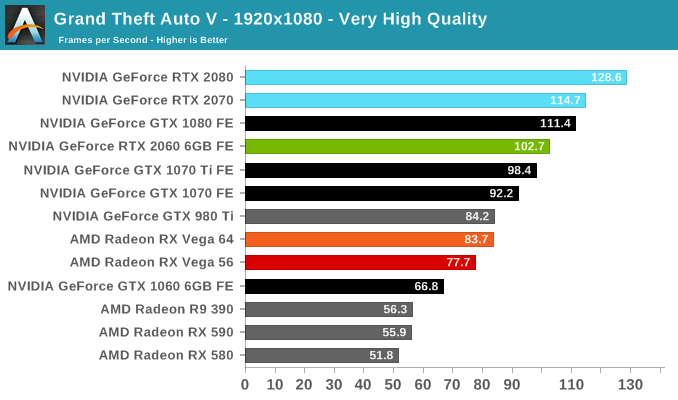
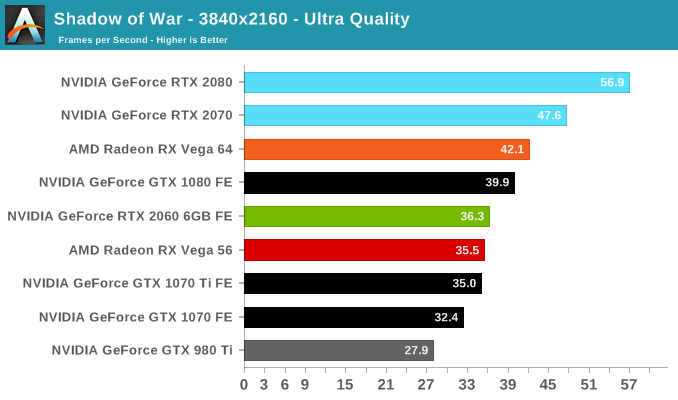
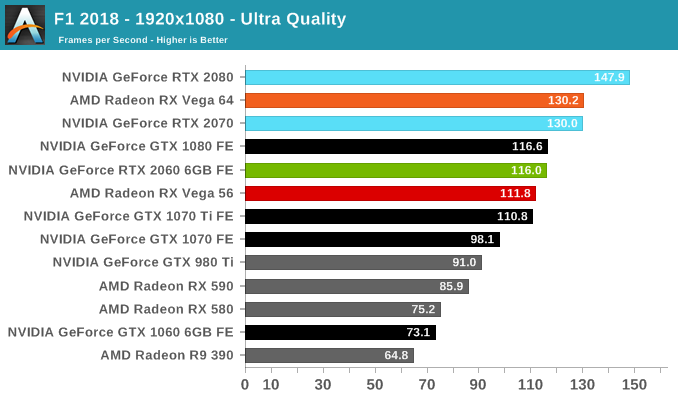
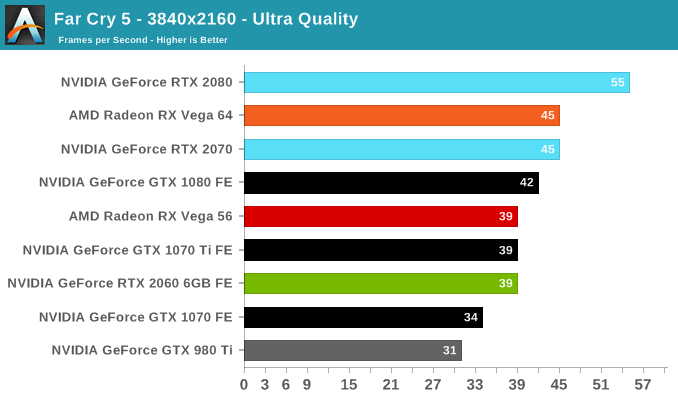
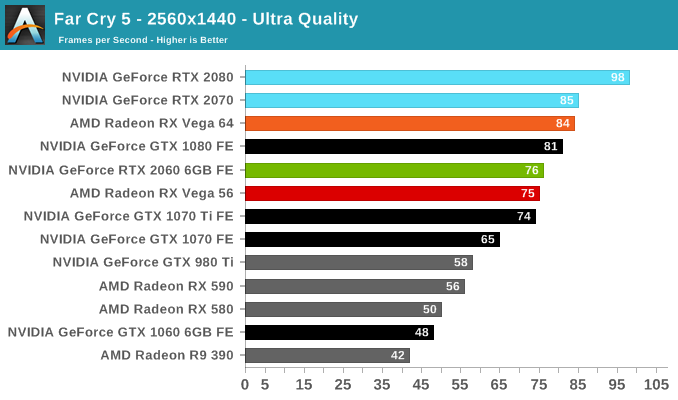
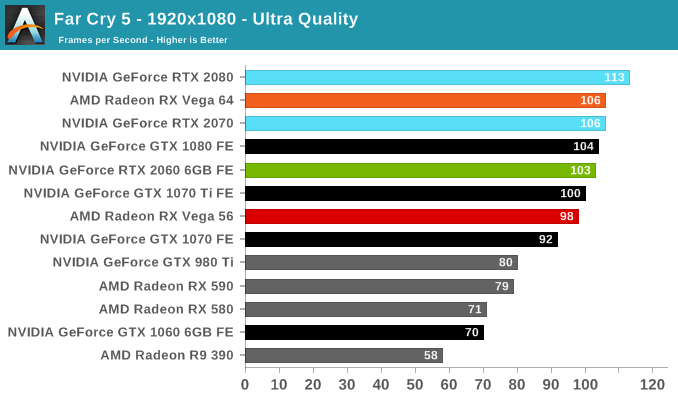
NVIDIA hardware tend to do well here, and for all intents and purposes the RTX 2060 (6GB) FE is equivalent to the GTX 1070 Ti FE in performance. Which means that the RTX 2060 is essentially on the level of the RX Vega 64, an ideal position for it to be in.
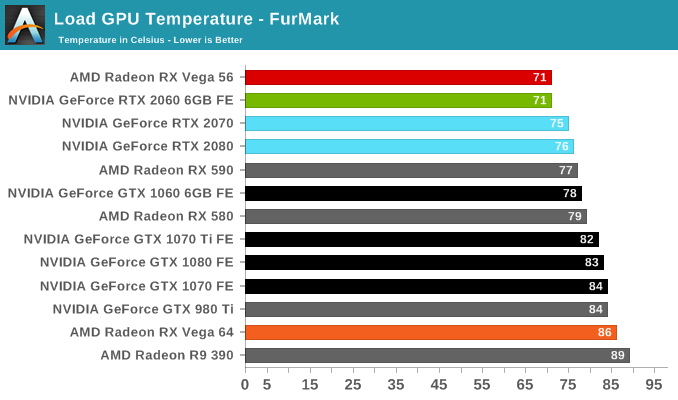
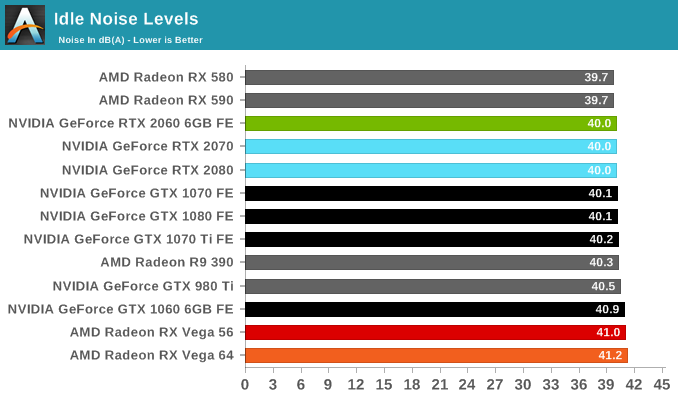
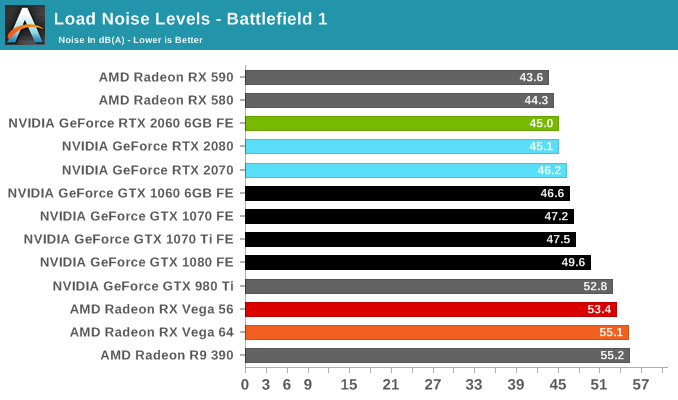
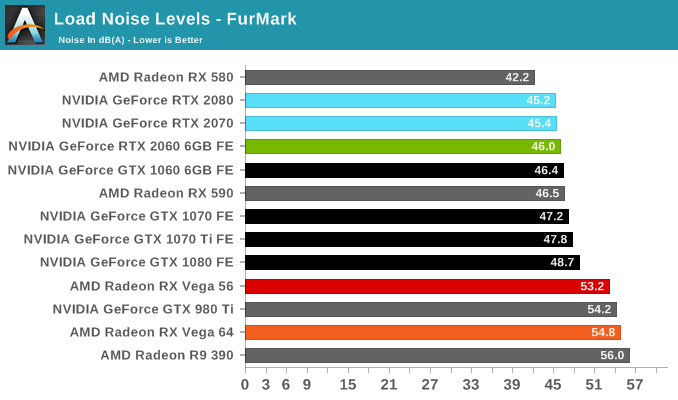
Temperature & Noise
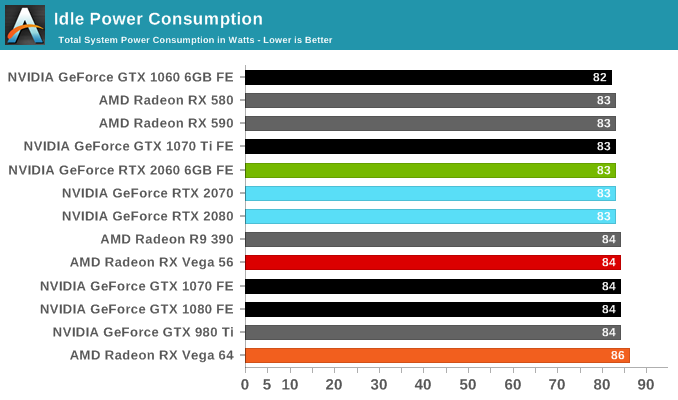
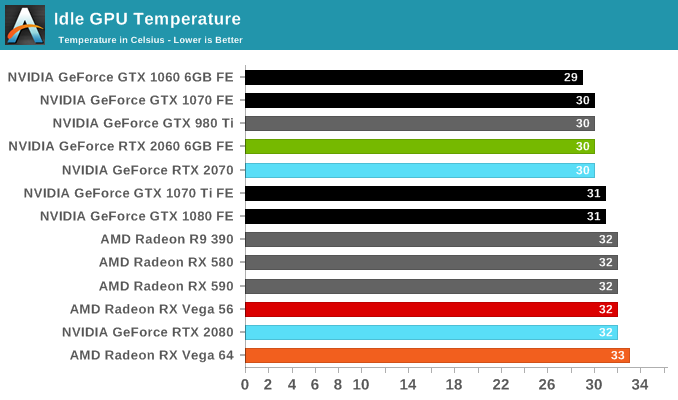
With an open air cooler design with dual axial fans, the results are in line with what we've seen with the other RTX Founders Editions.
출처 - https://www.anandtech.com
엔비디아 지포스RTX 2060은 1080보다 약간 떨어지는 1070TI ~ 1080급 성능