


 ' alt='위대한 인류최대 수퍼로켓 '스타십(Spacex Starship)' 발사 성공 by 인공지능' />


<br>")


’ 오픈<br>")

, 전세계 일자리 파괴 가속화 “육체노동만 살아남나?”<br>")

<br>")
 다운로드 및 설치<br>")


![삼성, 잃어버린 10년 [풀영상] | 창 458회 (KBS 24.03.12) by 인공지능](https://raptor-hw.net/xe/files/thumbnails/453/204/271x205.crop.jpg "삼성, 잃어버린 10년 [풀영상] | 창 458회 (KBS 24.03.12)<br>")


[ 테스트 시스템 ]
- Mainboard: ASUS P6T Deluxe (Intel X58 Express), LGA 1366, BIOS 1102
- CPU: Intel Core i7-920, 2.67 GHz, 1.25 V, L2 4 x 256 KB, L3 8 MB (Bloomfield, C0)
- CPU cooler: Thermalright Ultra-120 eXtreme-1366RT (2 Thermalright TR-FDB fans at 1030 RPM)
- Thermal interface: Gelid GC1
- System memory: DDR3 3 x 1 GB Corsair DOMINATOR TWIN3X2048-1800C7DFIN (Spec: 1800 MHz / 7-7-7-20 / 2.0 V)
- Graphics cards:
- HIS Radeon HD 4870 IceQ 4+ Turbo 770/4000 MHz, 1024 MB;
- XFX Radeon HD 4870 XXX 775/3800 MHz, 1024 MB;
- ZOTAC GeForce GTX 260 AMP2! Edition 648/1404/2106 MHz, 896 MB;
- XFX GeForce GTX 260 Black Edition 666/1404/2300 MHz, 896 MB;
- HIS Radeon HD 4870 IceQ 4+ Turbo 770/4000 MHz, 1024 MB;
- Disk subsystem: Western Digital VelociRaptor (300GB, SATA-II, 10000 RPM, 16MB cache, NCQ)
- HDD silencer and cooler: Scythe Quiet Drive for 3.5-inch HDD
- Optical drive: Samsung SH-S183L DVD-burner (SATA-II)
- System case: ASUS ASCOT 6AR2-B Black&Silver (with 120mm 840 RPM Scythe Slip Stream system fans for intake and exhaust installed on silicon spindles and Enermax Magma fan at 900 RPM on the side panel)
- Control and monitoring panel: Zalman ZM-MFC2
- Power supply: Thermaltake Toughpower (W0218, 1500W, 140mm fan)
- Monitor: 24-inch BenQ FP241W (1920x1200@60Hz)
Performance
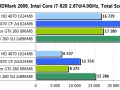
3DMark 2006


The CrossFireX and SLI configurations deliver about the same performance growth in 3DMark06 relative to the respective single cards. Nvidia’s GPUs look preferable to their opponents only when full-screen antialiasing and anisotropic filtering are turned on.
3DMark Vantage
3DMark Vantage refused to output the overall scores at 1280x960, so I will give you the GPU test data and the full results in the Extreme test mode.


There are no significant differences here, either, but the GeForce GTX 260 is somewhat faster than its opponent in both single and SLI mode. I did not see the image defects I had spotted with the Radeon HD 4830 CrossFireX subsystem earlier.
Unigine Tropics Demo

CrossFireX is trying to do something in this test whereas SLI has no effect on the graphics subsystem’s performance. The Unigine Tropics engine seems to be not optimized for multi-GPU configurations.
World in Conflict

The GeForce GTX 260 tandem shows better scalability in World in Conflict. Save for the results obtained at 1280x960 with FSAA and AF, the single GeForce GTX 260 is as fast as the single Radeon HD 4870, but Nvidia’s SLI solution is ahead of ATI’s CrossFireX one. I have no complaints about the visual quality and performance provided by the tested configurations.
Enemy Territory: Quake Wars

It is in Enemy Territory: Quake Wars that we can see the first surprise. Take note of the 1920x1200 results: the SLI pair of two GeForce GTX 260 cards doesn’t work correctly because it is slower not only than the CrossFireX tandem of two Radeon HD 4870 but even than the single such Radeon! There must be some bug in the GeForce driver that shows up at that resolution only. Otherwise, I can’t explain the good performance growth at 1280x960 and the fiasco at 1920x1200. So, this test is won by ATI.
Call of Duty 4: Modern Warfare MP

The cards have almost the same frame rates and show the same performance growth in CrossFireX and SLI modes in this game.
Unreal Tournament 3

Nvidia’s GPUs are victorious in Unreal Tournament 3. The GeForce GTX 260 shows a higher performance growth in the multi-GPU configuration at the low-quality settings whereas the Radeon HD 4870 tandem has better scalability when FSAA and anisotropic filtering are in use.
Devil May Cry 4

I guess the test results in this game are most exciting. Why? Take note that the single Radeon HD 4870 is inferior to the single GeForce GTX 260 in three out of the four test modes but shows better scalability in the CrossFireX tandem, outperforming the competing GeForce SLI subsystem. The higher the load, the larger the advantage of the CrossFireX configuration is.
S.T.A.L.K.E.R.: Clear Sky

S.T.A.L.K.E.R.: Clear Sky produces interesting data, too. Both multi-GPU configurations ensure an excellent growth of performance, the ATI Radeon HD 4870 being in the lead. I want to remind you that you have to restart the rendering engine through the game’s console in order to enable CrossFireX mode in this game. You don’t have to do that with GeForce cards.
Crysis WARHEAD

The opponents are absolutely worth each other in this test.
Far Cry 2

The cards show nearly identical scalability in Far Cry 2, too. However, there were occasional but uncomfortable slowdowns on the Radeon HD 4870 in both single and SLI modes. The GeForce GTX 260 was free from that problem.
X3: Terran Conflict

The GeForce GTX 260 cards did not work in SLI mode in the benchmark from X3: Terran Conflict. ATI’s solution is superior as the result. Besides, the game is very CPU-dependent because the average frame rate is limited by the speed of the testbed (which is itself quite advanced) in easy test modes. When we switch to the higher resolution or higher image quality settings, the performance growth achieved on the CrossFireX configuration increases from 3.2% to 38%. There are no problems in terms of image quality or playability with any card or multi-GPU configuration in this game.
Left 4 Dead

SLI does not work in Left 4 Dead, either. The Radeon HD 4870 CrossFireX subsystem, on the contrary, boasts superb scalability, adding from 10 to 76% to the average frame rate depending on the image quality settings.
Lost Planet: Colonies

The GeForce GTX 260 cards beat their opponents in both single and SLI modes in the two tests of Lost Planet: Colonies. The performance growth was nearly maximum, somewhat higher than 100% even, and these results were repeatable.
Cryostasis: Sleep of Reason

This is one more game where Nvidia’s solutions are superior. You can see the GeForce GTX 260 beating its opponent in single mode and delivering a higher performance growth in multi-GPU mode. By the way, the performance growth in SLI mode is over 100% again. Besides, the GeForce cards are preferable because the game is jerky on the Radeons (perhaps due to the lack of hardware physics acceleration). SLI mode is not disabled in this game when you change the display resolution as is the case with CrossFireX.
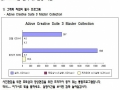
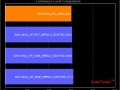
Performance Summary Diagrams
The summary diagrams show the performance growth achieved in CrossFireX and SLI modes relative to the respective single cards (whose performance is assumed to be 0%). Let’s check out the synthetic benchmarks first.


I can see no reason to prefer CrossFireX or SLI according to the synthetic benchmarks. The Radeon HD 4870 cards show better scalability at the low resolution of 3DMark06 but the GeForce GTX 260 tandem has the same performance growth as ATI’s solution at 1920x1200. ATI is superior in the Unigine Tropics test while the SLI configuration has a negative performance growth at the high resolution. However, multi-GPU technologies are both inefficient there, so we can just disregard this test altogether.
And here are the summary diagrams for the games:


The Radeon HD 4870 CrossFireX configuration seems to be better overall. ATI’s solution sports higher scalability in Devil May Cry 4, at the high resolution of Enemy Territory: Quake Wars, and in X3: Terran Conflict and Left 4 Dead where SLI technology didn’t work at all. The SLI configuration built out of two GeForce GTX 260 (216SP) cards proved to be more efficient in World in Conflict, Lost Planet: Colonies and Cryostasis: Sleep of Reason.
Power Consumption
I performed the power consumption test with a multifunctional Zalman ZM-MFC2 panel. This panel measures the overall power draw of the computer (without the monitor) rather than of a single component. There were two test modes: 2D (Microsoft Word and Web surfing) and 3D (a triple run of a demo from S.T.AL.K.E.R.:Clear Sky at 1920x1200 without FSAA but with 16x anisotropic filtering).
Like in the previous tests, the cards worked at their default frequencies: 750/3600 (500/3600) MHz for the Radeon HD 4870 and 575/1242/1998 (300/600/200) MHz for the GeForce GTX 260. Here are the results:

Judging by these data, the power consumption of systems with single Radeon HD 4870 and GeForce GTX 260 cards and with CrossFireX and SLI configurations based on them differs but little. Considering the PSU’s efficiency (about 84%), the system with the GeForces requires about 14W and 20W less than the system with the Radeon HD 4870 cards in 2D and 3D mode, respectively. It is also possible to estimate the peak power consumption of the single cards: the Radeon HD 4870 consumes about 153 while the GeForce GTX 260 (216SP) about 140W.
자료만 보고 결과적으로 보자면 전체적으로 대동소이하며 일부 멀티 gpu에 최적화된 게임에서, 특히 고해상도에서의 크파효율이 높은 점을 볼수 있다.