4월 28일 (일) 오전 4:51
랩터 인터내셔널에 오신걸 환영 합니다
>

logo

  • head
  • news
  • product
  • mobile
  • benchmark
  • analysis
  • computing
  • multimedia

"SAN"은 "Storage Area Network"...
웹 애플리케이션에서의 버퍼 오버...
XSS(크로스 사이트 스크립팅) 취...
조회 수 8469


라데온 4890 크로스 파이어가 지포스 285 SLI 구성보다 50와트정도 적게 소모


ㅡ 테스트 시스템


Testbed and Methods


We are going to investigate the performance of GeForce GTX 285 SLI and Radeon HD 4890 CrossFireX tandems in contemporary games using the following testbed:


  • Intel Core i7-965 Extreme Edition processor (3.2GHz, 6.4 GT/s QPI);  
  • Asus P6T Deluxe mainboard (Intel X58 Express chipset);
  • Corsair XMS3-12800C9 (3x2GB, 1333MHz, 9-9-9-24, 2T);
  • Maxtor MaXLine III 7B250S0 HDD (250GB, Serial ATA-150, 16MB buffer);
  • Enermax Galaxy DXX EGX1000EWL 1000W power supply;
  • Dell 3007WFP monitor (30", 2560x1600@60Hz max display resolution);
  • Microsoft Windows Vista Ultimate SP1 64-bit;
  • ATI Catalyst 9.4 for ATI Radeon HD;
  • Nvidia GeForce 182.50 WHQL for Nvidia GeForce.

The graphics card drivers were configured in the same way as before: to provide the highest possible quality of texture filtering and to minimize the effect of default software optimizations. As a result, our ATI catalyst and Nvidia GeForce driver settings looked as follows:


Nvidia GeForce:


  • Texture filtering – Quality: High quality
  • Texture filtering – Trilinear optimization: Off
  • Texture filtering – Anisotropic sample optimization: Off
  • Vertical sync: Force off
  • Antialiasing - Gamma correction: On
  • Antialiasing - Transparency: Multisampling
  • Multi-display mixed-GPU acceleration: Multiple display performance mode
  • Set PhysX GPU acceleration: Enabled
  • Other settings: default

ATI Catalyst:


  • Smoothvision HD: Anti-Aliasing: Use application settings/Box Filter
  • Catalyst A.I.: Standard
  • Mipmap Detail Level: High Quality
  • Wait for vertical refresh: Always Off
  • Enable Adaptive Anti-Aliasing: On/Quality
  • Other settings: default

The list of benchmarks includes the following gaming titles and synthetic tests:


First-Person 3D Shooters


  • Call of Duty: World at War
  • Crysis Warhead
  • Enemy Territory: Quake Wars
  • Far Cry 2
  • F.E.A.R 2: Project Origin
  • Left 4 Dead
  • S.T.A.L.K.E.R.: Clear Sky

Third-Person 3D Shooters


  • Devil May Cry 4
  • Prince of Persia

RPG


  • Fallout 3
  • Mass Effect

Simulators


  • Race Driver: GRID
  • Tom Clancy's H.A.W.X.

Strategies


  • Red Alert 3: Uprising
  • World in Conflict: Soviet Assault

Semi-synthetic Benchmarks


  • Futuremark 3DMark06
  • Futuremark 3DMark Vantage

Performance in First-Person 3D Shooters


Call of Duty: World at War


Starting from version 1.3 we use the game’s integrated benchmarking options together with a custom demo record. Unfortunately, this method does not report the bottom frame rate.


The two heavyweights engage into a hot fight right from the start. The GeForce GTX 285 SLI is 7 to 15% slower than its opponent at resolutions up to 2560x1600 pixels but wins the latter resolution by almost 8%. The multi-GPU subsystems both deliver excellent speed irrespective of the display mode.


But the highest speed in this game can be achieved on the Radeon HD 4870 3-way CrossFireX configuration which is, however, bulky, noisy, uneconomical, and not easy to use. When it comes to such consumer properties, the GeForce GTX 295 is the overall winner. It is not much slower than the leaders but is quiet, occupies only one PCIe x16 slot and does not require a mainboard with support for multi-GPU technologies.


Crysis Warhead


It is far more interesting to watch the titans fight in Crysis Warhead because they are trying to deliver a comfortable frame rate at resolutions above 1280x1024. The winner is the GeForce GTX 285 SLI whereas its opponent, having almost the same average performance at 1680x1050, cannot keep the bottom speed above 25fps.


Take note that the dual-processor Radeon HD 4890 CrossFireX is far more effective than the triple-processor Radeon HD 4870 3-way CrossFireX at every resolution. Judging by the results, the overhead for synchronizing the three GPUs has eaten all the performance growth. Perhaps the Catalyst driver is not optimized well for this game.


Enemy Territory: Quake Wars


We disabled the integrated frame rate limiter in the game console for the sake of comparing the cards. The game’s built-in benchmarking options do not provide information about the bottom speed, so there is no such info in the diagrams.


The GeForce GTX 285 SLI is in the lead at resolutions up to 1920x1200 inclusive, outperforming the Radeon HD 4890 CrossFireX by 2-9%. The gap is shrinking as the resolution grows up. ATI’s solution wins at 2560x1600 but all this winning has little practical wroth since the graphics subsystems are both fast enough for every display mode.


The Radeon HD 4870 3-way CrossFireX platform is again imperfect, taking first place at 2560x1600 only. It is a mere 11fps ahead of the GeForce GTX 295 while the average frame rates of both solutions are 100-115fps. Thus, the GTX 295 shows itself as the best single graphics card available today but we are expecting ATI partners’ answer in the way of Radeon HD 4890 X2


Far Cry 2


Nvidia enjoys an all-around triumph with its GeForce GTX 285 SLI tandem outperforming the Radeon HD 4890 CrossFireX by 12-29%. However, the bottom speed of both platforms was comparable at resolutions up to 2560x1600 and both were equals in terms of gamer’s comfort. ATI’s solution maintains a bottom speed of over 25fps at 2560x1600 but falls far behind the GeForce GTX 285 SLI. This additional reserve of bottom speed may come in handy in certain scenes.


As for the GeForce GTX 295, it can successfully compete with the Radeon HD 4890 CrossFireX even at the highest resolution. If Nvidia’s solution has a comparable or lower retail price, we’d recommend it to Far Cry 2 players because it is easier to use.


F.E.A.R. 2: Project Origin


Here, ATI’s solution is in the lead at the first three resolutions although the advantage of the Radeon HD 4890 CrossFireX over the GeForce GTX 285 SLI is negligible and its bottom speed is considerably lower. Despite its three GPUs the Radeon HD 4870 3-way CrossFireX configuration delivers the same performance at a much higher level of power consumption.


The GeForce GTX 285 SLI subsystem is only 3% ahead of its opponent at 2560x1600 in terms of average performance. The GeForce GTX 295 is still the best solution that delivers a frame rate of 60fps at 2560x1600 but is compatible with nearly every mainboard that has at least one PCI Express x16 slot.


Left 4 Dead


The game runs on the Source engine and has an integrated benchmark, but the latter does not report the bottom speed information.


The two multi-GPU tandems are roughly equal but Nvidia’s solution gains the upper hand at 2560x1600. The Radeon HD 4890 CrossFireX is challenged by the GeForce GTX 295 here. The latter card can make an optimal purchase for a gamer who does not care much about his computer budget but does not want to bother about multiple cards, SLI connectors, etc. But if you are willing to put up with the drawbacks typical of discrete multi-GPU solutions, we can recommend you to buy two GeForce GTX 285 cards and an appropriate mainboard.


S.T.A.L.K.E.R.: Clear Sky


To achieve a playable speed in this game we disabled FSAA and such resource-consuming options as Sun rays, Wet surfaces and Volumetric Smoke. We use the Enhanced full dynamic lighting (DX10) mode for our test and additionally enable the DirectX 10.1 mode for the ATI cards.


This game, besides Crysis Warhead, is among the most demanding applications on our list of benchmarks despite the relaxed settings described above. Therefore it is highly interesting to watch top-end hardware run it.


This time every test participant with two or more GPUs can deliver a playable speed at the resolution of 2560x1600. The best bottom speed can be achieved with the Radeon HD 4890 CrossFireX tandem thanks to its increased clock rates and DirectX 10.1 support whereas the GeForce GTX 285 SLI is somewhat inferior to it in terms of both average and bottom speed. We can also note that Nvidia’s solutions feel more confident at lower display resolutions here


Performance in Third-Person 3D Shooters


Devil May Cry 4


Today’s multi-GPU solutions are overkill for this game. Even the single Radeon HD 4890 allows playing at 2560x1600 comfortably with excellent average and bottom speed showings. The Radeon HD 4890 CrossFireX does best at 1680x1050 and 1920x1200 whereas the GeForce GTX 285 SLI is ahead of it at 1280x1024 and 2560x1600.


The 3-way CrossFireX configuration boasts the best result in the two top resolutions but, as we’ve said above, this speed is not necessary for Devil May Cry 4 as it provides no practical benefits.


Prince of Persia


Although it is Nvidia’s solutions that are usually the best performers in this test, the Radeon HD 4870 3-way CrossFireX takes top place in every display mode, although its bottom speed is comparable to that of the GeForce GTX 285 SLI or even lower.


The bottom speed remark refers to the Radeon HD 4890 CrossFireX tandem, too. The difference is insignificant, though. The performance of this solution at 2560x1600 is quite comfortable although the GeForce GTX 285 SLI ensures a higher reserve of speed that may come in handy in some especially dynamic scenes


Performance in RPG


Fallout 3


This round is a tie, actually. Both titans of 3D graphics cope with delivering comfortable performance at every resolution but the Radeon HD 4890 CrossFireX system is somewhat slower than its opponent in terms of bottom speed at 2560x1600.


Judging by the results, the multi-GPU technologies are not really called for in this game because it runs fast enough even on a Radeon HD 4890 or GeForce GTX 285 at the highest display resolution.


Mass Effect


The Radeon HD 4890 CrossFireX tandem is barely ahead of the ordinary Radeon HD 4870 X2 notwithstanding the higher GPU and memory frequencies, but provides somewhat more comfort at 1920x1200 thanks to the higher bottom speed. The latter is 25fps, which means the lack of any reserve, as opposed to the GeForce GTX 285 SLI subsystem that has a bottom speed of nearly 40fps. The GeForce GTX 295 is somewhat worse in speed but better in usage, so this card is actually the best choice for playing Mass Effect.


None of the multi-GPU solutions can provide a playable bottom speed at 2560x1600 but the GeForce GTX 285 SLI is close to doing that. Subjectively, the game is playable on that platform with a reduction in gameplay smoothness in the most action-heavy scenes


Performance in Simulators


Race Driver: GRID


A single GeForce GTX 285 is enough for playing this game even at 2560x1600, although this card has the worst result among the tested solutions. The Radeon HD 4890 CrossFireX equals the GeForce GTX 285 SLI because the small advantage of AMD’s solution does not show up in practice.


The 3-way CrossFireX solution fails yet another test, being only ahead of the Radeon HD 4890 tandem at 2560x1600. Again, this gives no practical benefits to the owner of such a noisy and uneconomical configuration considering the overall high level of performance in this game.


Tom Clancy’s H.A.W.X.


We use the in-game benchmarking tools that do not allow to measure the bottom frame rate. We also enable DirectX 10.1 support for ATI’s solutions.


ATI’s single cards do not look very good in this game but CrossFireX technology changes the picture: two Radeon HD 4890 cards in one graphics subsystem show excellent scalability and superb performance at resolutions up to 1920x1200 inclusive. The GeForce GTX 285 does not scale up well in SLI mode, and the appropriate SLI configuration is 37% slower than its opponent at 1920x1200.


This is also the only game on our list where the Radeon HD 4870 3-way CrossFireX platform provides a practical benefit as it makes the resolution of 2560x1600 playable with comfort. The GeForce GTX 295 has a performance slump due to the lack of local graphics memory (it has 896MB as opposed to the SLI pair’s 1024MB)


Performance in Strategies


Red Alert 3: Uprising


The game has a frame rate limiter fixed at 30fps. We could not disable it.


Despite the dramatic improvement of average performance in SLI mode, Nvidia’s solutions still cannot boast a good bottom speed if you enable full-screen antialiasing in this game. ATI’s solutions are better in this respect: the single Radeon HD 4890 is never slower than 22fps even at 1920x1200.


The Radeon HD 4890 CrossFireX tandem wins the 2560x1600 resolution but its bottom speed is no higher than 20fps. It means that the gameplay may lose its smoothness in some situations, preventing you from playing a complex combination with your units that would require a quick and combined action.


World in Conflict: Soviet Assault


The recently released add-on to the original game does not introduce any technical innovations but contains a new plotline that allows you to play for the USSR.


In this strategy game the GeForce GTX 285 SLI comes to the fore. It is the only solution capable of maintaining a bottom speed of over 25fps at 2560x1600 pixels. The bottom speed of the Radeon HD 4890 CrossFireX is lower and its playability is limited to 1920x1200.


The results of the Radeon HD 4870 3-way CrossFireX are almost the same as those of the Radeon HD 4890 CrossFireX. Building such a configuration does not make much sense, except for individual games like Tom Clancy’s H.A.W.X


Performance in Semi-Synthetic Benchmarks


Futuremark 3DMark06


3DMark06 suggests that there is not much point in assembling a Radeon HD 4870 3-way CrossFireX subsystem because its overall score is only 1156 points higher than that of the Radeon HD 4890 CrossFireX but the latter consumes far less power and is quieter. Well, we don’t think that a hypothetical Radeon HD 4890 3-way CrossFireX would be much better in this old version of 3DMark that defaults to 1280x1024.


Otherwise ATI’s solutions – both single- and multi-GPU ones – are quite fast.


The individual groups of tests provide far more interesting results: the Radeon HD 4890 CrossFireX tandem is even ahead of the Radeon HD 4870 3-way CrossFireX in the SM2.0 tests whereas the latter is ahead in the SM3.0/HDR tests, scoring over 11,000 points. The other multi-GPU solutions can only score about 9500 points.


Futuremark 3DMark Vantage


We minimize the CPU’s influence by using the Extreme profile (1920x1200, 4x FSAA and anisotropic filtering). We also publish the results of the individual tests across all display resolutions to provide a full picture.


This test supports hardware PhysX acceleration on Nvidia’s GPUs, so the SLI systems, from the GeForce GTX 295 to the GeForce GTX 285 pair, take top places. The Radeon HD 4890 CrossFireX cannot score even 9000 points while its opponents easily overtake that barrier. The Radeon HD 4870 3-way CrossFireX is competitive, yet cannot beat the GeForce GTX 285 SLI.


The GeForce GTX 285 SLI tandem is ahead in the first three resolutions of the first test, but the Radeon HD 4870 3-way CrossFireX wins at 2560x1600. The Radeon HD 4890 CrossFireX is always slower than the GeForce GTX 295 but the gap shrinks to naught at 2560x1600.


Nvidia is not so victorious in the second test: the GeForce GTX 285 SLI wins at the first two resolutions only and loses to ATI’s triple-GPU platform. The Radeon HD 4890 CrossFireX is ahead of the GeForce GTX 295 at high resolutions, starting from 1920x1200


Conclusion


The fight is over and the heavyweights are leaving the ring. Who is the winner then? Strictly speaking, the Radeon HD 4890 CrossFireX and GeForce GTX 285 SLI belong to somewhat different weights because the latter is considerably more expensive. However, they did fight and we should examine the results in more detail to see if this comparison makes sense.


The relatively inexpensive configuration based on the new RV790 processors from ATI takes a good start, being a mere 3% slower than the more expensive opponent on average. Moreover, this configuration is either faster or comparable to the GeForce GTX 285 SLI! It is far slower in three games only: Far Cry 2, S.T.A.L.K.E.R.: Clear Sky and World in Conflict: Soviet Assault. The advantage of the Radeon HD 4890 CrossFire over the GeForce GTX 285 SLI is higher than 20% in such games as F.E.A.R. 2: Project Origin and Tom Clancy’s H.A.W.X.


We also found out that the dual-processor RV790-based configuration is no worse or even better than the triple-RV770 one, being only 1% slower on average. The exceptions are Prince of Persia and Tom Clancy’s H.A.W.X. but the Radeon HD 4870 3-way CrossFireX does not have any practical advantage at 1280x1024 anyway.


At the resolution of 1680x1050, which seems to be the most popular among modern gamers on the PC platform, the advantage of the GeForce GTX 285 SLI tandem over the Radeon HD 4890 CrossFireX is even lower at an average 2%. The biggest gap is in Tom Clancy’s H.A.W.X., but the next update of the GeForce driver is going to solve this problem. The situation is overall more equal in comparison with the resolution of 1280x1024.


Comparing the Radeon HD 4890 CrossFireX and the Radeon HD 4870 3-way CrossFireX, the latter is still ahead in Prince of Persia and Tom Clancy’s H.A.W.X. but the performnance growth is not worth the money and trouble associated with the high noise, heat dissipation and power consumption of such a subsystem.


Notwithstanding the different price categories, the fighters equal each other at 1920x1200: the GeForce GTX 285 SLI has an average advantage of less than 1%. It is 32% ahead of the Radeon HD 4890 CrossFireX in Mass Effect but 37% behind it in Tom Clancy’s H.A.W.X. In most other tests the difference is no bigger than 2-4% to either side, excepting Call of Duty: World at War, Far Cry 2 and World in Conflict: Soviet Assault. Thus, both platforms are suitable for the resolution of 1920x1200, and you should just take into account what games you are going to play. Alas, we can’t test them subsystems in all the games available on the market.


At the highest resolution there is no gap between the two multi-GPU solutions at all. Nvidia wins 8 and loses 7 tests but has a serious advantage in Far Cry 2 only (17%). There is also only one serious defeat – by 20% in Crysis Warhead. That’s rather funny considering the kinship of the two games.


People who love flight simulators can find a good use for a Radeon HD 4870 3-way CrossFireX subsystem together with a 30-inch monitor since it delivers comfortable performance in Tom Clancy’s H.A.W.X. even at 2560x1600 at the highest graphics quality settings plus full-screen antialiasing. Or perhaps you should wait for a Radeon HD 4890 X2?


Anyway, the Radeon HD 4890 CrossFire has proved to be a worthy opponent to the GeForce GTX 285 SLI configuration. The latter is generally faster at low resolutions, but ATI’s configuration secures a draw at 1920x1200 and higher resolutions. Therefore, we can expect it to be faster than the GeForce GTX 285 SLI tandem from the same price category. We will check this out practically in an upcoming review.


As for practical recommendations for gamers, it would not be wise for us to make them basing on our list of 15 games only, especially as you should take into account the display resolution you are going to play at. Still, we can note that if you want maximum performance in Crysis Warhead or Far Cry 2, you should consider building a GeForce GTX 285 SLI, but a Radeon HD 4890 CrossFireX configuration would be better for F.E.A.R. 2: Project Origin or Tom Clancy’s H.A.W.X


EVGA GeForce GTS 285 FTW and Zotac GeForce GTX 285 AMP! Summary


Both these cards are copies of Nvidia’s reference design and feature factory overclocking. Therefore, we can draw similar conclusions about them, at least when it comes to technical specifications and performance. EVGA solution works at slightly higher memory and GPU frequencies, however, they are still not high enough to ensure a visible performance advantage over Zotac GeForce GTX 285 AMP! card in contemporary games. On the other hand, the latter comes bundled with a more attractive set of accessories that includes Race Driver: GRID game and 3DMark Vantage suite.


The choice in this case depends solely on the retail price of these graphics accelerators, so the cheaper card will be a better buy.


Highs:


  • Best gaming performance among single-GPU graphics accelerators;
  • May compete with ATI Radeon HD 4850 X2 in some tests;
  • Higher GPU and memory frequencies;
  • Uses 55nm G200 modification;
  • Wide range of supported FSAA modes;
  • Minimal effect of enabled FSAA on performance;
  • 240 ALU, 80 texturing units, 32 RBE;
  • PhysX acceleration support in the GPU;
  • Hardware HD-video decoding support;
  • S/PDIF sound over HDMI;
  • Relatively low power consumption and heat dissipation;
  • Relatively low level of generated noise;
  • Rich accessories bundle (by Zotac GeForce GTX 285 AMP!).

Lows:


  • No DirectX 10.1 and Shader Model 4.1 support;
  • Incomplete hardware support of VC-1 decoding;
  • No integrated sound core;
  • Modest overclocking potential.

Asus EAH4890 and EAH4890 TOP Summary


The representatives of Asus EAH4890 lineup, just like the previously reviewed PowerColor HD4890 Plus, belong to the first generation of Radeon HD 4890 solutions using reference PCB design and cooling system. This way, the only way to win the competition between the first-round players is to offer the best accessories bundle and the highest overclocking potential. Asus EAH4890 and EAH 4890 TOP do not leave PowerColor HD4890 Plus a single chance in the first nomination. However, when it comes to overclocking potential, the PowerColor solution easily outperforms both Asus contestants easily reaching 1GHz GPU and 1200 (4800) MHz memory frequencies. Asus EAH4890 TOP is just a little behind, so PowerColor HD4890 Plus remains a formal winner.


As for Asus EAH4890, it may be a preferable choice for those who are into overclocking, especially, if it retails at a much lower price than EAH4890 TOP.


Highs:


Highs:


  • High performance in contemporary games;
  • Outperforms GeForce GTX 285 in a number of tests;
  • Higher GPU frequency (by EAH4890 TOP);
  • Wide range of supported FSAA modes;
  • Best Edge-detect CFAA in the industry;
  • 1024MB of local video memory onboard;
  • 800 ALU and 40 texture processors;
  • DirectX 10.1 and Shader Model 4.1 support;
  • Fully-fledged hardware HD video decoding;
  • High-quality HD video post-processing with scalability;
  • Built-in 8-channel audio controller with HD support;
  • Sound over HDMI;
  • Software control over GPU voltage settings;
  • Excellent overclocking potential (by EAH4890 TOP);
  • Low noise;
  • Comparatively low power consumption;
  • Lower heat dissipation compared with Radeon HD 4870;
  • Rich accessories bundle.

 Lows:


  • No serious drawbacks found.


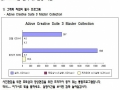
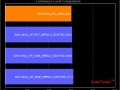
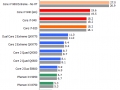
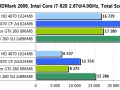
source - http://www.xbitlabs.com


전체적으로 라데온 4890 크로스파이어가 지포스 GTX 285 SLI 구성보다 높은 성능을 나타내며 4870 X3 (4870X2 + 4870)의 높은 성능도 확인할수 있다.

  • profile
    차효민 2009.04.24 15:39
    승리의 4890~                    
  • ?
    켄츠필드 2009.04.24 21:49
    좋쿤요                   


  1. [인텍]인텔 SSD M25-X (1부 노트북)

    감사합니다
    Date2009.05.09 CategorySTR Reply0 Views1953
    Read More
  2. 페넘II 신형 955BE 성능확인

    Clocked at 3.2GHz with a 2.0GHz un-core (or North Bridge) frequency, the 955 isn’t that much different from the 940 in terms of clock speed. The two face off in the table below: CPU Clock Speed un-core Clock (NB Frequency) Die Size Transist...
    Date2009.04.27 CategoryCPU Reply0 Views4879
    Read More
  3. No Image

    충격과 공포의 라데온 4770

    출처 - http://en.expreview.com 지금까지 공개된 자료들과 다르지 않은, 4770은 4850에 근접한 성능에 전력소모는 40나노 공정으로 인해 대폭 감소, 가격은 99달러,,,게임오버
    Date2009.04.26 CategoryGPU Reply4 Views4208
    Read More
  4. 4890CF vs GTX 285 SLI 벤치마크

    라데온 4890 크로스 파이어가 지포스 285 SLI 구성보다 50와트정도 적게 소모 ㅡ 테스트 시스템 Testbed and Methods We are going to investigate the performance of GeForce GTX 285 SLI and Radeon HD 4890 CrossFireX tandems in contemporary games usi...
    Date2009.04.24 CategoryGPU Reply2 Views8469
    Read More
  5. 헤카720vs헤네브vs요크필드 대결,

    Phenom II X3 720 has the fourth core Test platform configuration table Hardware platform CPU Phenom II X3 720 black editionCore2 Q9300 Motherboard MSI DKA790GX Platinum MSI P45 Platinum Memory DDR2-800 2GB(1GB×2) HDD Seagate Barracuda 250...
    Date2009.04.22 CategoryCPU Reply3 Views4970
    Read More
  6. 카탈리스트 NEW 9.4 성능 테스트

    테스트 시스템 Test System Setup Processor(s): Intel i7 920 @ 3.8GHz (190MHz x 20) Cooling: Noctua NH-U12P (Supplied by Noctua) Motherboard(s): GIGABYTE EX58-UD5 (Supplied by GIGABYTE) Memory: 3 X 2GB OCZ Technology PC-12800 DDR-3 8-8-8-24 (...
    Date2009.04.13 CategoryS/W Reply1 Views2780
    Read More
  7. 승리의 라데온? 추가 벤치마크

    라데온 기판 모습 강화된 디지털 전원부 강화된 레퍼런스 쿨링 시스템 전력소모량 - 기존 4870 대비 성능은 향상되었고 전력소모는 좋아졌다. 온도 - 강화된 디지털 전원부와 향상된 쿨링 시스템으로 오히려 더 개선 Testbed and Methods We are going to inv...
    Date2009.04.02 CategoryGPU Reply4 Views2962
    Read More
  8. 충격, 라데온 4890 정식 벤치

    출처 - http://www.gamestar.de 그동안의 정보들을 깨고 정식 공개된 라데온 4890의 성능은 말그대로 충격입니다. 4890은 엔비디아의 신형 GTX 275와 경쟁할것으로 예상되었지만 밝혀진 실 성능은 4890 노말 모델이 엔비디아 싱글카드 최상위 모델인 GTX 285...
    Date2009.04.02 CategoryGPU Reply3 Views3456
    Read More
  9. 동영상 재생 SW 색감 벤치마킹

    동영상 Player 색감 벤치 필자는 지난 10월 중순 V-Tune for DVD라는 화면 조정용 패턴과 동영상 DVD를 배포하면서 아래와 같은 강좌를 TV포유(http://www.tv4u.co.kr/) 홈페이지에 올려 드린 적이 있다. 이 강좌에서 필자는 컴퓨터용 동영상 플레이어인 Wind...
    Date2009.03.28 CategoryS/W Reply3 Views3347
    Read More
  10. No Image

    신형 라데온 4890 성능 확인

    출처 - http://www.ocheaven.com AMD의 신형 라데온 4890은 노말 버전과 오버클럭 버전으로 두개의 라인업으로 출시될것이라 하는데, 현재 테스트된 모델은 오버클럭된 모델로, 라데온 4870보다 10~15% 정도 성능이 향상된것으로 보입니다. 또한 이런 4890을 ...
    Date2009.03.20 CategoryGPU Reply2 Views3275
    Read More
  11. 써모랩, 바람 쿨러 성능 확인

    Thermolab Baram 출처 - http://www.bouweenpc.nl 어느정도 심플한 설계에 상당히 높은 쿨링 성능을 나타내고 있습니다.
    Date2009.03.16 CategoryETC Reply0 Views2246
    Read More
  12. 지포스 GTX295 & 285 벤치마크

    The new graphics card is packed into an upright box that shows basic product information on the face side and detailed info on the back. There is one more box made from thick cardboard inside the external wrapping. The graphics card is fixed...
    Date2009.03.16 CategoryGPU Reply0 Views12887
    Read More
  13. No Image

    차세대 SSD 3종 벤치마크

    Test System Intel X25-M SATA2 SSD 80Gb Patriot Warp v.2 SATA2 SSD 32Gb Super Talent MasterDrive OX SATA2 SSD 64Gb Western Digital Raptor X SATA 150Gb Intel i7-965EE Nvidia GeForce GTX 295 3x2Gb Corsair Dominator 1600MHz 8-8-8-24-2T Foxconn ...
    Date2009.03.13 CategorySTR Reply0 Views2702
    Read More
  14. No Image

    AMD 헤카 VS 데네브 810 VS 페넘 VS 인텔 프로세서

    출처 - http://ht4u.net
    Date2009.03.12 CategoryCPU Reply1 Views4764
    Read More
  15. AMD 쿠마 7750 성능 테스트

    Athlon 64 X2 7750 in Detail Test System Hard Disk: Intel X28 SSD 80GB (Supplied by Intel)Graphics Card: GIGABYTE 9800GX2 (Supplied by GIGABYTE) Cooling: GIGABYTE 3D Galaxy II (Supplied by GIGABYTE)Operating System: Microsoft Windows Vista X...
    Date2009.02.26 CategoryCPU Reply0 Views7076
    Read More
  16. 크로스파이어vsSLI 효율비교

    [ 테스트 시스템 ] Mainboard: ASUS P6T Deluxe (Intel X58 Express), LGA 1366, BIOS 1102 CPU: Intel Core i7-920, 2.67 GHz, 1.25 V, L2 4 x 256 KB, L3 8 MB (Bloomfield, C0) CPU cooler: Thermalright Ultra-120 eXtreme-1366RT (2 Thermalright TR-FDB ...
    Date2009.02.05 CategoryGPU Reply0 Views5301
    Read More
  17. 페넘II 940BE / 920 벤치마크 (아난드텍)

    Processor AMD Phenom II AMD Phenom Intel Core i7 Intel Core 2 Quad Q8xxx/Q9xxx Manufacturing Process 45nm 65nm 45nm 45nm L1 Cache 64K + 64K per core 64K + 64K per core 32KB + 32KB per core 32KB + 32KB per core L2 Cache 512KB per core 512KB ...
    Date2009.01.25 CategoryCPU Reply2 Views3854
    Read More
  18. No Image

    윈도우7은 비스타보다 빠르다

    The test systems I’ve used two desktop systems as the test machines: An AMD Phenom 9700 2.4GHz system fitted with an ATI Radeon 3850 and 4GB of RAM An Intel Pentium Dual Core E2200 2.2GHz fitted with an NVIDIA GeForce 8400 GS and 1GB of RAM ...
    Date2009.01.22 CategoryS/W Reply0 Views2539
    Read More
  19. 지포스 GTX 295 vs 라데온 4870x2 (탐스)

    출처 - http://www.tomshardware.com 라데온 4870x2의 왕좌 탈환이 5개월정도가 흐른뒤 발표된 지포스 gtx 295는 최신 모델답게 라데온 4870x2를 전반적으로 넘어서고 있습니다. 하지만 과거처럼 대단하다고 생각되지 않는 이유는 엔비디아의 앞날에 밝은점이...
    Date2009.01.03 CategoryGPU Reply1 Views2407
    Read More
  20. No Image

    페르시아의 왕자로 최신 그래픽카드 벤치마크

    테스트 프로그램 - 페르시아의 왕자 최신판 Hardware CPU Intel Core 2 Extreme QX6800 Motherboard MSI P45 Platinum Memory Corsair DDR2-800 2GB (1GB×2) HDD Seagate Barracuda 7200.10 250GB VGA Card See in the results chart Audio / Cooler OC3 HP-1...
    Date2008.12.28 CategoryGPU Reply0 Views2207
    Read More
  21. 네할렘 CORE I7 시리즈 벤치마크

    출처 - http://techreport.com Now that you've seen the performance results, this little exercise may seem like a whole lot of work for a relatively minor issue. But we do strive for accuracy in our testing, and as you can see, our first atte...
    Date2008.12.14 CategoryCPU Reply3 Views2829
    Read More
  22. 써멀구리스 벤치마크 (흔지않은 벤치)

    출처 - http://www.xbitlabs.com 흔하지 않은 벤치가 올라왔는데, 바로 cpu와 gpu의 표면에 쿨러를 장착하기전 바르는 써멀구리스의 성능에 관한 벤치마크 입니다. 결과는 리퀴드 프로가 가장 좋은 성능을 나타내고 국내 기업인 잘만의 제품도 포함되어 있는...
    Date2008.12.07 CategoryETC Reply0 Views3610
    Read More
  23. No Image

    AMD 라데온 4830 벤치마크-II

    HID HD 4670 Asus HD 4830 Asus HD4850 Model H467QT512P EAH4830 EAH4850 Architecture RV730 RV770 RV770 Stream Processors 320 640 800 GPU Clock 780MHz 575MHz 625MHz Memory Clock 2000MHz 2000MHz 1986MHz Memory Type GDDR3 GDDR3 GDDR3 Memory Inte...
    Date2008.11.30 CategoryGPU Reply0 Views2775
    Read More
  24. 인텔 아톰 vs VIA 나노

    출처- http://pc.nikkeibp.co.jp 전체적으로 비아의 나노 프로세서가 인텔의 아톰보다 좀더 나은 성능을 나타냅니다.
    Date2008.11.12 CategoryCPU Reply0 Views2117
    Read More
Board Pagination Prev 1 ... 11 12 13 14 15 16 17 18 19 20 ... 26 Next
/ 26