


’ 오픈<br>")


, 전세계 일자리 파괴 가속화 “육체노동만 살아남나?”<br>")


 ' alt='위대한 인류최대 수퍼로켓 '스타십(Spacex Starship)' 발사 성공 by 인공지능' />

<br>")

 다운로드 및 설치<br>")
![삼성, 잃어버린 10년 [풀영상] | 창 458회 (KBS 24.03.12) by 인공지능](https://raptor-hw.net/xe/files/thumbnails/453/204/271x205.crop.jpg "삼성, 잃어버린 10년 [풀영상] | 창 458회 (KBS 24.03.12)<br>")

<br>")


| Samsung OEM Client PCIe SSD History | ||||
| Controller | NAND Flash | Notes | Consumer Variant | |
| XP941 | S4LN053X01 | 2D MLC | PCIe 2.0, AHCI | - |
| SM951 | UBX | 2D MLC | AHCI or NVMe | 950 PRO |
| PM951 | 2D TLC | - | ||
| SM961 | Polaris | 2D & 3D MLC | 960 PRO | |
| PM961 | 3D TLC | 960 EVO | ||
| PM971 | Photon | 3D TLC | BGA SSD, PCIe 3 x2 | - |
| PM981 | Phoenix | 3D TLC | 980 Evo? | |
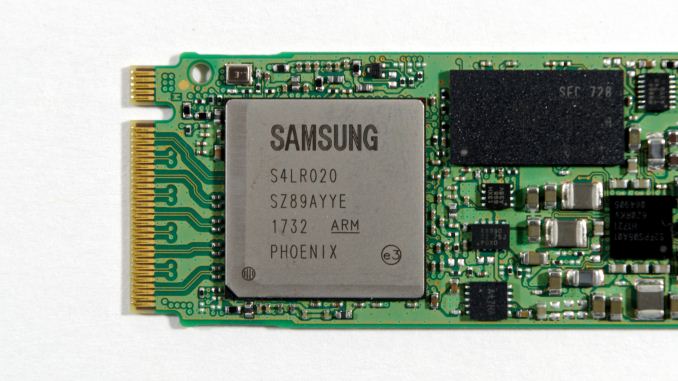
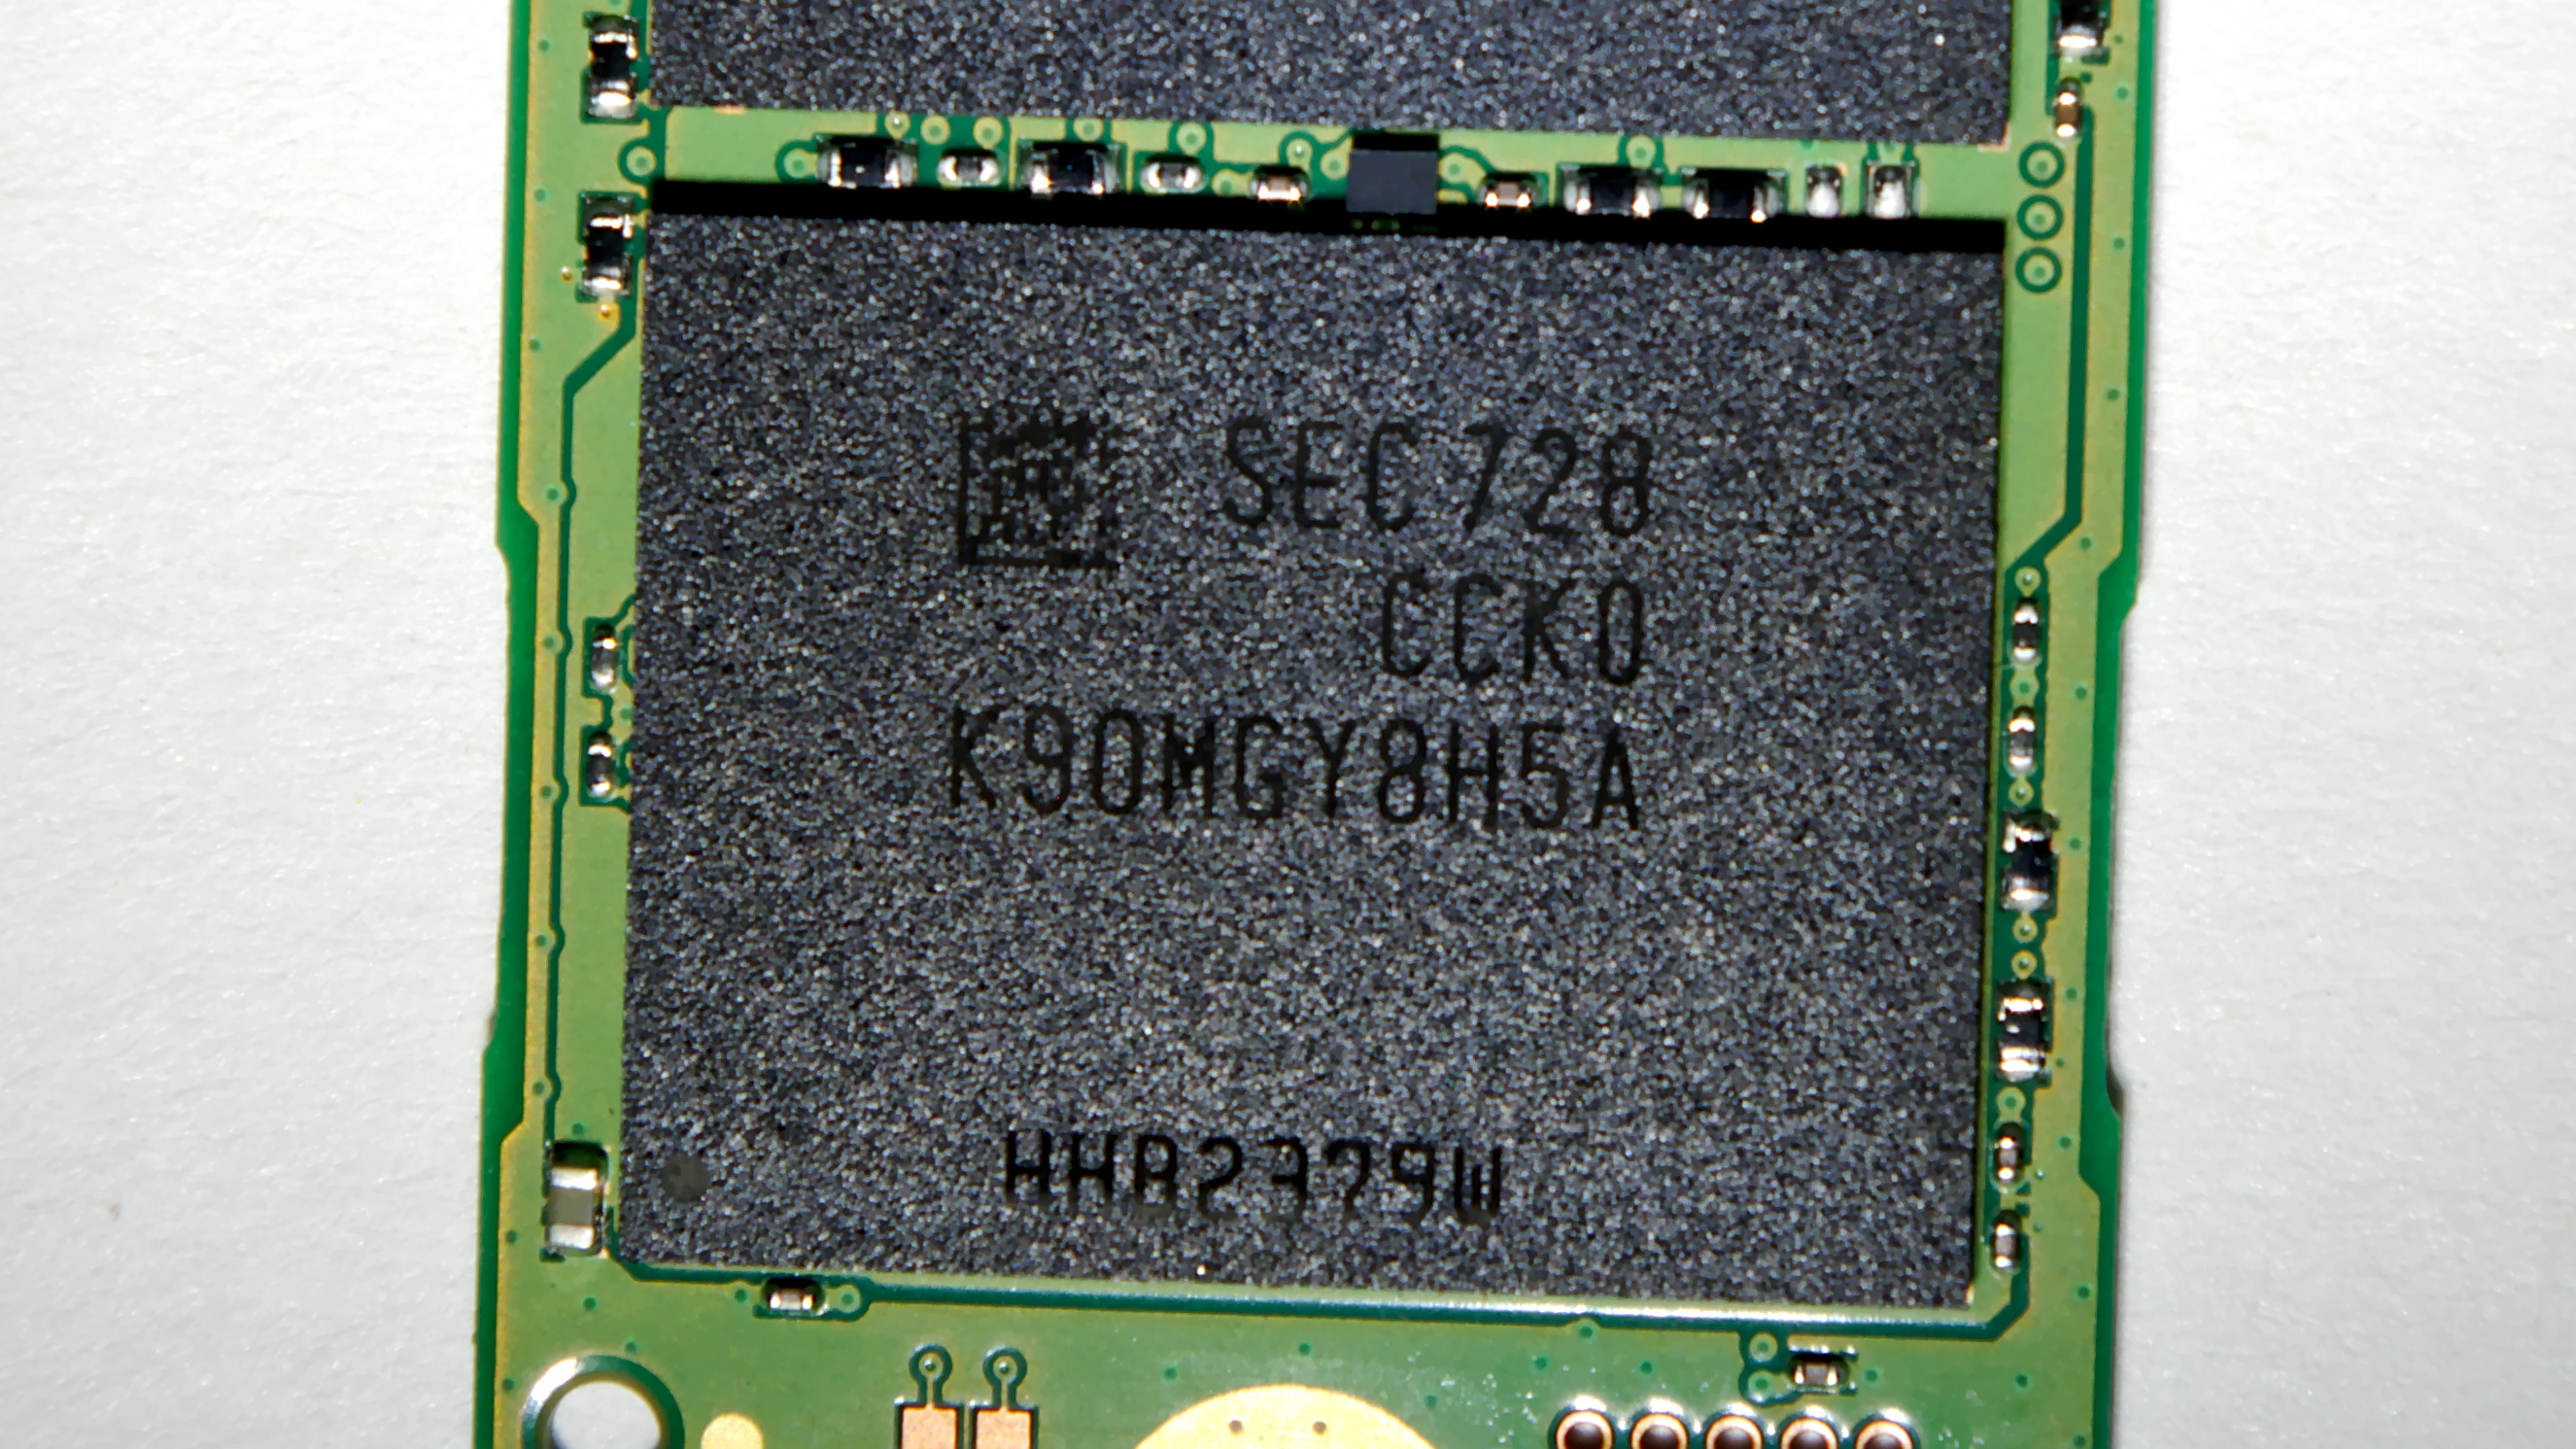
삼성 PM981 SSD 스펙
컨트롤러 : Samsung Phoenix
낸드플래시 : 64층 TLC V-NAND
인터페이스 : NVMe
테스트 시스템
| AnandTech 2017 SSD Testbed | |
| CPU | Intel Xeon E3 1240 v5 |
| Motherboard | ASRock Fatal1ty E3V5 Performance Gaming/OC |
| Chipset | Intel C232 |
| Memory | 4x 8GB G.SKILL Ripjaws DDR4-2400 CL15 |
| Graphics | AMD Radeon HD 5450, 1920x1200@60Hz |
| Software | Windows 10 x64, version 1703 |
| Linux kernel version 4.12, fio version 2.21 | |
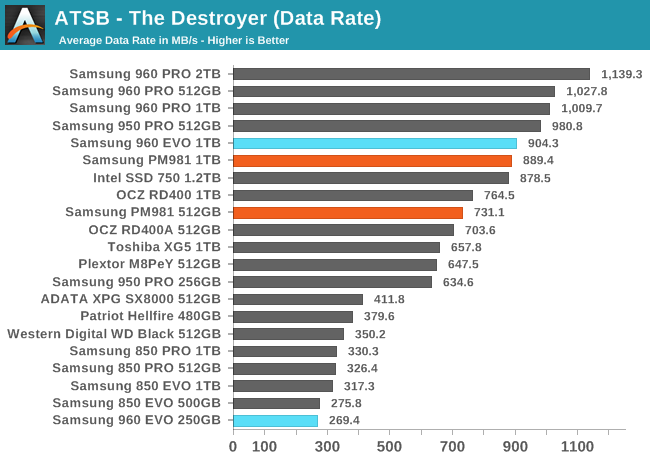
The average data rate of the 1TB Samsung PM981 on The Destroyer is comparable to the 960 EVO 1TB and well ahead of any competing TLC-based drives like the Toshiba XG5. The 512GB PM981 is slower by a typical amount, and still faster than any of the non-Samsung drives of that size.
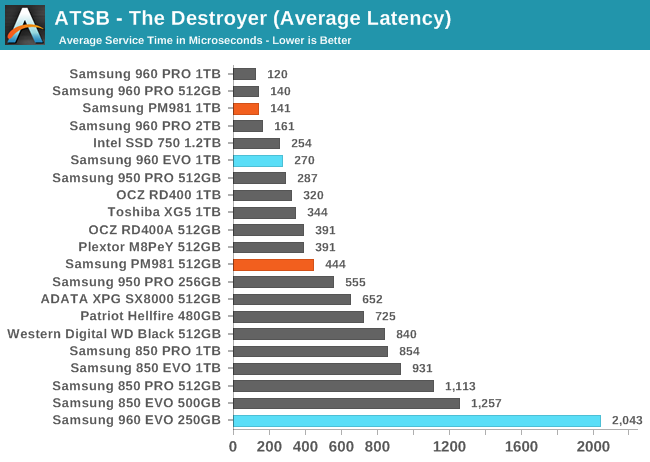
The 1TB PM981 shows a substantial improvement over the average and 99th percentile latency scores of the 960 EVO, putting it close to the 960 PRO. The 512GB PM981 isn't as impressive, with latency scores that fall behind most MLC-based NVMe SSDs.
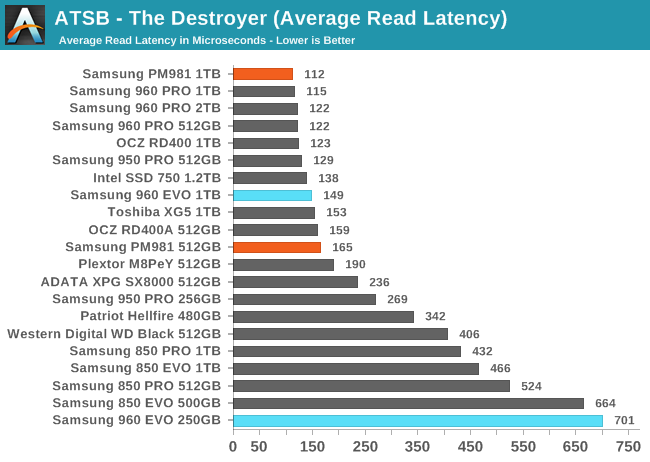
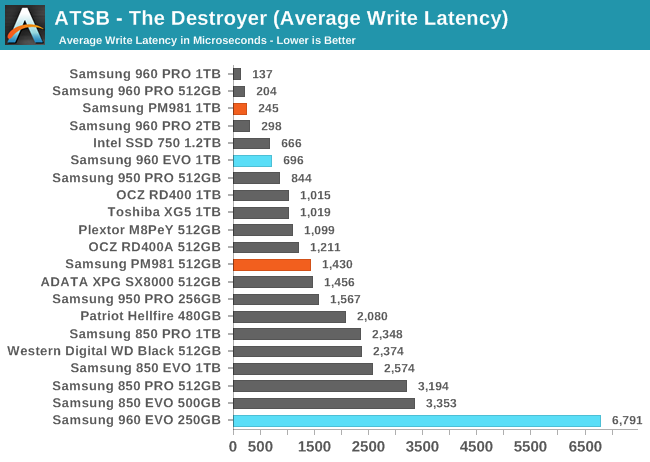
The 1TB PM981 sets a new record (among flash-based SSDs) for average read latency on The Destroyer, shaving a few microseconds off the 960 PRO's performance. The average write latency can't quite keep up with the MLC-based 960 PRO that doesn't use SLC write caching. The smaller 512GB PM981 is competitive with most similarly-sized MLC-based drives, but slower than Samsung's 960 PRO.
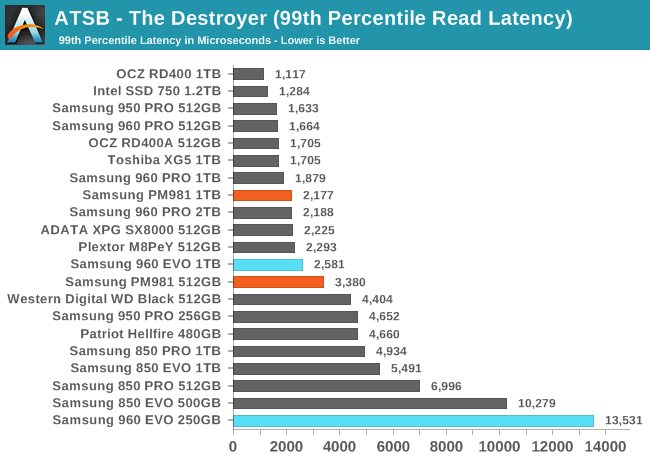
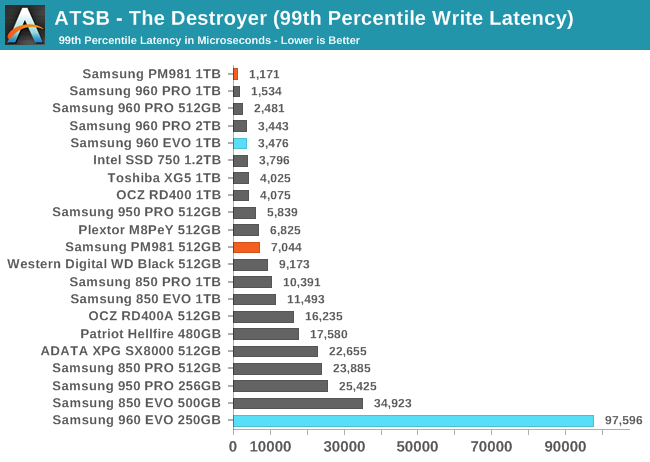
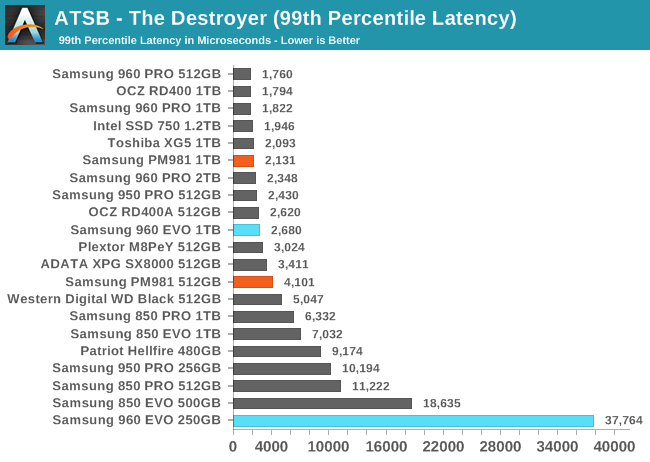
Samsung's 99th percentile read latency is nothing special, though the PM981 does offer clear improvement over the 960 EVO. The 99th percentile write latency of the 1TB PM981 is excellent and far better than the 1TB 960 EVO. The 512GB PM981 is clearly the fastest TLC-based drive of that size that we've tested, but it doesn't quite match the 99th percentile latency scores of the MLC-based competition.
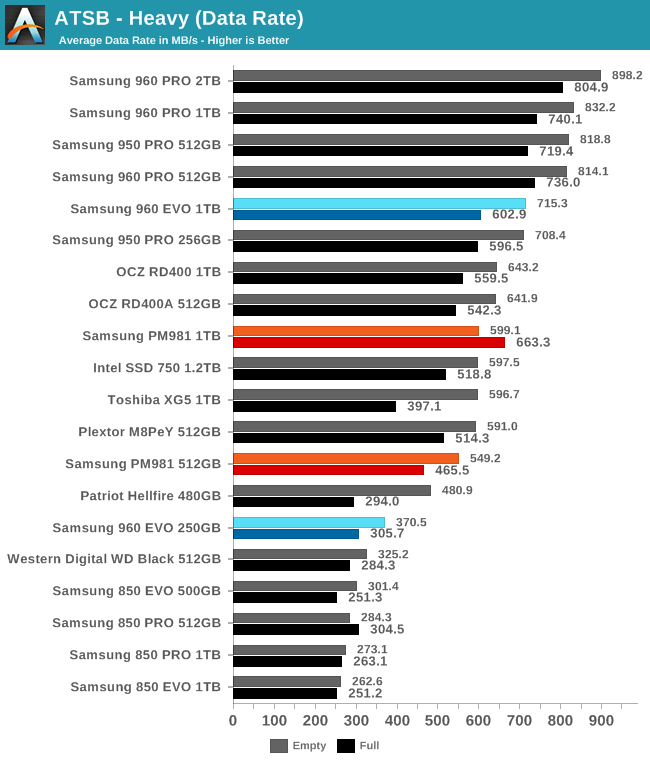
On the Heavy test, the average data rates of the 512GB Samsung PM981 again lag slightly behind most MLC-based NVMe drives but are clearly ahead of the competitors' TLC drives. The 1TB PM981 is behaving a bit oddly with slower than expected performance after a secure erase, but great performance when filled.
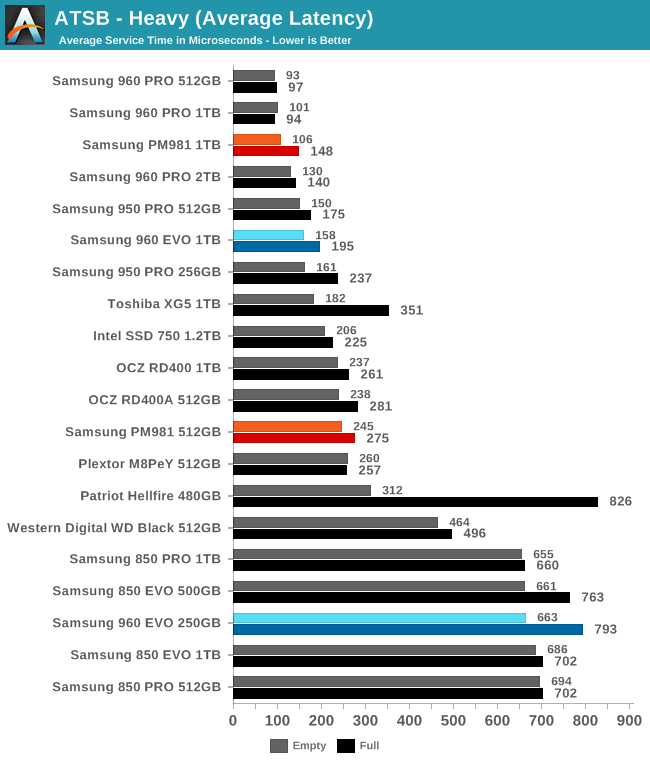
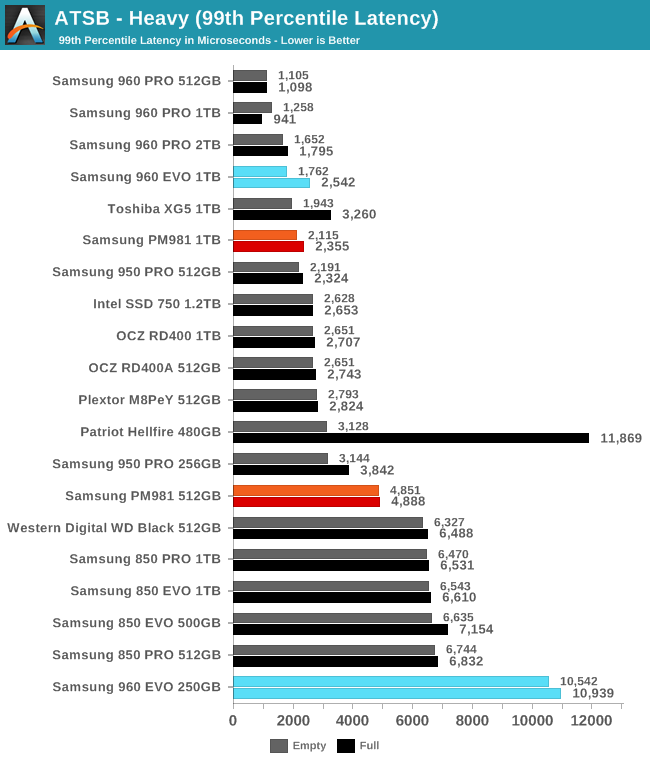
The average latency of the 1TB PM981 is a significant improvement over the 1TB 960 EVO, while the 512GB PM981 doesn't stand out from the other 512GB drives. The 99th percentile latencies aren't particularly good, and the 512GB PM981 scores worse than almost all the other PCIe SSDs of that size.
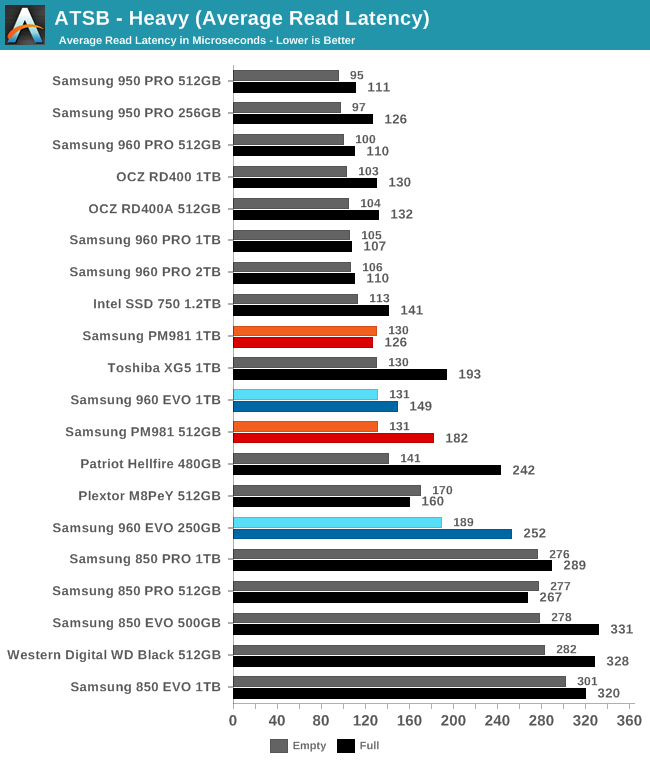
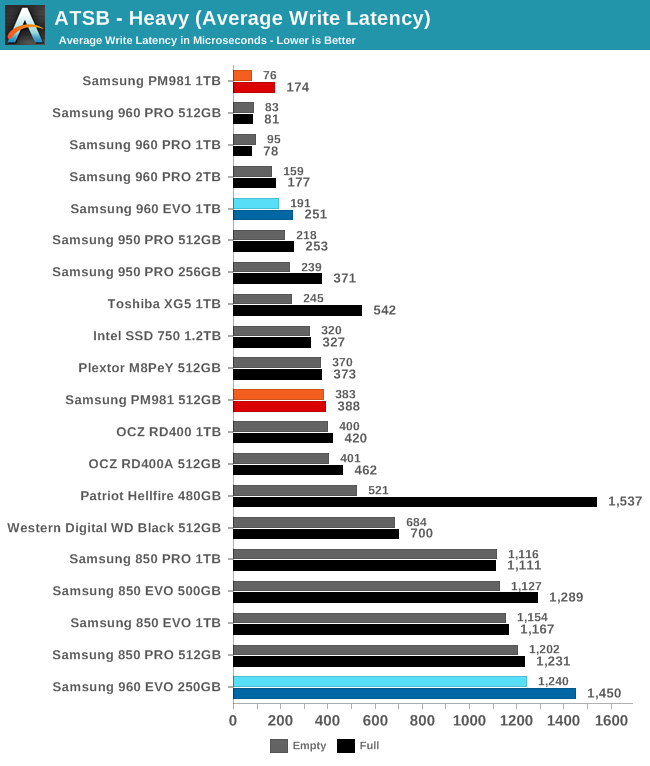
The average write latency of the 1TB PM981 is excellent especially when the test is run on an empty drive. Average read latencies for both drives are decent but aren't a big improvement over their predecessors.
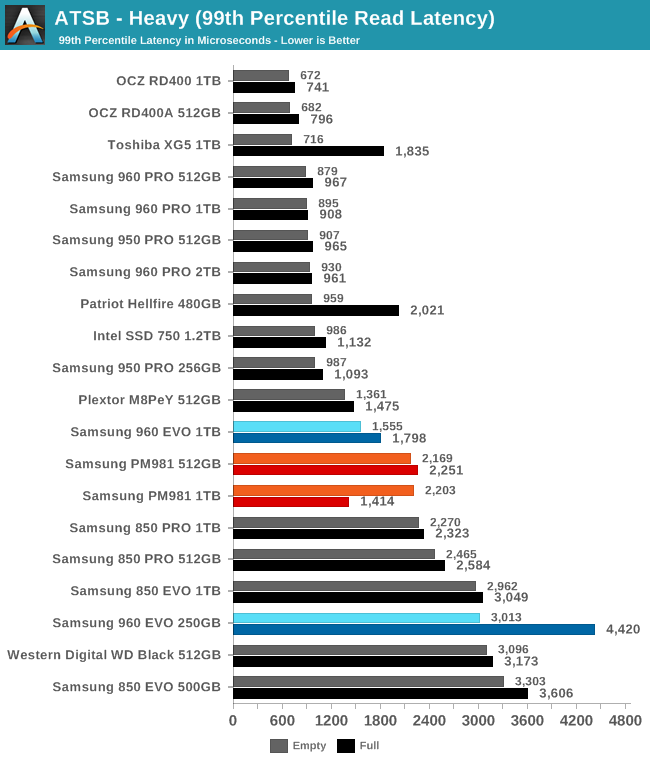
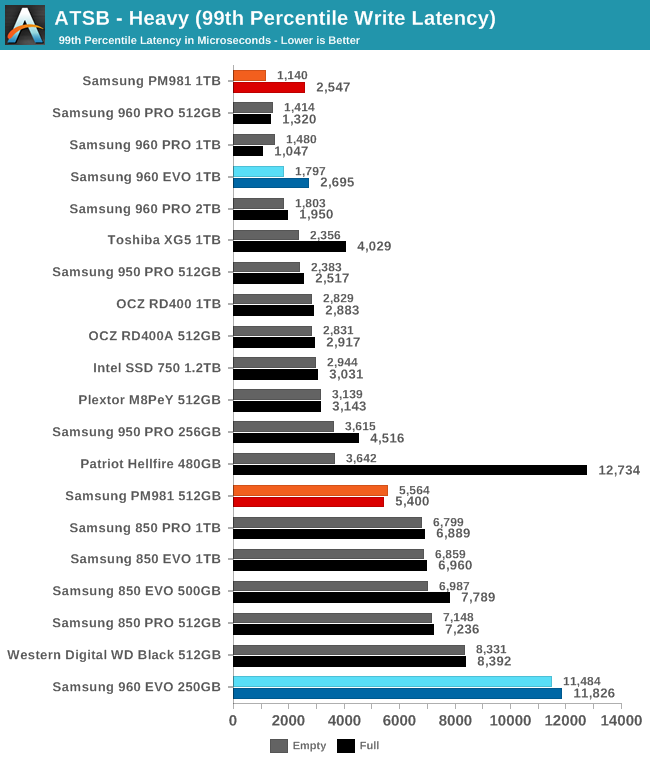
The 99th percentile read latencies are one of the few ATSB scores where the TLC-based nature of the PM981 shines through. Many MLC-based SSDs are much better at keeping read latency under control, and the TLC-based Toshiba XG5 also scores much better than the PM981 here. The 99th percentile write latency of the 1TB PM981 is pretty good, following suit to the average write latency, while the 512GB model could use some improvement.
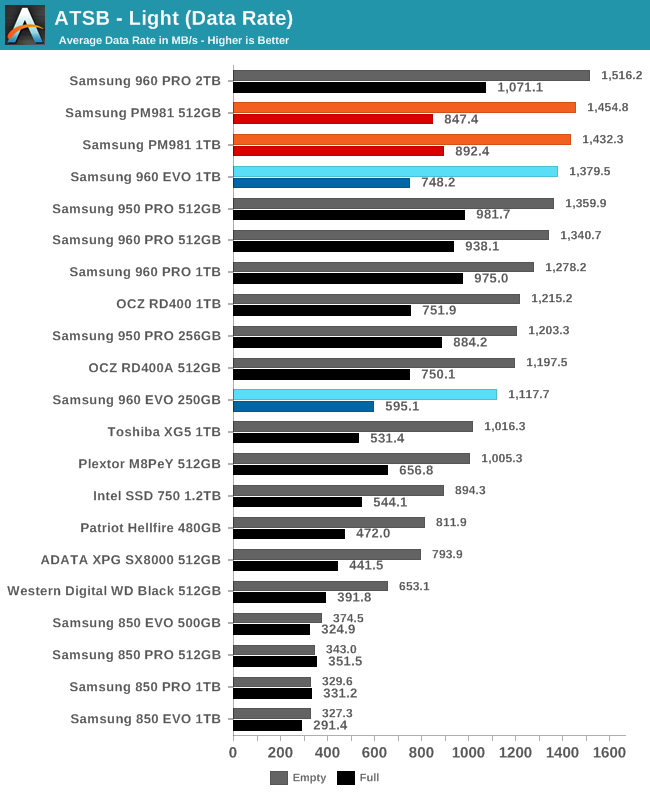
Both capacities of the Samsung PM981 offer great average data rates on the Light test. Their performance when full or empty is improved over the Samsung 960 EVO and comes close to the 960 PRO.
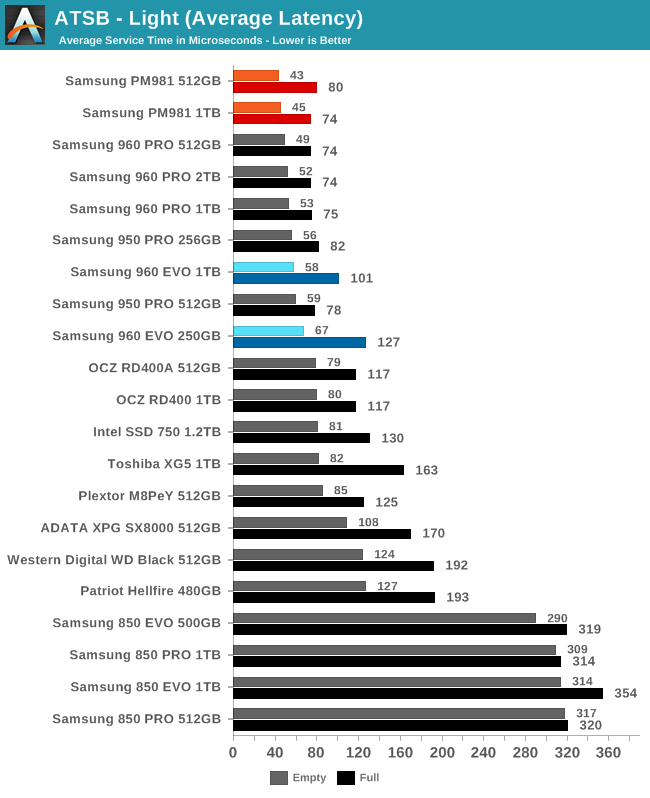
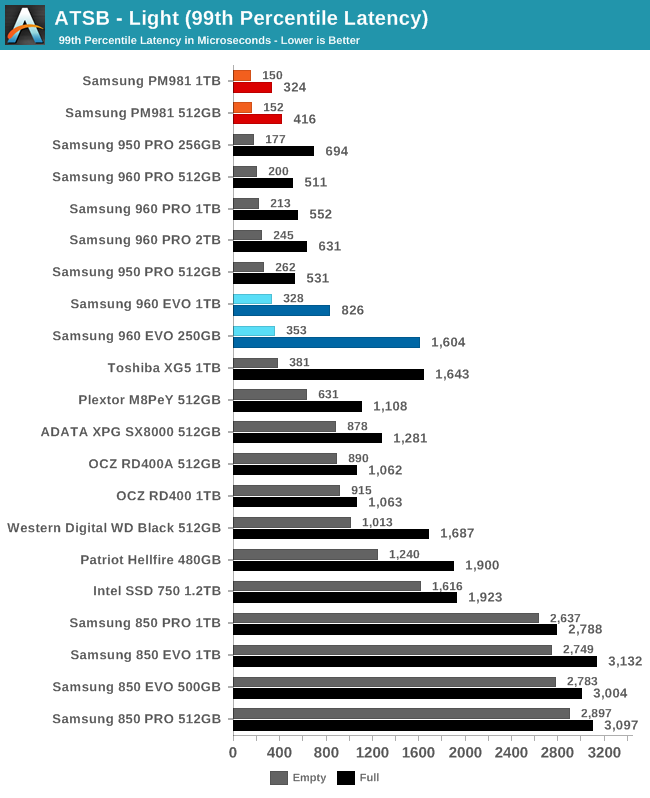
The average and 99th percentile latency scores of the PM981s aren't much of an improvement over Samsung's last generation, but this is still a new record for flash-based SSDs, even though the PM981 is using TLC NAND.
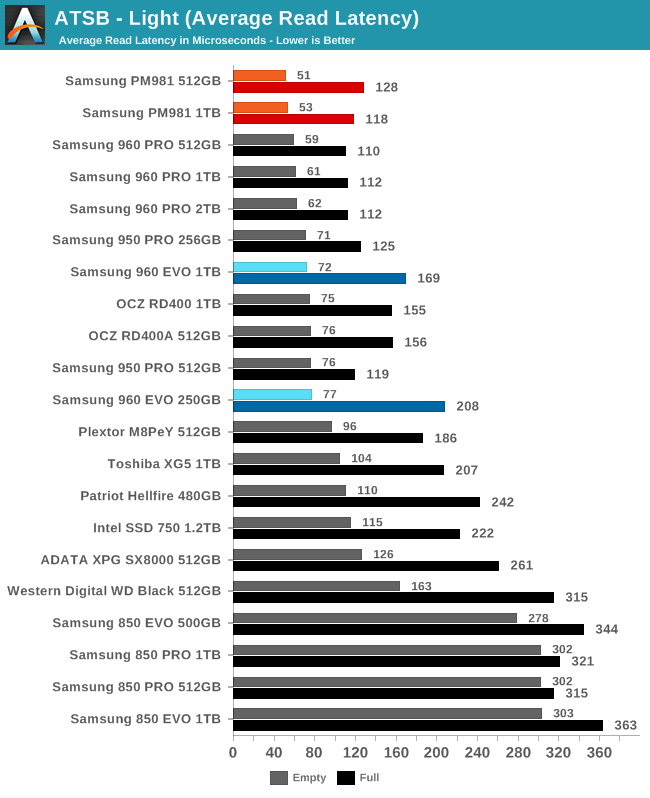
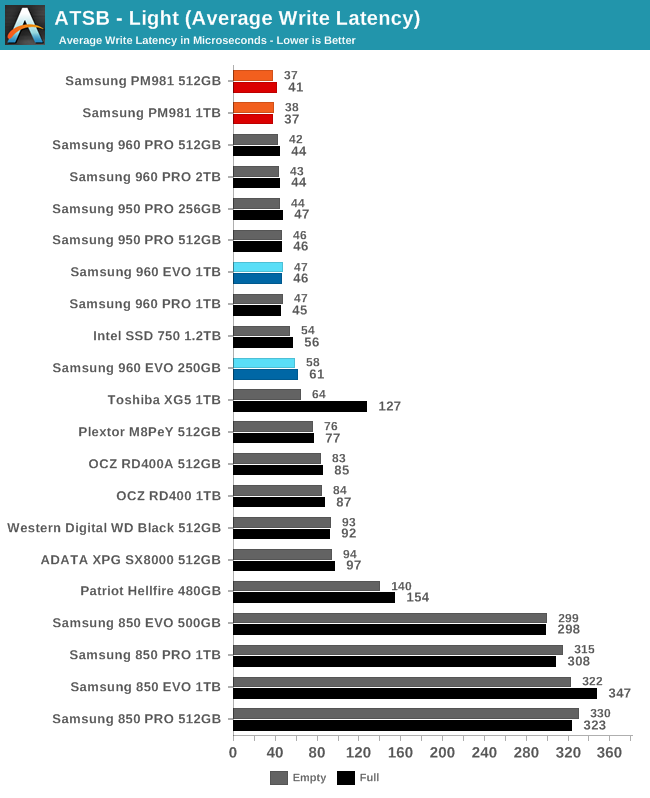
The average write latency of the PM981s is great whether the test is run on a full or empty drive, but the average read latency is slightly worse than the 960 PRO when the test is run on a full drive.
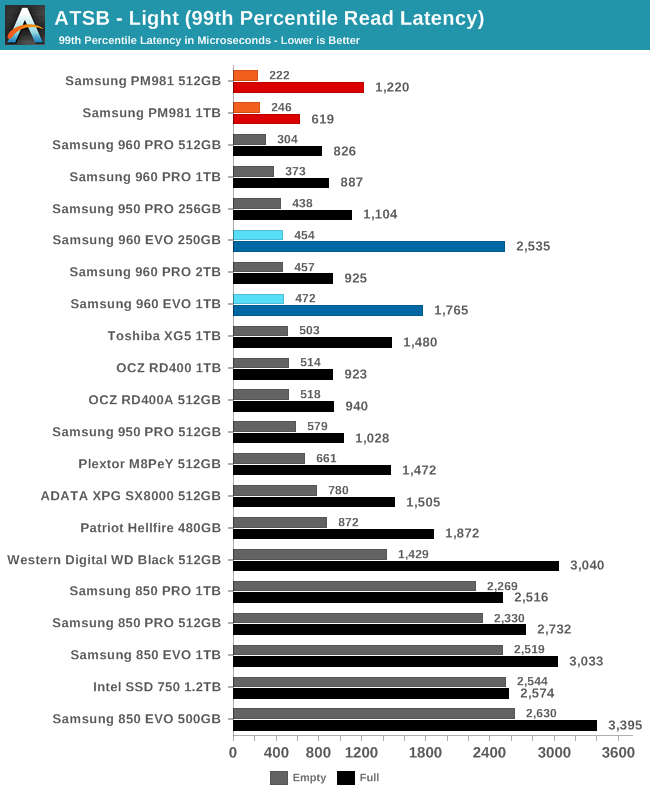
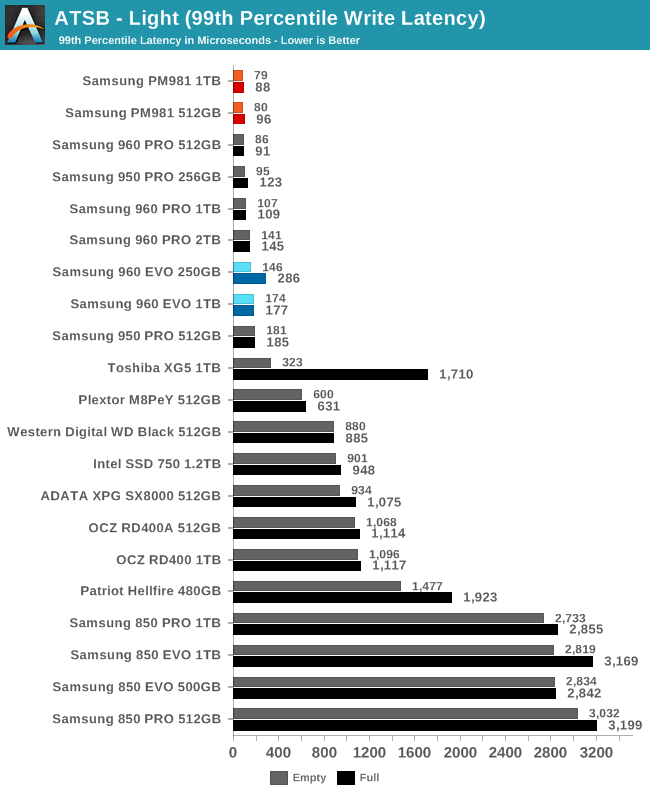
The 99th percentile read latency of the PM981s is record-setting when the Light test is run on an empty drive, but only the 1TB sets a record when the test is run on a full drive. The 99th percentile write latency is excellent on both drives in either test scenario.
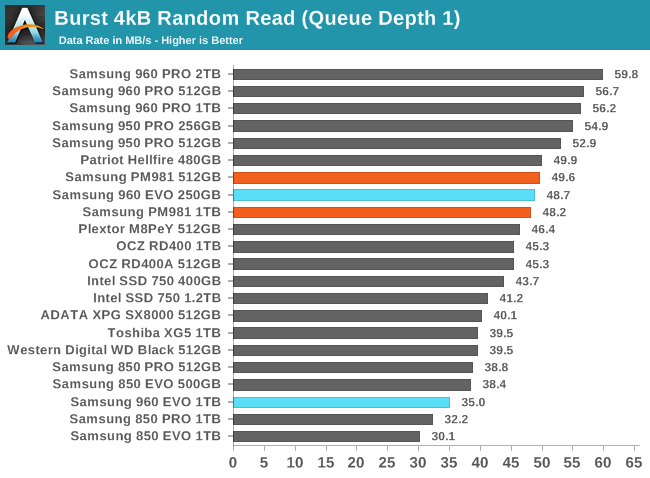
The burst random read performance of the Samsung PM981 is great by the standards of TLC SSDs, but is surpassed by several MLC-based drives, including the Phison E7-based Patriot Hellfire with planar MLC NAND.
Our sustained random read performance is similar to the random read test from our 2015 test suite: queue depths from 1 to 32 are tested, and the average performance and power efficiency across QD1, QD2 and QD4 are reported as the primary scores. Each queue depth is tested for one minute or 32GB of data transferred, whichever is shorter. After each queue depth is tested, the drive is given up to one minute to cool off so that the higher queue depths are unlikely to be affected by accumulated heat build-up. The individual read operations are again 4kB, and cover a 64GB span of the drive.
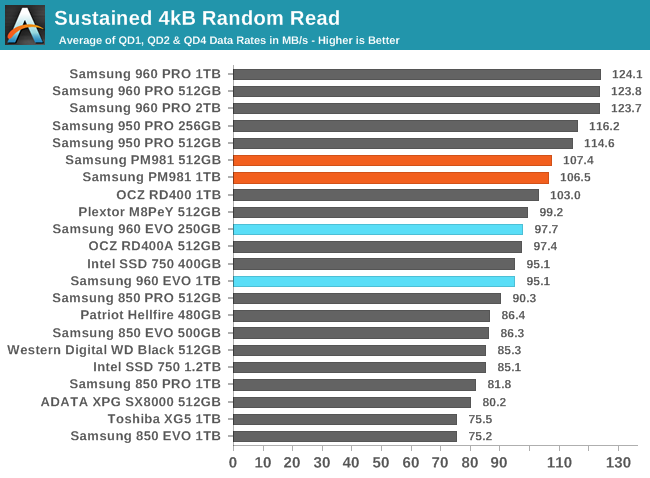
On the longer random read test that includes some higher queue depths, the PM981 comes a bit closer to the standard set by Samsung's MLC drives, and it outperforms all the non-Samsung drives.
Both capacities of the PM981 show performance scaling with queue depth in the typical manner for a high-performance drive, though the 512GB model has passed an inflection point by QD32 and is approaching saturation.
Random Write Performance
Our test of random write burst performance is structured similarly to the random read burst test, but each burst is only 4MB and the total test length is 128MB. The 4kB random write operations are distributed over a 16GB span of the drive, and the operations are issued one at a time with no queuing.
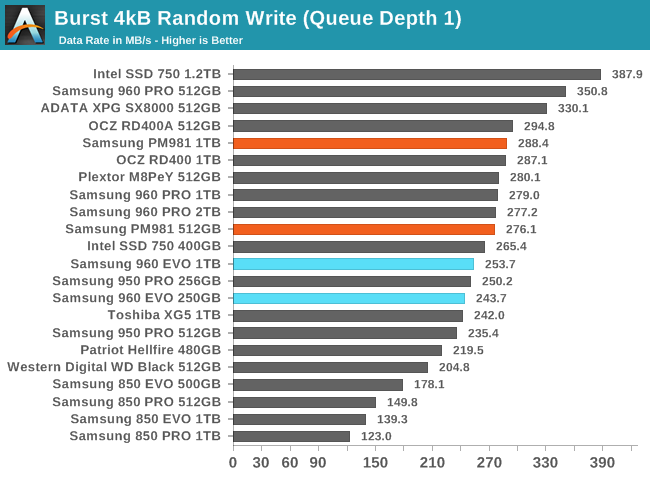
There are a few MLC-based SSDs that offer substantially higher burst random write performance than the Samsung PM981, but it is on par with most high-end drives including the Samsung 960 PRO.
As with the sustained random read test, our sustained 4kB random write test runs for up to one minute or 32GB per queue depth, covering a 64GB span of the drive and giving the drive up to 1 minute of idle time between queue depths to allow for write caches to be flushed and for the drive to cool down.
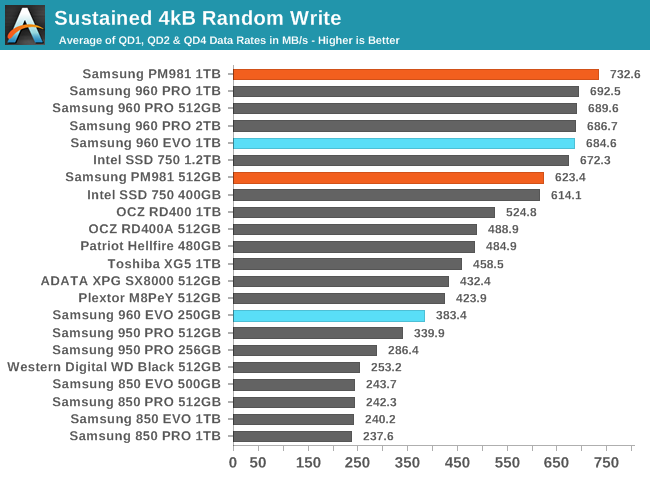
On the longer random write test, the 1TB PM981 stands out with clearly higher performance than the Samsung 960 series could manage. The 512GB PM981 is slower but still definitely performing like a high-end drive.
The random write performance of the 1TB PM981 scales very well with increasing queue depth. As compared to the Samsung 960 series, it also reaches its plateau around QD8, but is providing much higher throughput by that point. The 512GB model runs out of SLC cache during portions of this test so its performance is much lower and less steady.
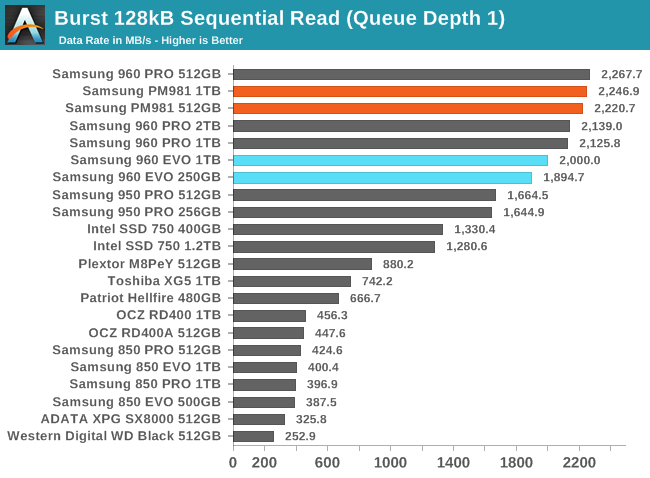
The burst sequential read performance of the Samsung PM981 doesn't quite set a new record, but it's pretty close to the top performer and very far ahead of any non-Samsung drive.
Our test of sustained sequential reads uses queue depths from 1 to 32, with the performance and power scores computed as the average of QD1, QD2 and QD4. Each queue depth is tested for up to one minute or 32GB transferred, from a drive containing 64GB of data.
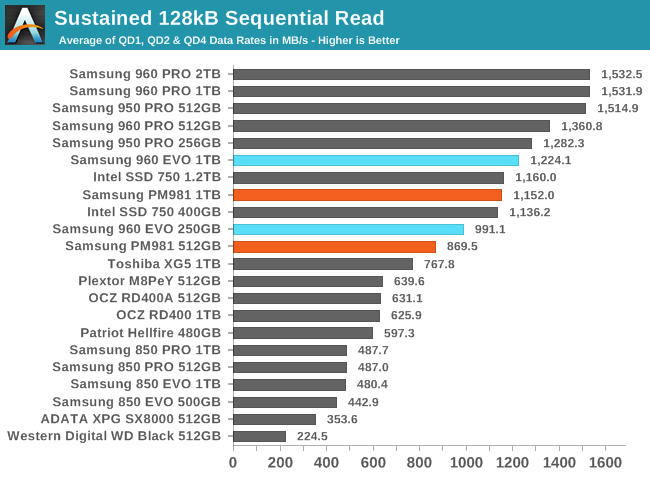
On the longer test with higher queue depths, the best MLC-based drives pull ahead of the PM981 and even the 960 EVO has a slight advantage.
The 1TB PM981 starts out with almost the same performance as the 1TB 960 EVO, but the PM981's performance falls off a bit during the first half of the test while the 960 EVO remains steady. The 512GB PM981 doesn't experience any slowdown, but it is slower than the 1TB model throughout the test.
Sequential Write Performance
Our test of sequential write burst performance is structured identically to the sequential read burst performance test save for the direction of the data transfer. Each burst writes 128MB as 128kB operations issued at QD1, for a total of 1GB of data written to a drive containing 16GB of data.
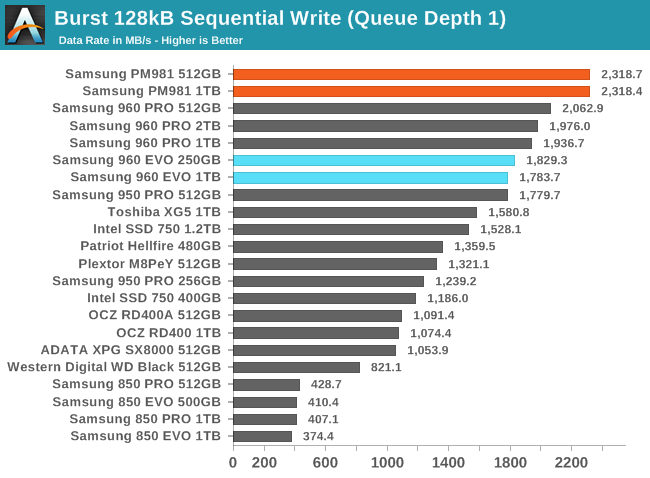
The PM981s both deliver the same record-setting burst sequential write performance that is a marked improvement over the best of Samsung's last generation, and far ahead of any competing flash-based SSD.
Our test of sustained sequential writes is structured identically to our sustained sequential read test, save for the direction of the data transfers. Queue depths range from 1 to 32 and each queue depth is tested for up to one minute or 32GB, followed by up to one minute of idle time for the drive to cool off and perform garbage collection. The test is confined to a 64GB span of the drive.
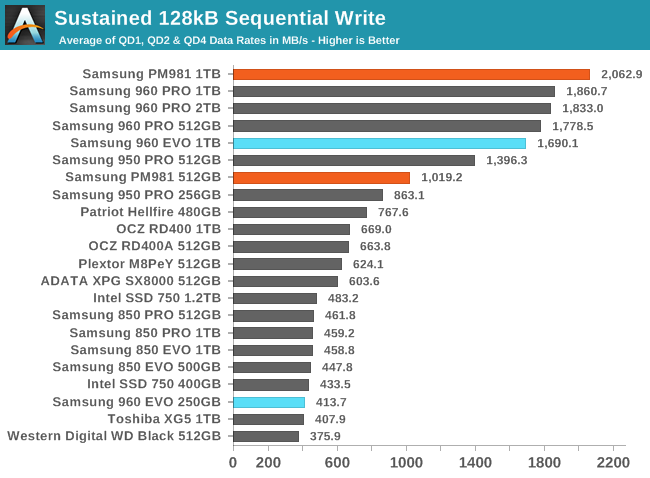
On the longer sequential write test, the 512GB PM981 falls behind most of the rest of the Samsung drives but the 1TB model remains on top, ahead of even the 960 PROs.
The 1TB PM981 hits full write speed at QD2 and stays there for the rest of the test, holding on to its lead over the 960 PRO. The 512GB PM981 runs out of SLC write cache early on and its performance bounces around with the garbage collection cycles.
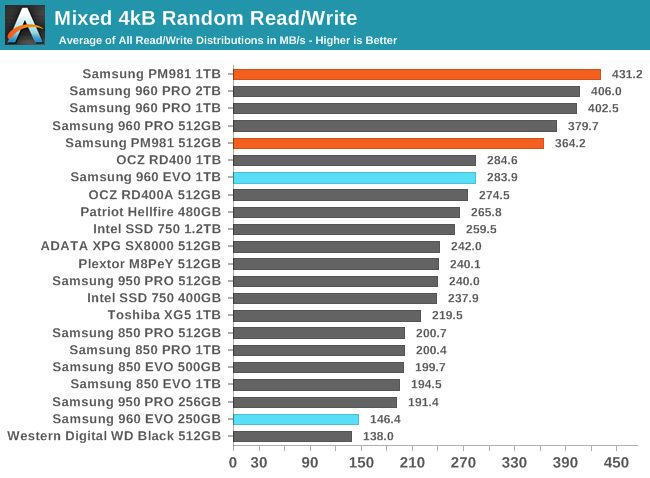
The mixed random I/O performance of the Samsung PM981 is a big improvement over last generation's 960 EVO. The 1TB PM981 beats out even the MLC-based 960 PRO, while the smaller 512GB PM981 is a bit slower than the 960 PRO of the same size.
As the proportion of writes in the mixed workload increases, the PM981 steadily gains performance, pulling further and further ahead of the 960 EVO. The 512GB PM981's main weakness is that its performance doesn't hit quit as high a peak during the final phases of the test when the workload is almost entirely random writes.
Mixed Sequential Performance
Our test of mixed sequential reads and writes differs from the mixed random I/O test by performing 128kB sequential accesses rather than 4kB accesses at random locations, and the sequential test is conducted at queue depth 1. The range of mixes tested is the same, and the timing and limits on data transfers are also the same as above.
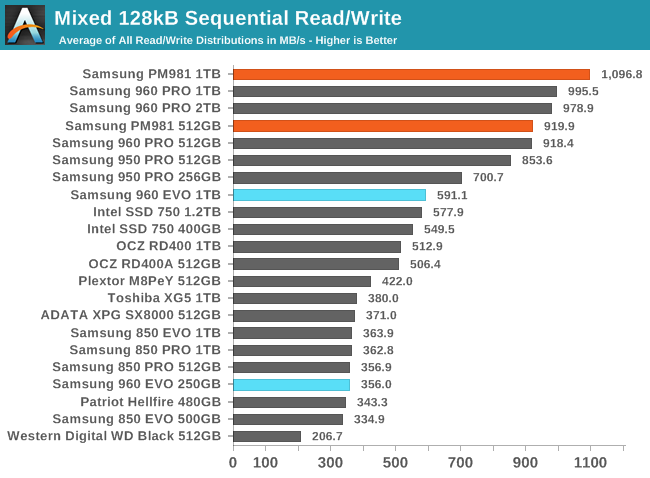
The 512GB PM981 matches the mixed sequential performance of the MLC-based 512GB 960 PRO, while the 1TB PM981 is substantially faster than the 960 PRO or any other flash-based SSD.
The Samsung 960 PRO 1TB outperforms the 1TB PM981 during the early read-heavy phases of the mixed sequential test, but then its performance drops off precipitously while the PM981 retains its performance until later in the test. The 512GB PM981 averages almost exactly the same performance as the 512GB 960 PRO, but with substantial differences in the details: the 960 PRO is faster at either end of the test, but the PM981 has a significant advantage for more even mixes of reads and writes.