


 ' alt='위대한 인류최대 수퍼로켓 '스타십(Spacex Starship)' 발사 성공 by 인공지능' />
, 전세계 일자리 파괴 가속화 “육체노동만 살아남나?”<br>")
’ 오픈<br>")


![삼성, 잃어버린 10년 [풀영상] | 창 458회 (KBS 24.03.12) by 인공지능](https://raptor-hw.net/xe/files/thumbnails/453/204/271x205.crop.jpg "삼성, 잃어버린 10년 [풀영상] | 창 458회 (KBS 24.03.12)<br>")


 다운로드 및 설치<br>")


<br>")
<br>")


| Processor | Clock Speed | L2 Cache | L3 Cache | TDP | Price |
| AMD Phenom II X4 965 BE | 3.4GHz | 2MB | 6MB | 140W | $245 |
| AMD Phenom II X4 955 BE | 3.2GHz | 2MB | 6MB | 125W | $245 |
| AMD Phenom II X4 945 | 3.0GHz | 2MB | 6MB | 125W | $225 |
| AMD Phenom II X3 720 BE | 2.8GHz | 1.5MB | 6MB | 95W | $145 |
| AMD Phenom II X2 550 BE | 3.1GHz | 1MB | 6MB | 80W | $105 |
| AMD Athlon II X4 630 | 2.8GHz | 2MB | 0MB | 95W | $122 |
| AMD Athlon II X4 620 | 2.6GHz | 2MB | 0MB | 95W | $99 |
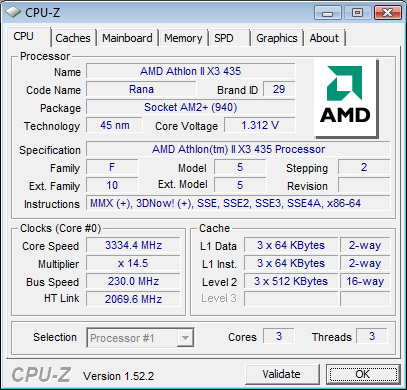
| AMD Athlon II X3 435 | 2.9GHz | 1.5MB | 0MB | 95W | $87 |
| AMD Athlon II X3 425 | 2.7GHz | 1.5MB | 0MB | 95W | $76 |
| AMD Athlon II X2 250 | 3.0GHz | 2MB | 0MB | 65W | $87 |
| AMD Athlon II X2 245 | 2.9GHz | 2MB | 0MB | 65W | $66 |
| AMD Athlon II X2 240 | 2.8GHz | 2MB | 0MB | 65W | $60 |
| Processor | Clock Speed | L2 Cache | TDP | Price | Premium |
| AMD Athlon II X4 605e | 2.3GHz | 2MB | 45W | $143 | +$44 |
| AMD Athlon II X4 600e | 2.2GHz | 2MB | 45W | $133 | +$34 |
| AMD Athlon II X3 405e | 2.3GHz | 1.5MB | 45W | $102 | +$26 |
| AMD Athlon II X3 400e | 2.2GHz | 1.5MB | 45W | $97 | +$21 |
| AMD Athlon II X2 240e | 2.8GHz | 2MB | 45W | $77 | +$17 |
| AMD Athlon II X2 235e | 2.7GHz | 2MB | 45W | $69 | +$9 |
The Test
| Motherboard: | Intel DX58SO (Intel X58) Intel DX48BT2 (Intel X48) Gigabyte GA-MA790FX-UD5P (AMD 790FX) |
| Chipset: | Intel X48 Intel X58 AMD 790FX |
| Chipset Drivers: | Intel 9.1.1.1015 (Intel) AMD Catalyst 8.12 |
| Hard Disk: | Intel X25-M SSD (80GB) |
| Memory: | Qimonda DDR3-1066 4 x 1GB (7-7-7-20) Corsair DDR3-1333 4 x 1GB (7-7-7-20) Patriot Viper DDR3-1333 2 x 2GB (7-7-7-20) |
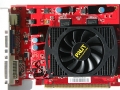
| Video Card: | eVGA GeForce GTX 280 |
| Video Drivers: | NVIDIA ForceWare 180.43 (Vista64) NVIDIA ForceWare 178.24 (Vista32) |
| Desktop Resolution: | 1920 x 1200 |
| OS: | Windows Vista Ultimate 32-bit (for SYSMark) Windows Vista Ultimate 64-bit |
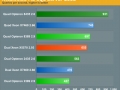
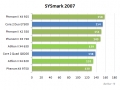
SYSMark 2007 Performance
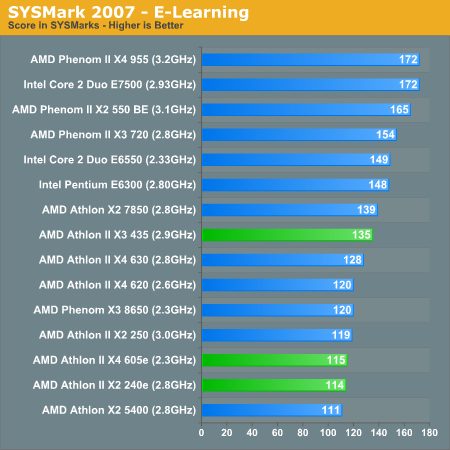
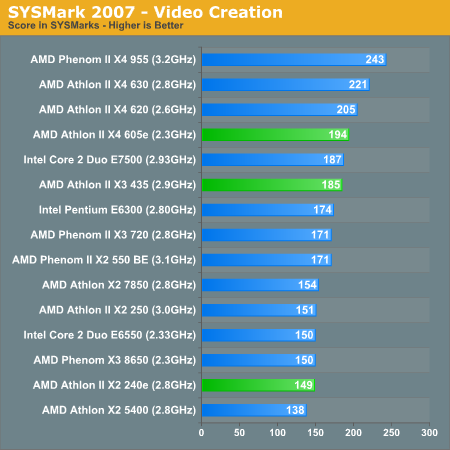
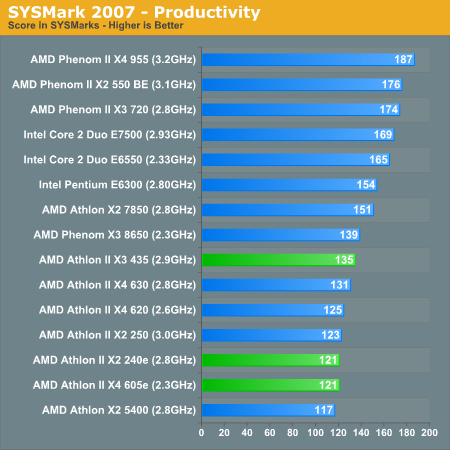
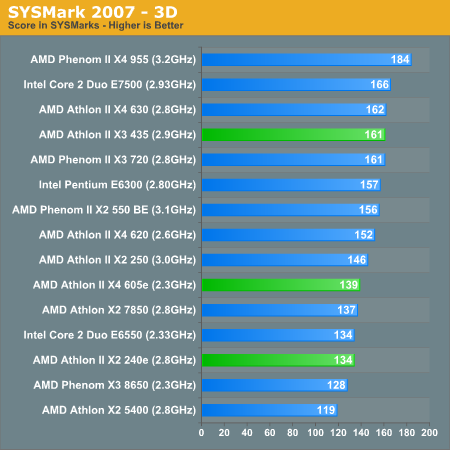
Our journey starts with SYSMark 2007, the only all-encompassing performance suite in our review today. The idea here is simple: one benchmark to indicate the overall performance of your machine.
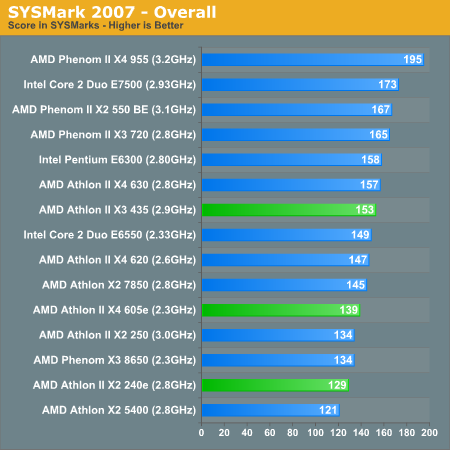
Overall performance under SYSMark is pretty balanced for the Athlon II X3 435. It's faster than the $99 quad-core (620) but slightly slower than the quad core 630. We're slower than the old triple core Phenom II X3 720 though.
Adobe Photoshop CS4 Performance
To measure performance under Photoshop CS4 we turn to the Retouch Artists’ Speed Test. The test does basic photo editing; there are a couple of color space conversions, many layer creations, color curve adjustment, image and canvas size adjustment, unsharp mask, and finally a gaussian blur performed on the entire image.
The whole process is timed and thanks to the use of Intel's X25-M SSD as our test bed hard drive, performance is far more predictable than back when we used to test on mechanical disks.
Time is reported in seconds and the lower numbers mean better performance. The test is multithreaded and can hit all four cores in a quad-core machine.
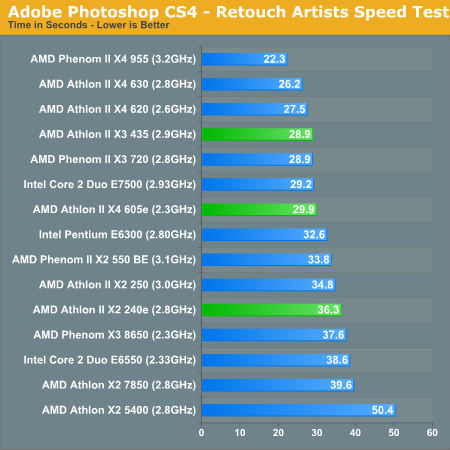
Photoshop performance of our triple core competitor is slower than the lower clocked X4 620. It is however the exact same speed as the Phenom II X3 720.
DivX 8.5.3 with Xmpeg 5.0.3
Our DivX test is the same DivX / XMpeg 5.03 test we've run for the past few years now, the 1080p source file is encoded using the unconstrained DivX profile, quality/performance is set balanced at 5 and enhanced multithreading is enabled:
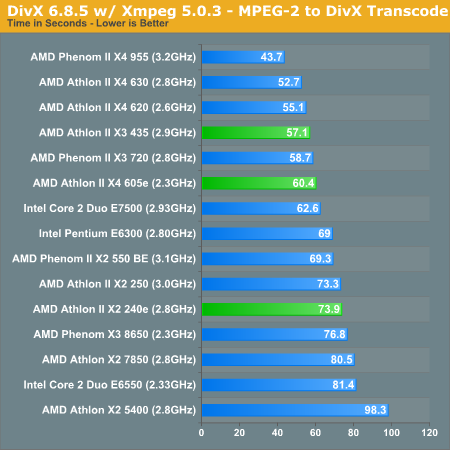
DivX encoding performance is hot on the heels of the Athlon II X4 620, but still slower. Once more we're about the same speed as the Phenom II X3 720.
x264 HD Video Encoding Performance
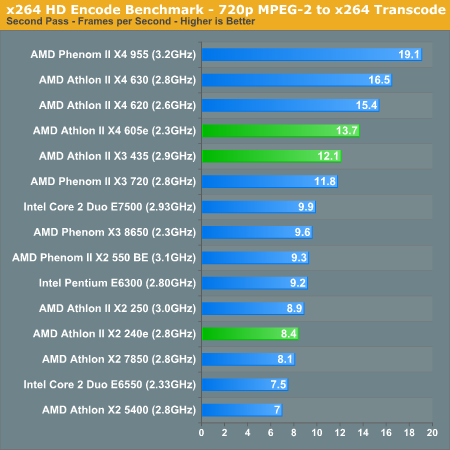
Graysky's x264 HD test uses the publicly available x264 codec (open source alternative to H.264) to encode a 4Mbps 720p MPEG-2 source. The focus here is on quality rather than speed, thus the benchmark uses a 2-pass encode and reports the average frame rate in each pass.
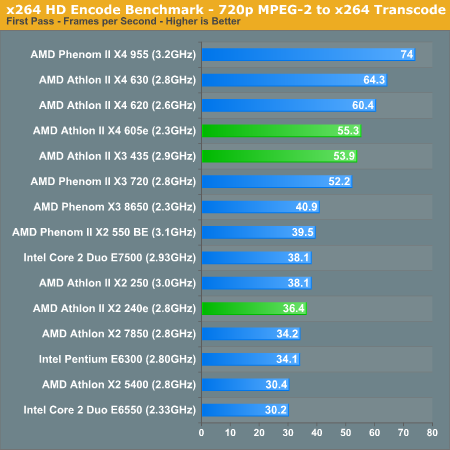
x264 encoding performance is noticeably slower than the quad-core offerings. Even the 2.3GHz 605e is faster than the X3 435. Compared to the equivalently priced dual-core options from Intel however, the Athlon II X3 435 is without a doubt the chip to get. If you're encoding video however, you're probably better springing for the $99 quad-core.
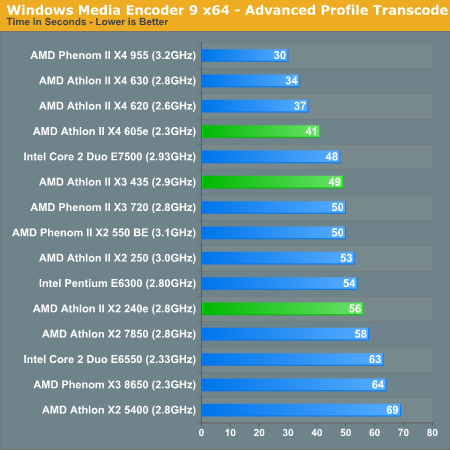
Windows Media Encoder 9 x64 Advanced Profile
In order to be codec agnostic we've got a Windows Media Encoder benchmark looking at the same sort of thing we've been doing in the DivX and x264 tests, but using WME instead.
3dsmax 9 - SPECapc 3dsmax CPU Rendering Test
Today's desktop processors are more than fast enough to do professional level 3D rendering at home. To look at performance under 3dsmax we ran the SPECapc 3dsmax 8 benchmark (only the CPU rendering tests) under 3dsmax 9 SP1. The results reported are the rendering composite scores:
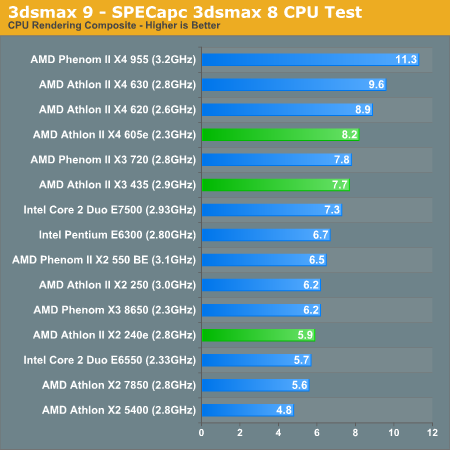
Compared to the Intel dual-core options, the Athlon II X3 435 is a definite winner here. It's got the core count and clock speed to beat the old Penryn derivatives. Its biggest competition comes from its own family, the Athlon II X4 620 is the better buy here.
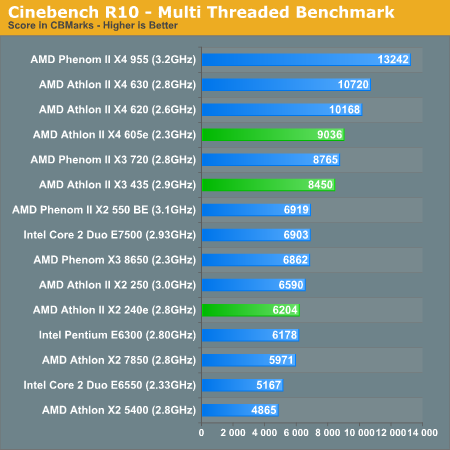
Cinebench R10
Created by the Cinema 4D folks we have Cinebench, a popular 3D rendering benchmark that gives us both single and multi-threaded 3D rendering results.
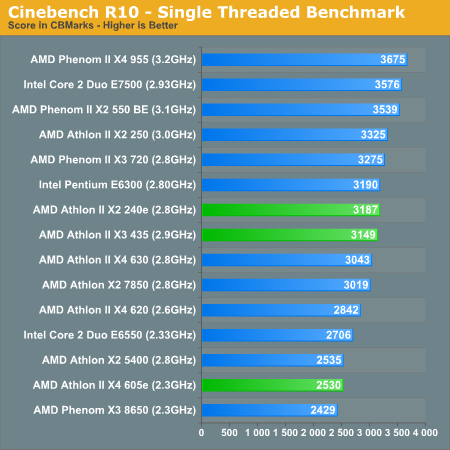
As I've been mentioning this entire time, the Athlon II X3 435 doesn't really sacrifice clock speed in its three-core configuration. At 2.9GHz even its single threaded performance is comparable to the Pentium E6300. Run a multithreaded app however and the performance goes from parity to leading:
POV-Ray 3.73 beta 23 Ray Tracing Performance
POV-Ray is a popular, open-source raytracing application that also doubles as a great tool to measure CPU floating point performance.
I ran the SMP benchmark in beta 23 of POV-Ray 3.73. The numbers reported are the final score in pixels per second.
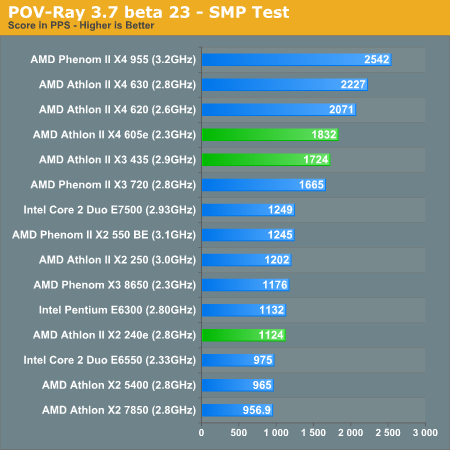
The POV-Ray results echo what we've been seeing thus far, vs. Intel there's no contest - the 435 is the better value. Compared to the quad-core Athlon IIs however, the 435 isn't very good.
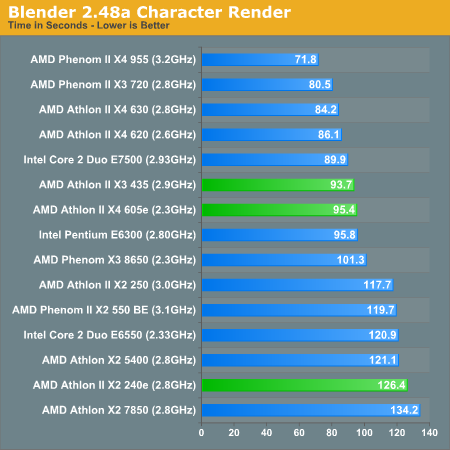
Blender 2.48a
Blender is an open source 3D modeling application. Our benchmark here simply times how long it takes to render a character that comes with the application.
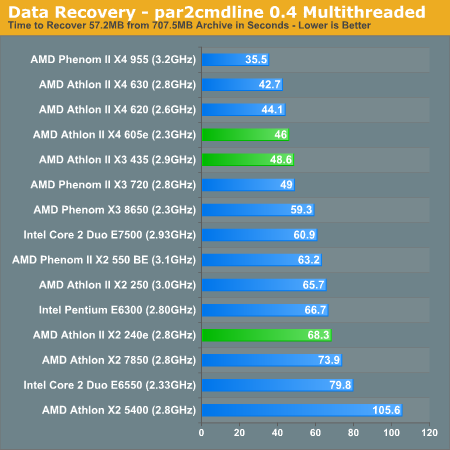
PAR2 Multithreaded Archive Recovery Performance
Par2 is an application used for reconstructing downloaded archives. It can generate parity data from a given archive and later use it to recover the archive
Chuchusoft took the source code of par2cmdline 0.4 and parallelized it using Intel’s Threading Building Blocks 2.1. The result is a version of par2cmdline that can spawn multiple threads to repair par2 archives. For this test we took a 708MB archive, corrupted nearly 60MB of it, and used the multithreaded par2cmdline to recover it. The scores reported are the repair and recover time in seconds.
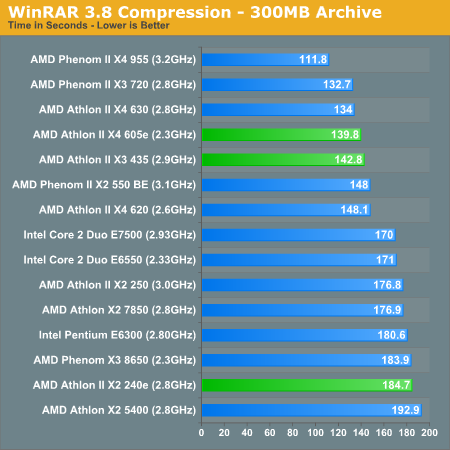
WinRAR - Archive Creation
Our WinRAR test simply takes 300MB of xe/files and compresses them into a single RAR archive using the application's default settings. We're not doing anything exotic here, just looking at the impact of CPU performance on creating an archive:
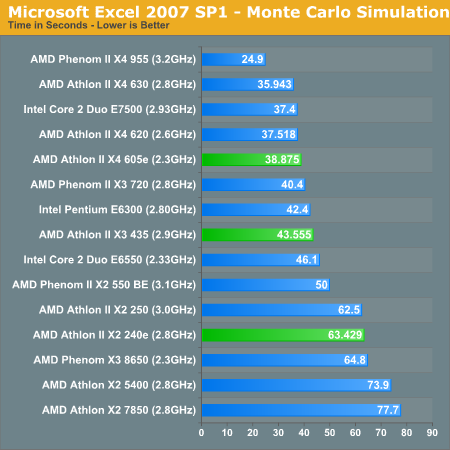
Microsoft Excel 2007
Excel can be a very powerful mathematical tool. In this benchmark we're running a Monte Carlo simulation on a very large spreadsheet of stock pricing data.
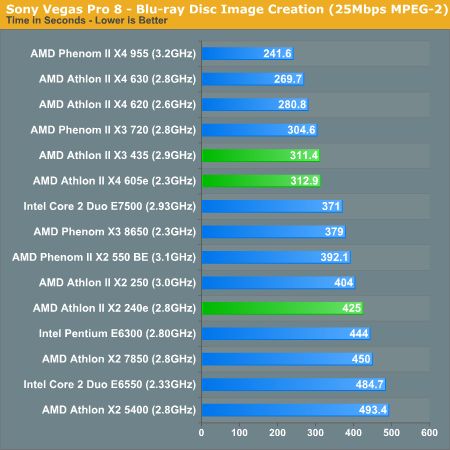
Sony Vegas Pro 8: Blu-ray Disc Creation
Although technically a test simulating the creation of a Blu-ray disc, the majority of the time in our Sony Vegas Pro benchmark is spend encoding the 25Mbps MPEG-2 video stream and not actually creating the Blu-ray disc itself.
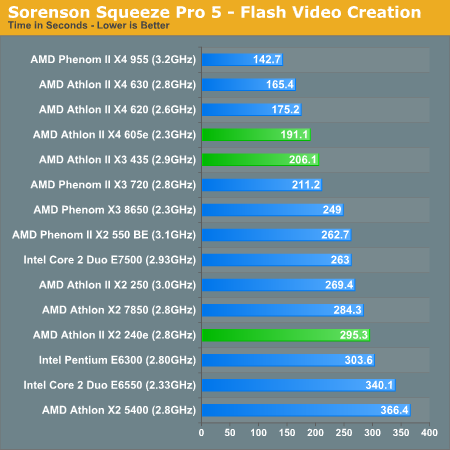
Sorenson Squeeze: FLV Creation
Another video related benchmark, we're using Sorenson Squeeze to convert regular videos into Flash videos for use on websites.
Fallout 3 Game Performance
Bethesda’s latest game uses an updated version of the Gamebryo engine (Oblivion). This benchmark takes place immediately outside Vault 101. The character walks away from the vault through the Springvale ruins. The benchmark is measured manually using FRAPS.
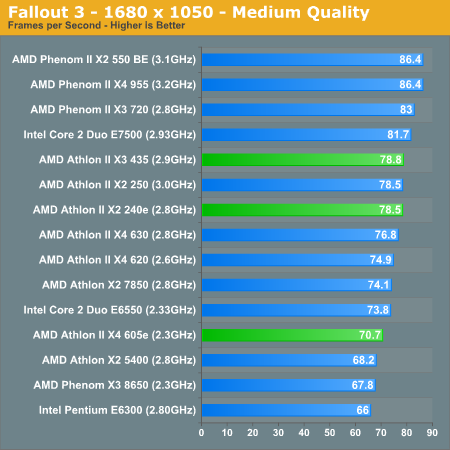
Finally! We have a test where the Athlon II X3 435's clock speed gives it the advantage over the 620. If you're a gamer but want more cores, the 435 is a good balance of performance in existing games but better than dual-core performance in well threaded apps.
Left 4 Dead
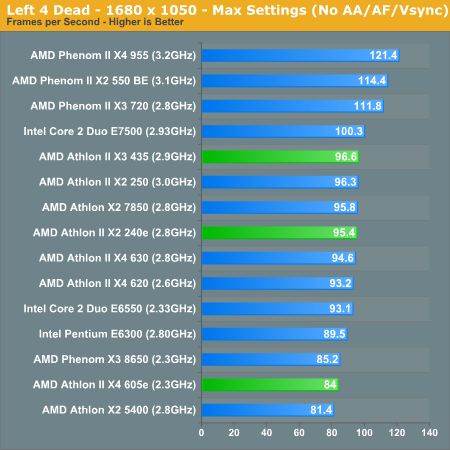
I've got no complaints about the X3's performance in Left 4 Dead either, it's nearly as fast as the more expensive Core 2 Duo E7500 (and with a much tastier upgrade path).
FarCry 2 Multithreaded Game Performance
FarCry 2 ships with the most impressive benchmark tool we’ve ever seen in a PC game. Part of this is due to the fact that Ubisoft actually tapped a number of hardware sites (AnandTech included) from around the world to aid in the planning for the benchmark.
For our purposes we ran the CPU benchmark included in the latest patch:
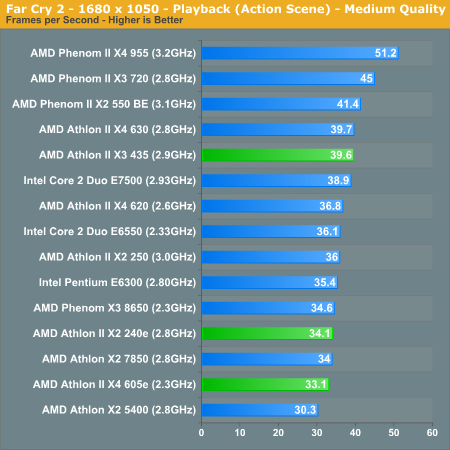
Even in our most heavily threaded game test, the X3 435 is a bit faster than the 620.
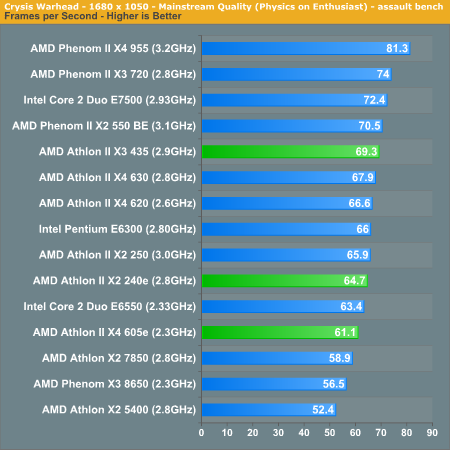
Crysis Warhead
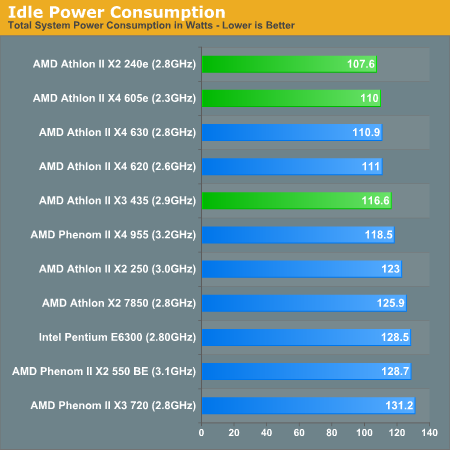
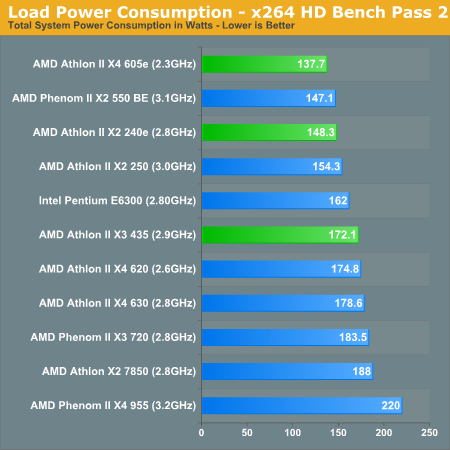
Power Consumption
Thanks to its higher clock speed the Athlon II X3 435 draws a little more power than the 620 at idle, but uses a little less under load. The new energy efficient chips can't be touched. Personally I wouldn't spring for them, but if you're looking to upgrade a building full of machines and want as much power reduction as possible the e series can deliver.
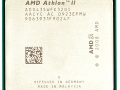
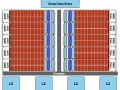
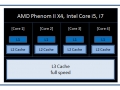
AMD의 신형 45나노 트리플코어 라나 435는 2.9GHz라는 높은 클럭의 이점으로, 구형? 트리플코어 헤카 720보다 인코딩 및 그래픽류등의 일반 어플리케이션에서 상회하는 성능을 나타내나 프로푸스와 마찬가지로 L3 캐쉬의 부재에 따라 게이밍 성능은 인텔의 울프데일 7500급 정도의 성능, AMD의 프로푸스 630 이상의 성능을 나타낸다.
또 한가지 확인이 가능한 부분은 헤카 720의 게이밍 부분에서의 막강한 퍼포먼스를 여전히 확인할수 있고, L3캐쉬가 제거된 다중코어들은 일반 어플리케이션에서는 강한 모습을 보이나 게이밍 성능은 만족스럽지 못한 성능을 내는것을 다시 한번 확인할수 있다.
라나 435는 아이들시 프로푸스계열보다 높은 전력소모를 나타내고, 로드시에는 프로푸스보다 적은 전력소모를 나타낸다. 현재의 라나 가격대를 고려할때 게이밍쪽으로 시스템을 구성한다면 프로푸스보다는 라나가 합리적인 선택이며, 일반적인 범용의 목적이라면 프로푸스를 선택할수 있다. 그리고 10만 중반선의 절대적인 게이밍 프로세서는 여전히 헤카가 자리를 유지하고 있다.


프로푸스의 트리플코어 버젼이군요