


, 전세계 일자리 파괴 가속화 “육체노동만 살아남나?”<br>")
<br>")

’ 오픈<br>")


<br>")


 ' alt='위대한 인류최대 수퍼로켓 '스타십(Spacex Starship)' 발사 성공 by 인공지능' />
 다운로드 및 설치<br>")

![삼성, 잃어버린 10년 [풀영상] | 창 458회 (KBS 24.03.12) by 인공지능](https://raptor-hw.net/xe/files/thumbnails/453/204/271x205.crop.jpg "삼성, 잃어버린 10년 [풀영상] | 창 458회 (KBS 24.03.12)<br>")


| AMD Radeon RX Series Specification Comparison | ||||||
| AMD Radeon RX 580 (8GB) | AMD Radeon RX 570 | AMD Radeon RX 480 (8GB) | AMD Radeon RX 470 | |||
| Stream Processors | 2304 (36 CUs) | 2048 (32 CUs) | 2304 (36 CUs) | 2048 (32 CUs) | ||
| Texture Units | 144 | 128 | 144 | 128 | ||
| ROPs | 32 | 32 | 32 | 32 | ||
| Base Clock | 1257MHz | 1168MHz | 1120MHz | 926MHz | ||
| Boost Clock | 1340MHz | 1244MHz | 1266MHz | 1206MHz | ||
| Memory Clock | 8 Gbps GDDR5 | 7Gbps GDDR5 | 8 Gbps GDDR5 | 6.6Gbps GDDR5 | ||
| Memory Bus Width | 256-bit | 256-bit | 256-bit | 256-bit | ||
| VRAM | 8GB | 4GB | 8GB | 4GB | ||
| Transistor Count | 5.7B | 5.7B | 5.7B | 5.7B | ||
| Typical Board Power | 185W | 150W | 150W | 120W | ||
| Manufacturing Process | GloFo 14nm | GloFo 14nm | GloFo 14nm | GloFo 14nm | ||
| Architecture | GCN 4 | GCN 4 | GCN 4 | GCN 4 | ||
| GPU | Polaris 10 | Polaris 10 | Polaris 10 | Polaris 10 | ||
| Launch Date | 04/18/2017 | 04/18/2017 | 06/29/2016 | 08/04/2016 | ||
| Launch Price | $229 | $169 | $239 | $179 | ||
라데온 RX 580 & RX 570 시리즈는 기존 480 / 470 시리즈에서 스트림 프로세서, 텍스처 유닛, ROP 동일, 베이스 클럭 및 부스트 클럭 상승, 클럭 상승에 따른 TDP 증가
가격조정 : 480 = 239달러, 580 = 229달러 / 470 = 179달러, 570 = 169달러
| Spring 2017 GPU Pricing Comparison | |||||
| AMD | Price | NVIDIA | |||
| Radeon RX 580 (8GB) | $229 | GeForce GTX 1060 (6GB) | |||
| Radeon RX 580 (4GB) | $199 | ||||
| Radeon RX 570 | $169/$179 | GeForce GTX 1060 3GB | |||
| $129 | GeForce GTX 1050 Ti | ||||
| Radeon RX 460 | $99/$104 | GeForce GTX 1050 | |||
라데온 VS 지포스 포지션 테이블, RX 580은 지포스 1060 (6GB) 상대, 570은 1060 (3GB) 모델 상대
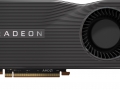
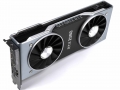
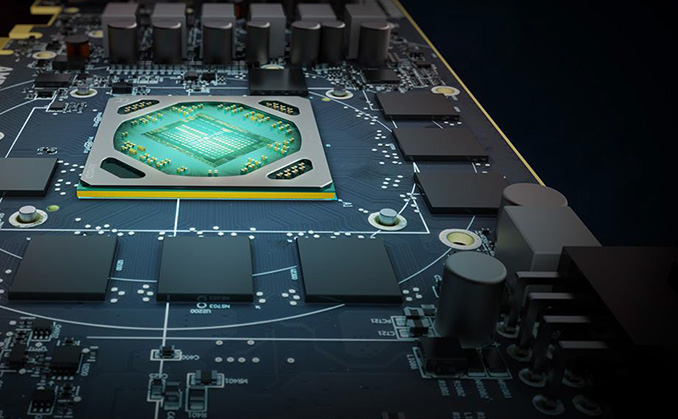
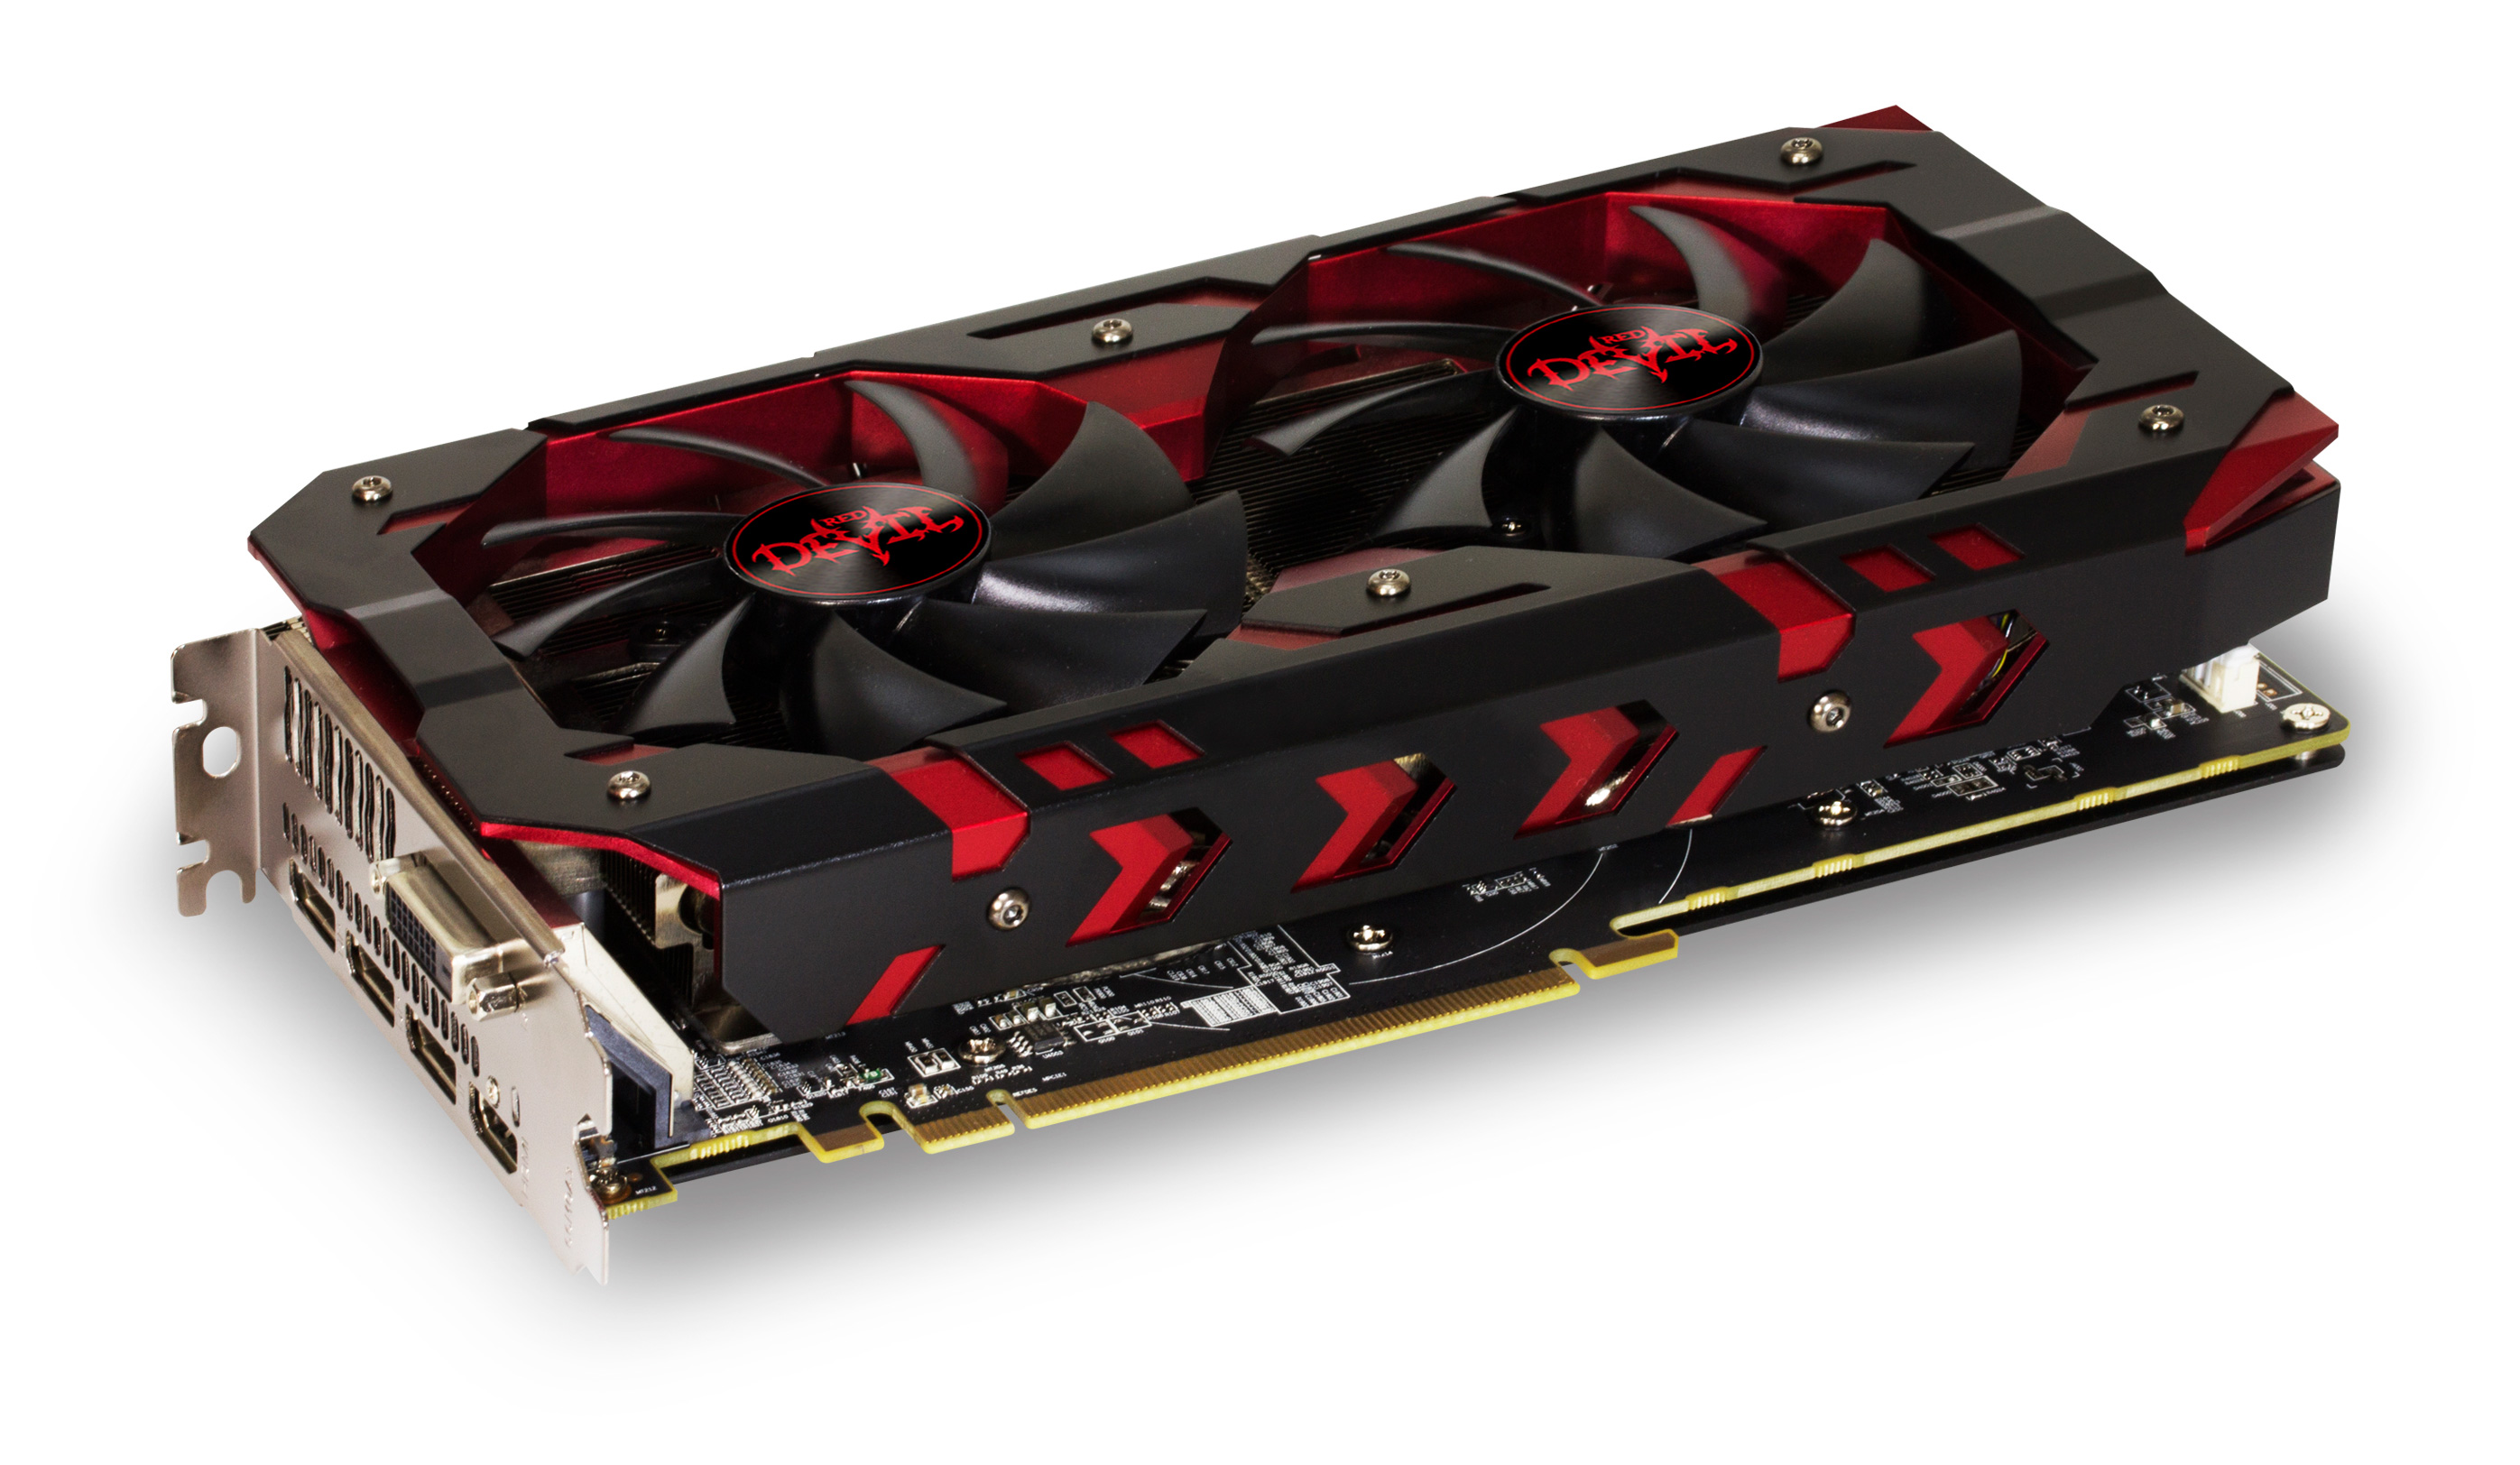
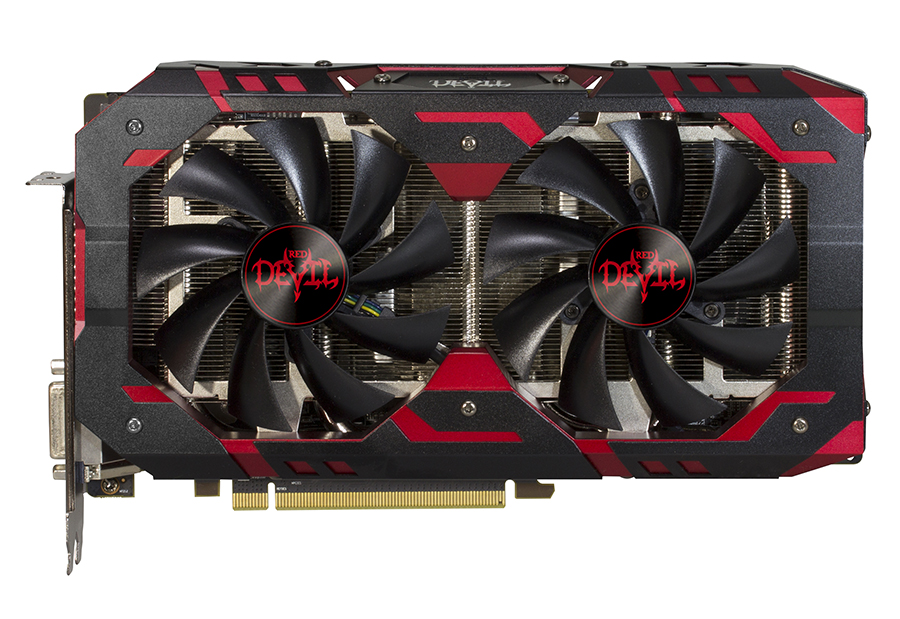
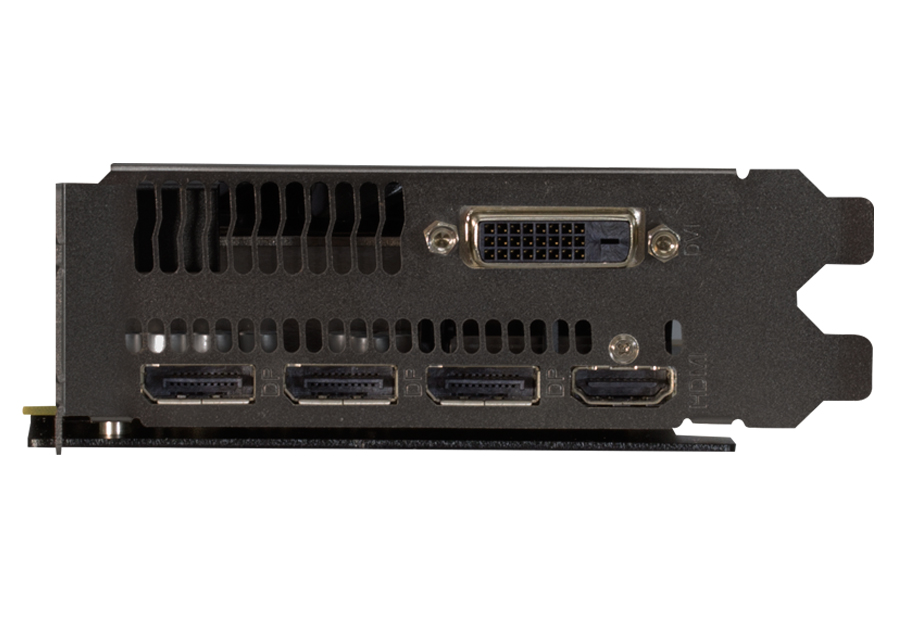
PowerColor Red Devil Radeon RX 580
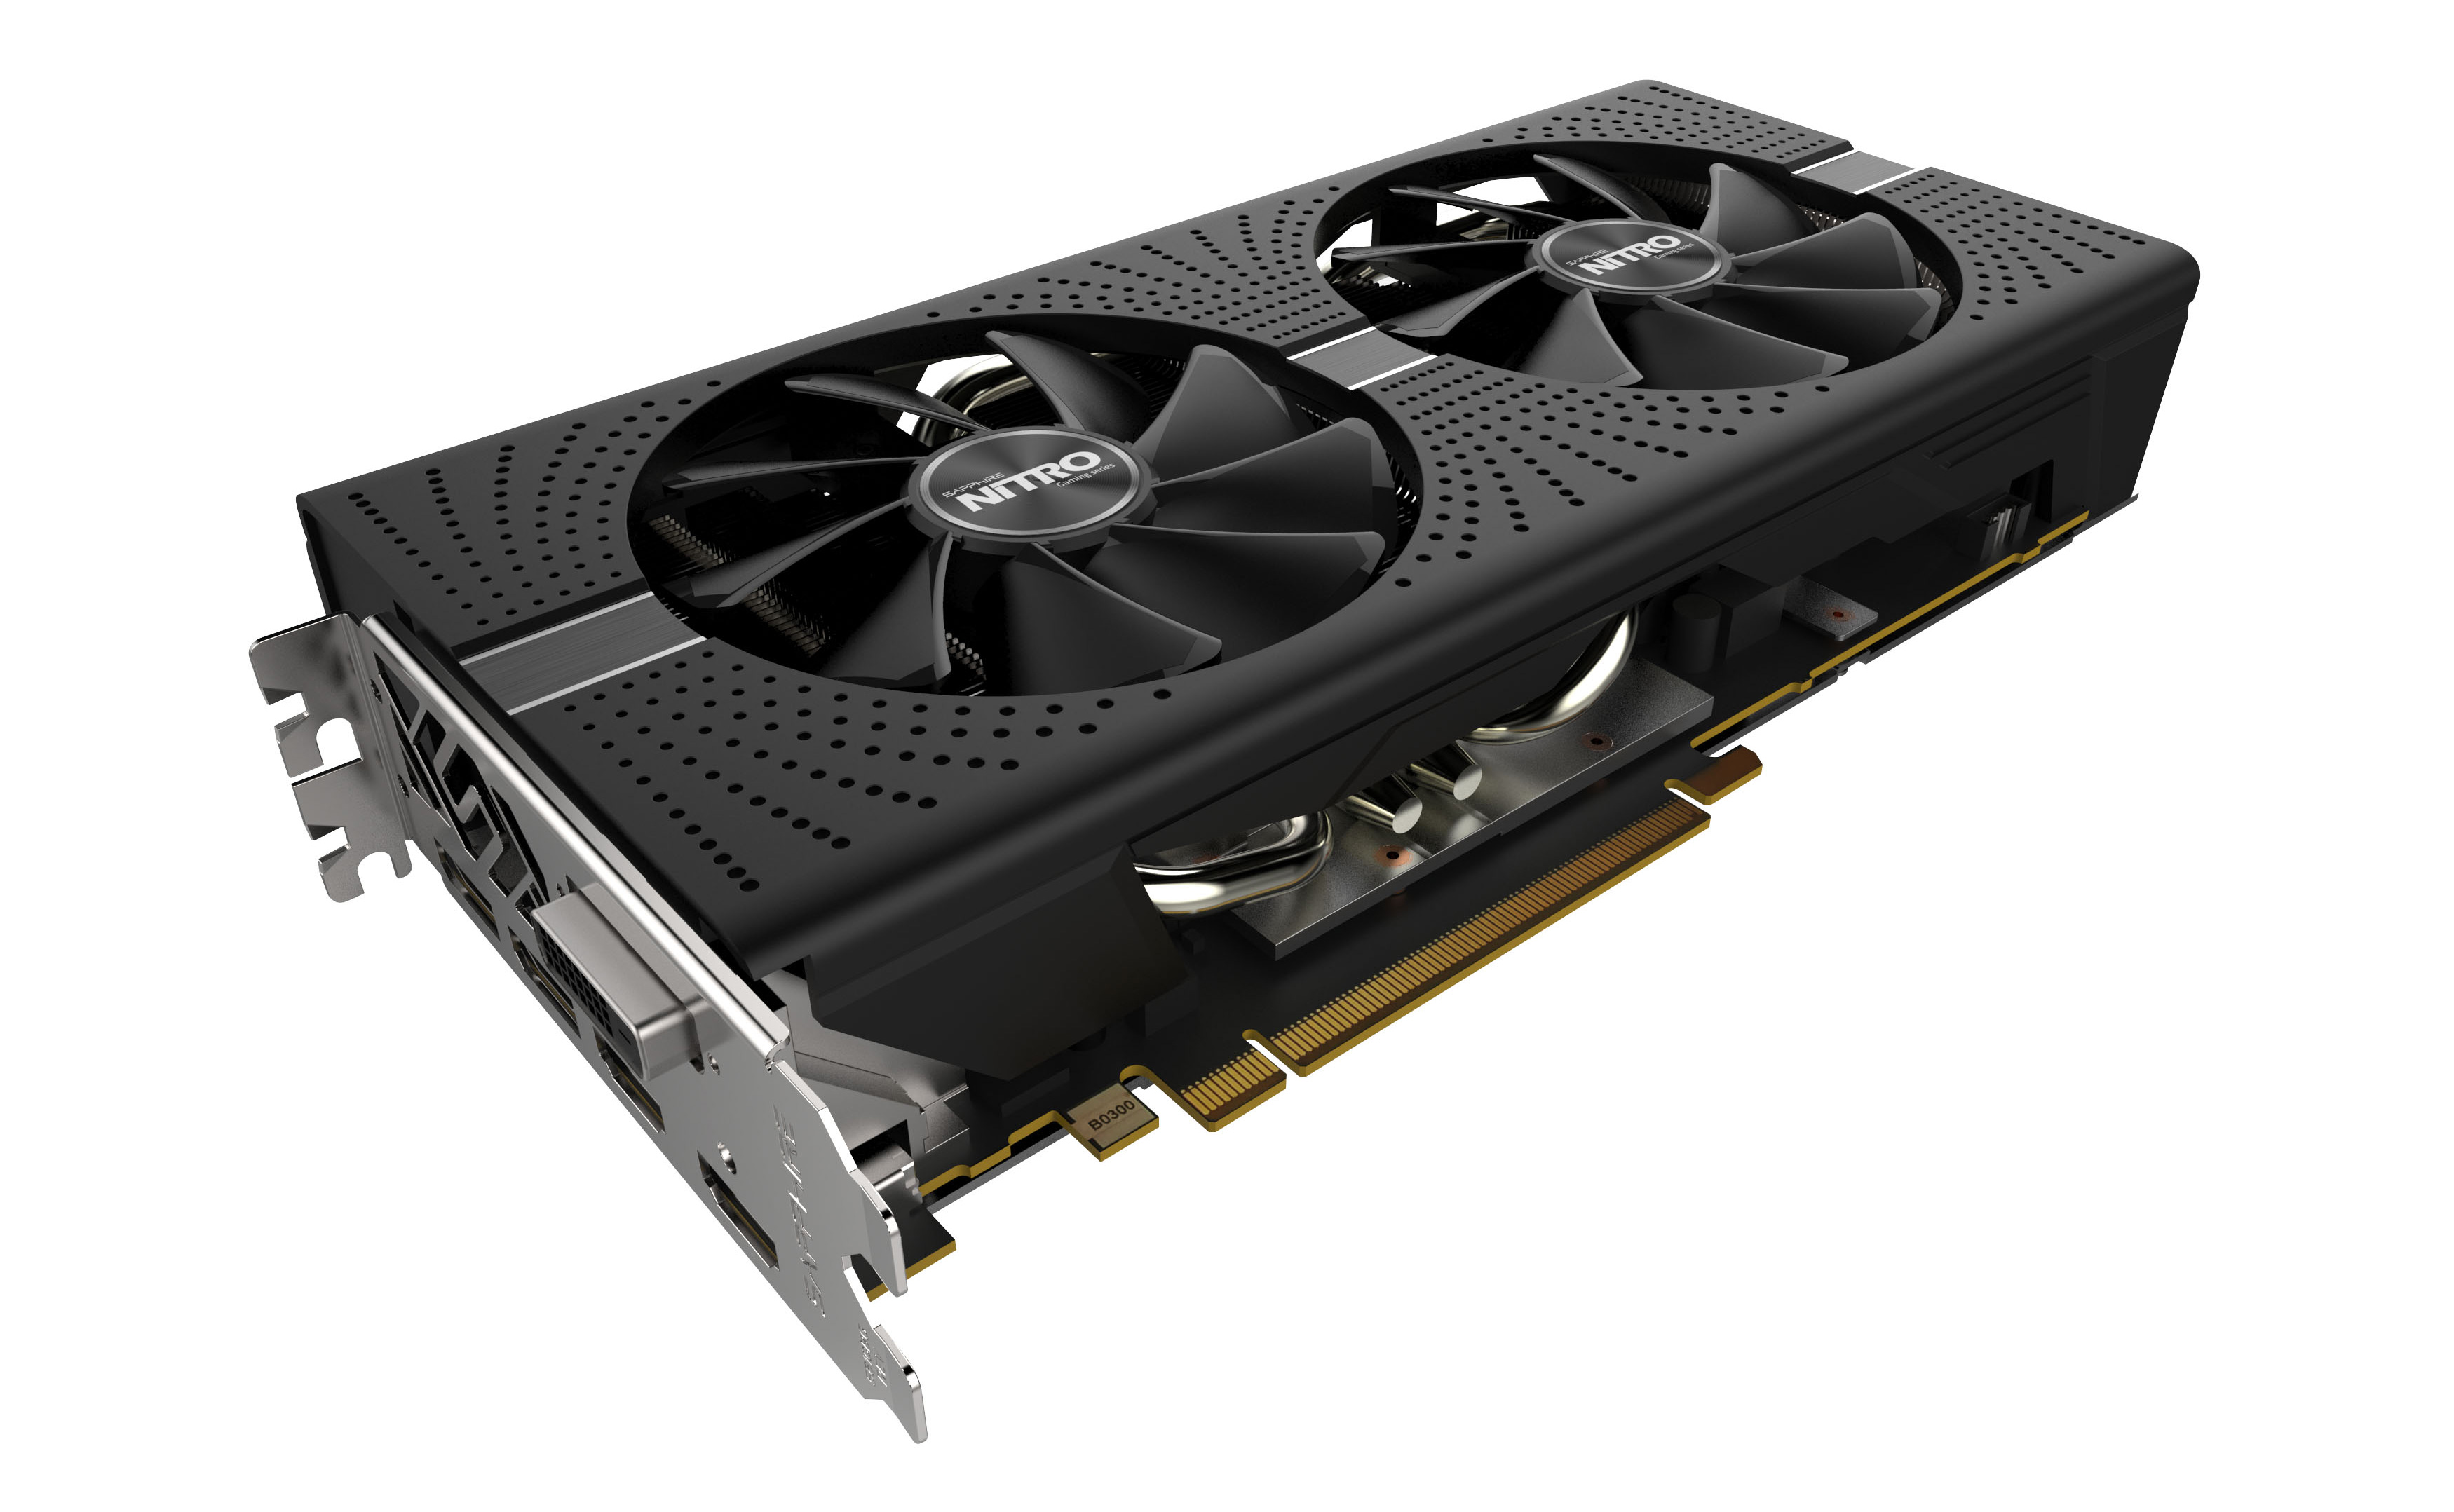
Sapphire Nitro+ Radeon RX 570


[ 테스트 시스템 ]
| CPU: | Intel Core i7-4960X @ 4.2GHz |
| Motherboard: | ASRock Fatal1ty X79 Professional |
| Power Supply: | Corsair AX1200i |
| Hard Disk: | Samsung SSD 840 EVO (750GB) |
| Memory: | G.Skill RipjawZ DDR3-1866 4 x 8GB (9-10-9-26) |
| Case: | NZXT Phantom 630 Windowed Edition |
| Monitor: | Asus PQ321 |
| Video Cards: | PowerColor Red Devil Radeon RX 580 Sapphire Nitro+ Radeon RX 570 AMD Radeon RX 480 (8GB) AMD Radeon RX 470 AMD Radeon R9 380 AMD Radeon R7 370 NVIDIA GeForce GTX 1070 Founder's Edition NVIDIA GeForce GTX 1060 Founder's Edition NVIDIA GeForce GTX 1050 Ti NVIDIA GeForce GTX 960 NVIDIA GeForce GTX 950 |
| Video Drivers: | NVIDIA Release 381.65 AMD Radeon Software Crimson Press Beta 17.10.1030 |
| OS: | Windows 10 Pro |
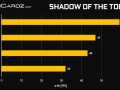
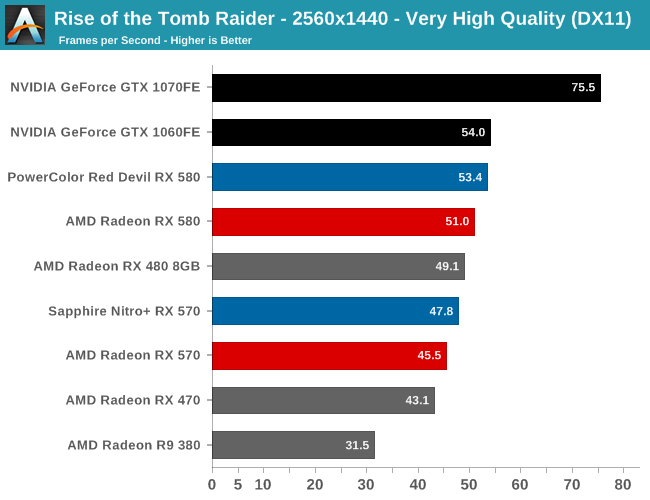
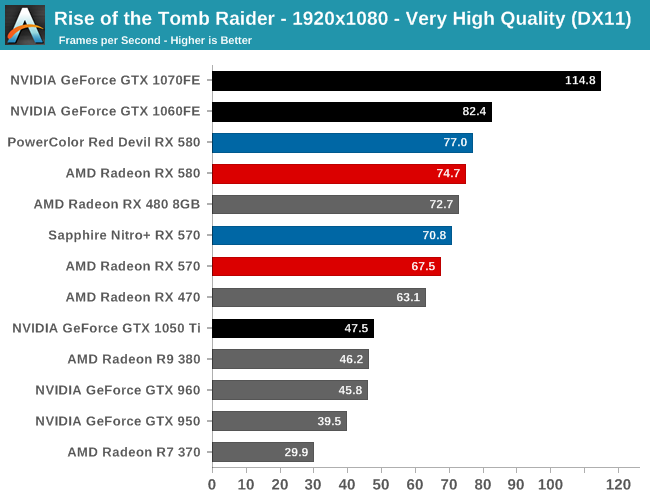
Rise of the Tomb Raider
Starting things off in our benchmark suite is the built-in benchmark for Rise of the Tomb Raider, the latest iteration in the long-running action-adventure gaming series. One of the unique aspects of this benchmark is that it’s actually the average of 4 sub-benchmarks that fly through different environments, which keeps the benchmark from being too weighted towards a GPU’s performance characteristics under any one scene.
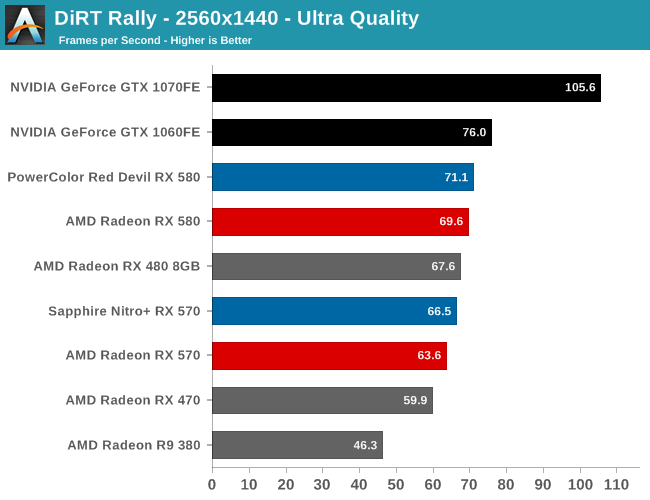
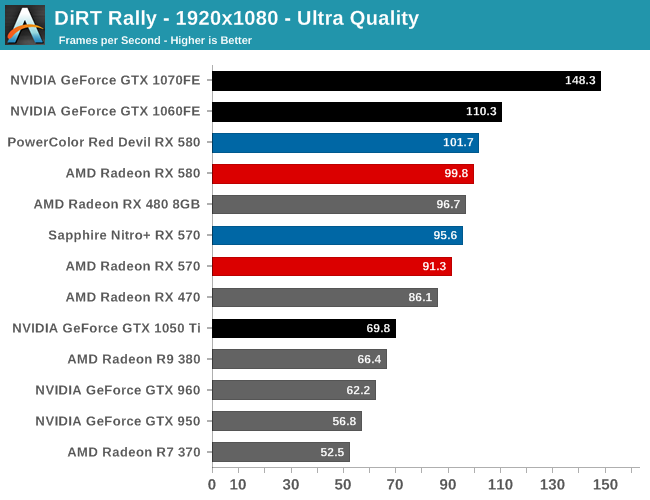
DiRT Rally
For the racing game in our benchmark suite we have Codemasters’ DiRT Rally. Codemasters continues to set the bar for graphical fidelity in racing games, delivering realistic looking environments with layered with additional graphical effects. Based on their in-house EGO engine, DiRT Rally includes a number of DirectCompute based compute shader effects, and while it’s not the most punishing game in our suite, it still takes a very good card to sustain the 60fps frame rate that driving games are best played at.
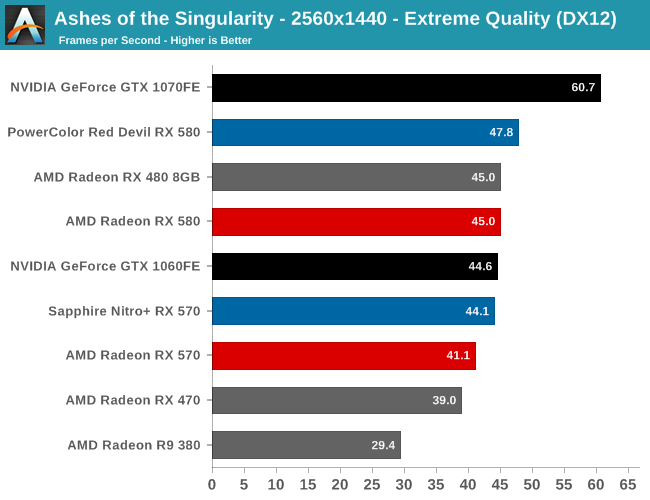
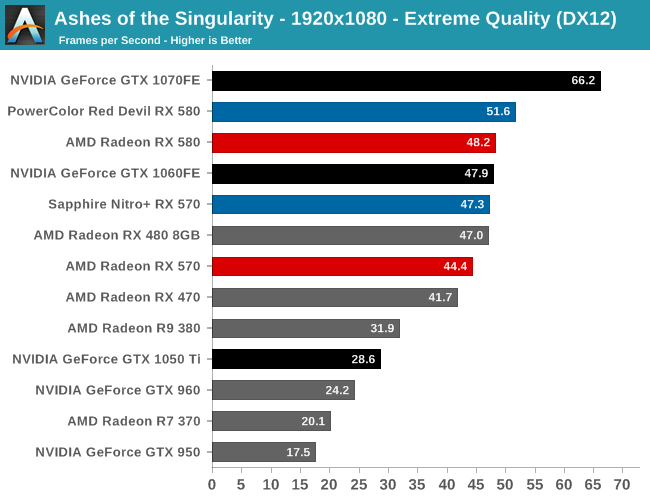
Ashes of the Singularity: Escalation
Sorely missing from our benchmark suite for quite some time have been RTSes, which don’t enjoy quite the popularity they once did. As a result Ashes holds a special place in our hearts, and that’s before we talk about the technical aspects. Based on developer Oxide Games’ Nitrous Engine, Ashes has been designed from the ground up for low-level APIs like DirectX 12. As a result of all of the games in our benchmark suite, this is the game making the best use of DirectX 12’s various features, from asynchronous compute to multi-threaded work submission and high batch counts. What we see can’t be extrapolated to all DirectX 12 games, but it gives us a very interesting look at what we might expect in the future.
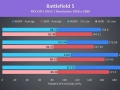
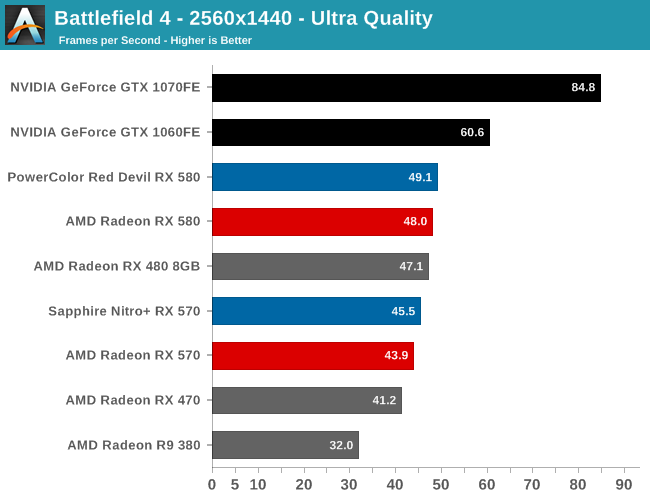
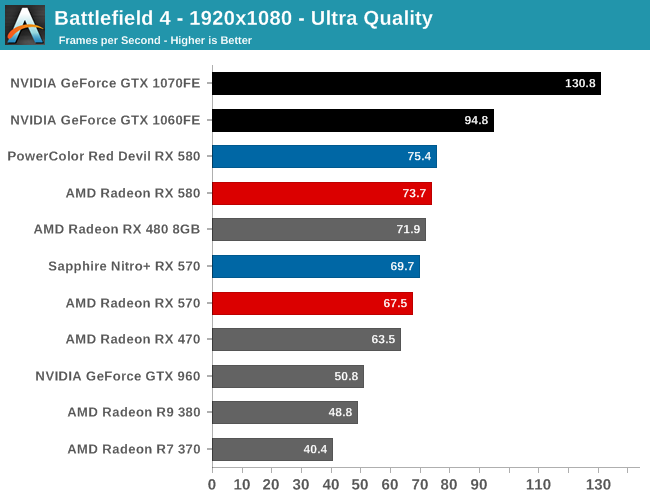
Battlefield 4
One of the older games in our benchmark suite, DICE’s Battlefield 4 remains a staple of MP gaming. Even at its age, Battlefield 4 remained a challenging game in its own right, as very few mass market MP shooters push the envelope on graphics quality right now. As these benchmarks are from single player mode, based on our experiences our rule of thumb here is that multiplayer framerates will dip to half our single player framerates, which means a card needs to be able to average at least 60fps if it’s to be able to hold up in multiplayer.
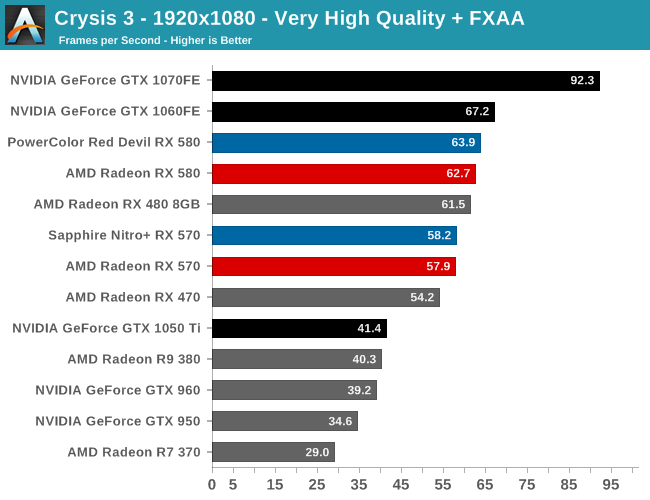
Crysis 3
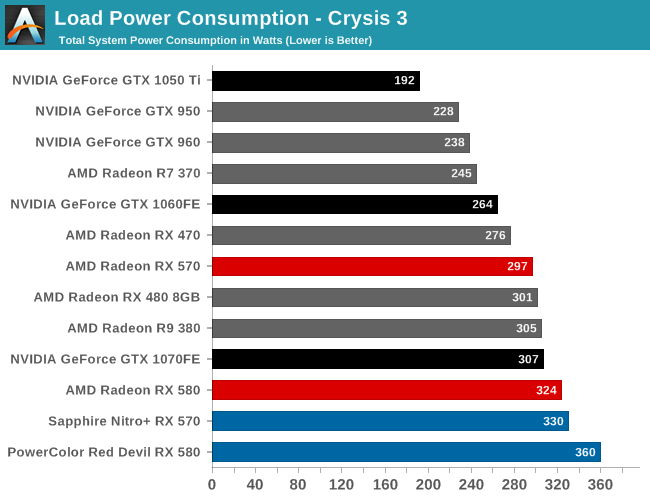
Still one of our most punishing benchmarks 3 years later, Crysis 3 needs no introduction. Crytek’s DX11 masterpiece, Crysis 3’s Very High settings still punish even the best of video cards, never mind the rest. Along with its high performance requirements, Crysis 3 is a rather balanced game in terms of power consumption and vendor optimizations. As a result it can give us a good look at how our video cards stack up on average, and later on in this article how power consumption plays out.

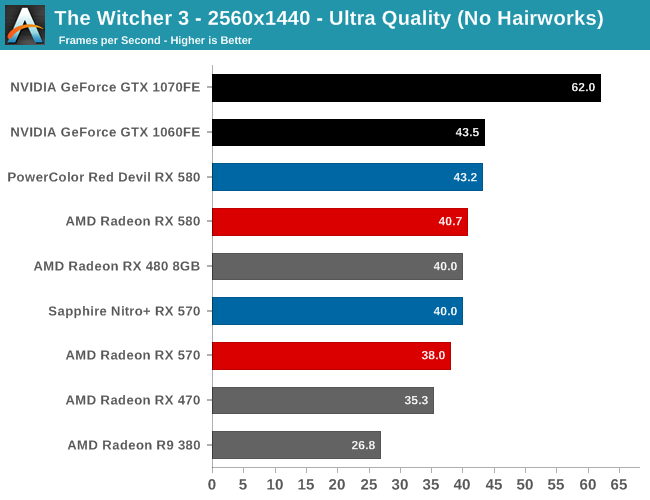
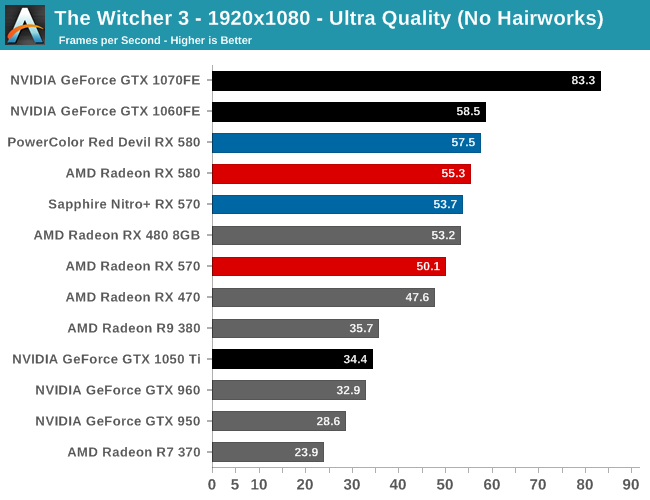
The Witcher 3
The third game in CD Projekt RED’s expansive RPG series, The Witcher 3 is our RPG benchmark of choice. Utilizing the company’s in-house engine, REDengine 3, The Witcher makes use of an array of DirectX 11 features, all of which combine to make the game both stunning and surprisingly GPU-intensive. Our benchmark is based on an action-heavy in-engine cutscene early in the game, and Hairworks is disabled.
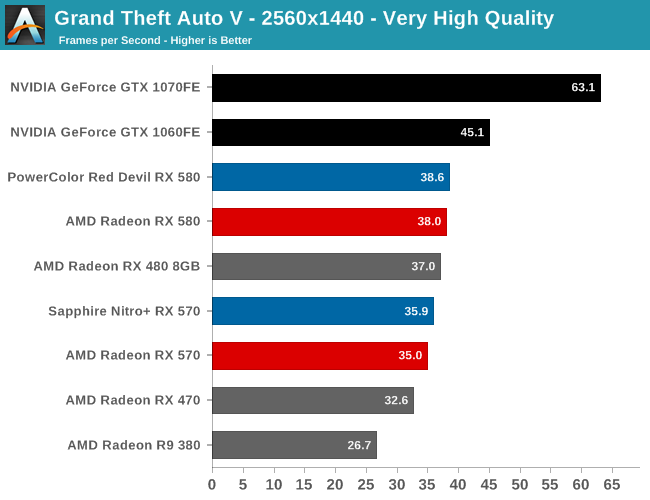
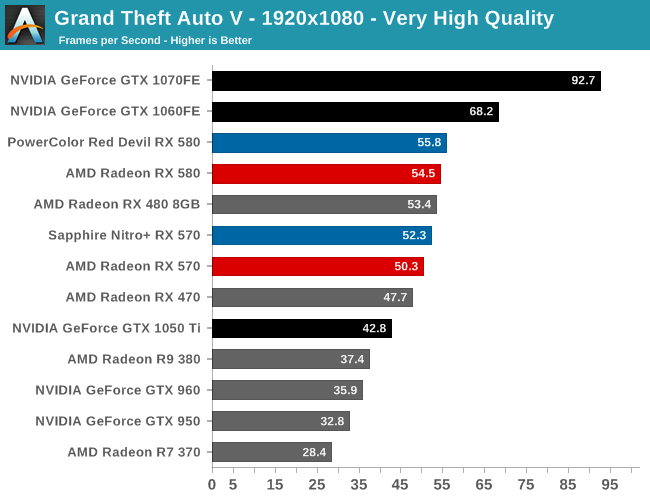
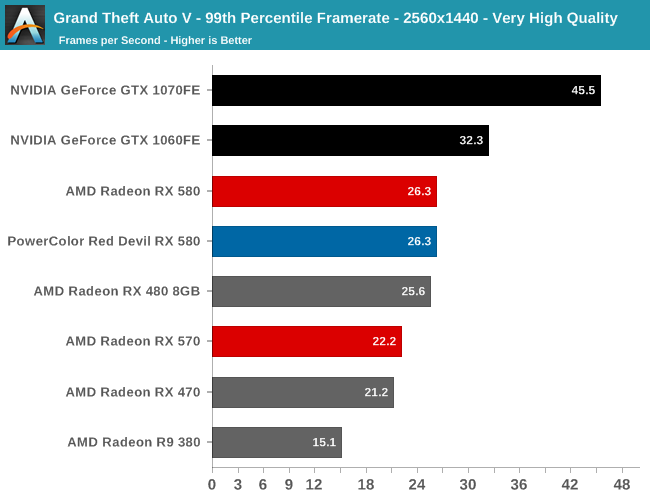
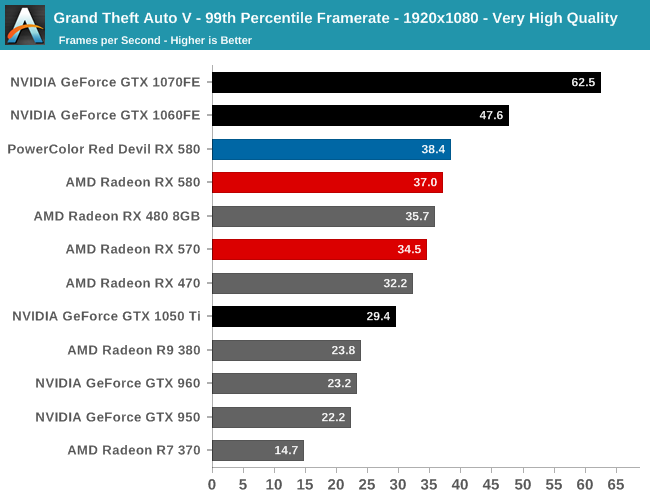
Grand Theft Auto V
The latest edition of Rockstar’s venerable series of open world action games, Grand Theft Auto V was originally released to the last-gen consoles back in 2013. However thanks to a rather significant facelift for the current-gen consoles and PCs, along with the ability to greatly turn up rendering distances and add other features like MSAA and more realistic shadows, the end result is a game that is still among the most stressful of our benchmarks when all of its features are turned up. Furthermore, in a move rather uncharacteristic of most open world action games, Grand Theft Auto also includes a very comprehensive benchmark mode, giving us a great chance to look into the performance of an open world action game.
On a quick note about settings, as Grand Theft Auto V doesn't have pre-defined settings tiers, I want to quickly note what settings we're using. For "Very High" quality we have all of the primary graphics settings turned up to their highest setting, with the exception of grass, which is at its own very high setting. Meanwhile 4x MSAA is enabled for direct views and reflections. This setting also involves turning on some of the advanced redering features - the game's long shadows, high resolution shadows, and high definition flight streaming - but it not increasing the view distance any further.
Otherwise for "High" quality we take the same basic settings but turn off all MSAA, which significantly reduces the GPU rendering and VRAM requirements.
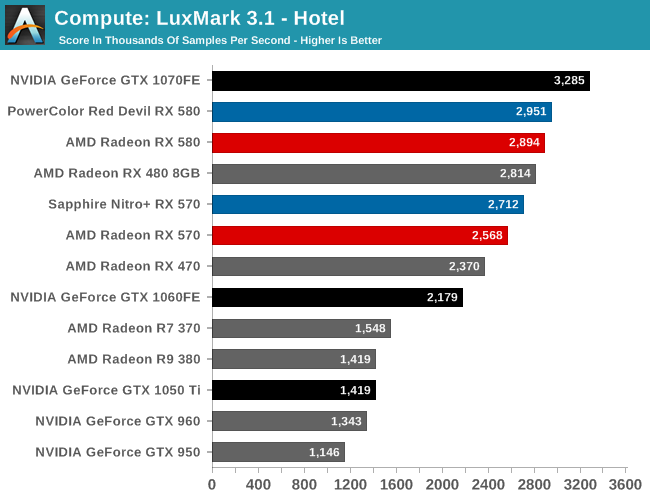
Compute
Shifting gears, let’s take a look at compute performance on new Radeon RX 500 cards.
Starting us off for our look at compute is LuxMark3.1, the latest version of the official benchmark of LuxRender. LuxRender’s GPU-accelerated rendering mode is an OpenCL based ray tracer that forms a part of the larger LuxRender suite. Ray tracing has become a stronghold for GPUs in recent years as ray tracing maps well to GPU pipelines, allowing artists to render scenes much more quickly than with CPUs alone.
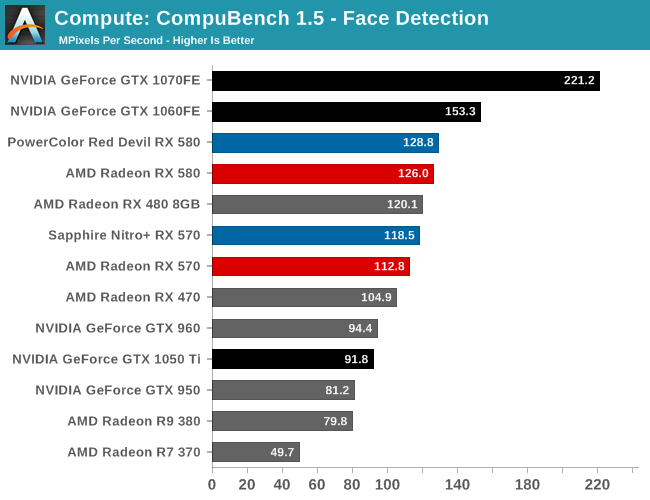
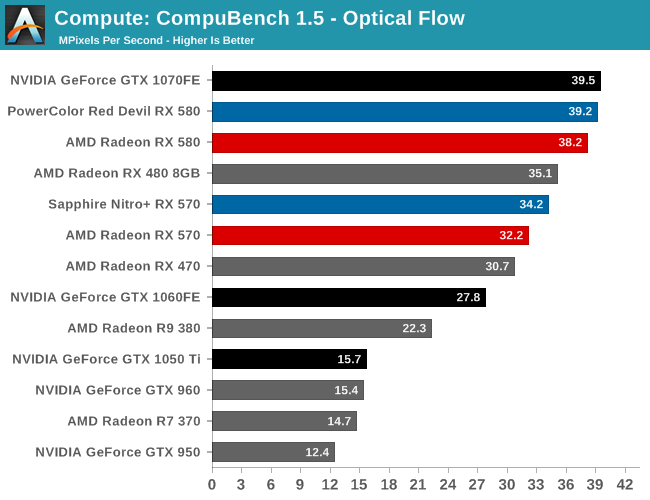
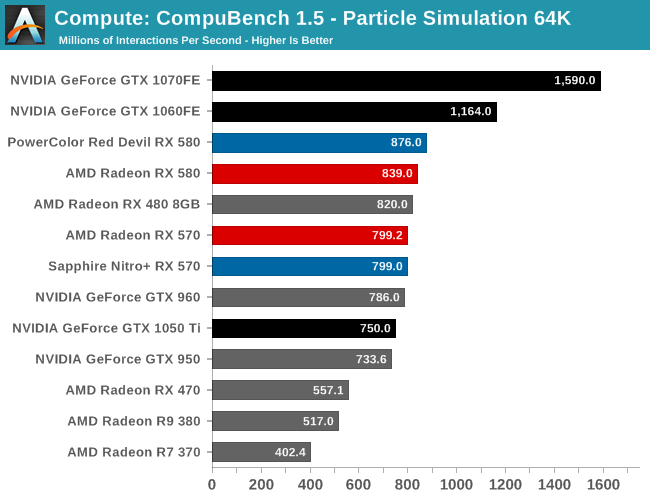
For our second set of compute benchmarks we have CompuBench 1.5, the successor to CLBenchmark. CompuBench offers a wide array of different practical compute workloads, and we’ve decided to focus on face detection, optical flow modeling, and particle simulations.
출처 - http://www.anandtech.com