


 다운로드 및 설치<br>")
<br>")


![삼성, 잃어버린 10년 [풀영상] | 창 458회 (KBS 24.03.12) by 인공지능](https://raptor-hw.net/xe/files/thumbnails/453/204/271x205.crop.jpg "삼성, 잃어버린 10년 [풀영상] | 창 458회 (KBS 24.03.12)<br>")


 ' alt='위대한 인류최대 수퍼로켓 '스타십(Spacex Starship)' 발사 성공 by 인공지능' />

<br>")


’ 오픈<br>")

, 전세계 일자리 파괴 가속화 “육체노동만 살아남나?”<br>")


| Toshiba Q300 SATA SSDs | ||||
| Capacity | 960GB | 480GB | 240GB | 120GB |
| NAND | Toshiba A19nm 128Gb TLC | |||
| Controller | Toshiba TC58 | |||
| Sequential Read | 550 MB/s | |||
| Sequential Write | 530 MB/s | |||
| 4kB Random Read IOPS | 87k | |||
| 4kB Random Write IOPS | 83k | |||
| Endurance Rating | 240TB | 120TB | 60TB | 30TB |
| Active Power Consumption | 5.1W | |||
| Idle Power Consumption | 1.1W | |||
| Warranty | 3 years | |||
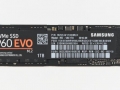
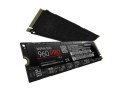
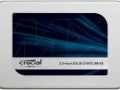
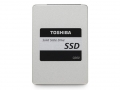
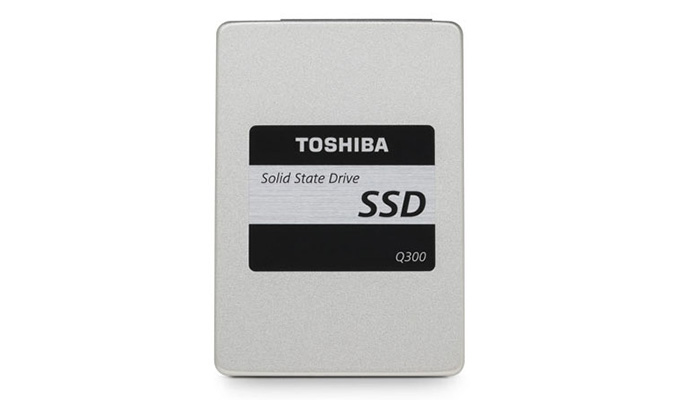
- 도시바 Q300 SSD 스펙
라인업 : 120 - 240 - 480 - 960GB
낸드 플래시 : 도시바 A19나노 128Gb TLC
메인 컨트롤러 : 도시바 TC58
시퀀셜 읽기 : 550 MB/s
시퀀셜 쓰기 : 530 MB/s
4kB 랜덤 읽기 : 87k
4kB 랜덤 쓰기 : 83k
액티브 전력소모 : 5.1와트
아이들 전력소모 : 1.1와트
워런티 : 3년

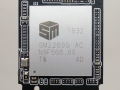
좌 : 도시바 Q300 / 우 : OCZ Trion 100 = 같은 모델
[ 테스트 시스템 ]
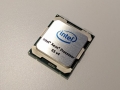
| CPU | Intel Core i7-4770K running at 3.5GHz (Turbo & EIST enabled, C-states disabled) |
| Motherboard | ASUS Z97 Deluxe (BIOS 2501) |
| Chipset | Intel Z97 |
| Memory | Corsair Vengeance DDR3-1866 2x8GB (9-10-9-27 2T) |
| Graphics | Intel HD Graphics 4600 |
| Desktop Resolution | 1920 x 1200 |
| OS | Windows 8.1 x64 |
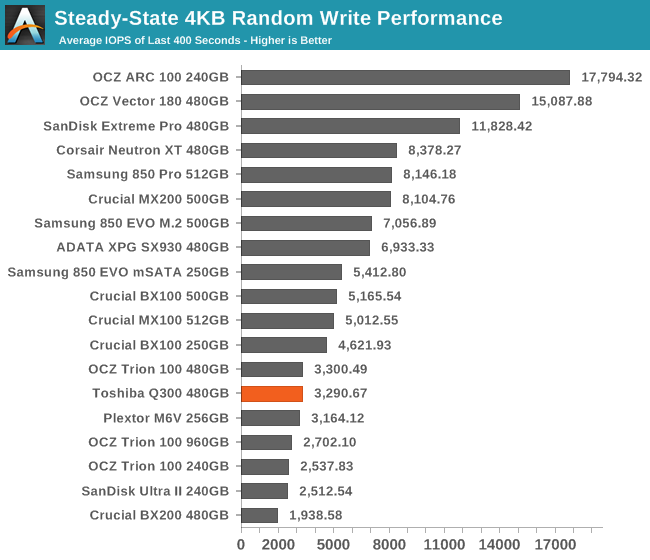
The Q300's steady-state performance is on par with the Trion 100: low, but well above the Crucial BX200 and SanDisk Ultra II. The latter drive uses SanDisk's second-generation 19nm TLC that is made on the same process as the flash in the Q300.
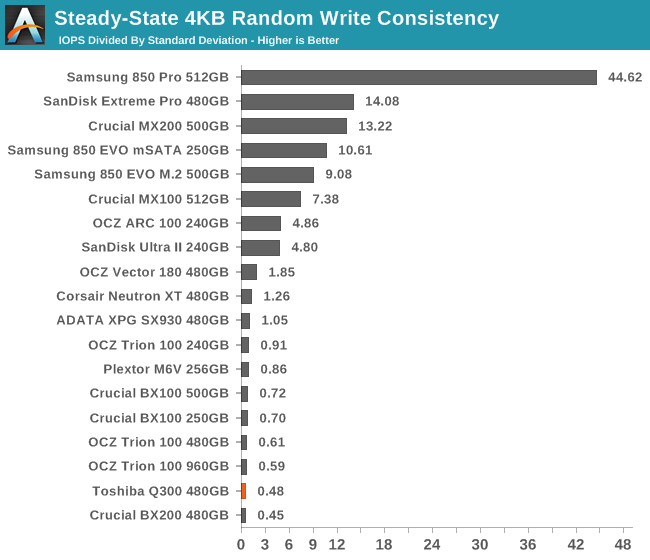
The write consistency of the Q300 is poor, but that's the case for most low-end drives - even the ones using MLC flash. As long as the performance has a reasonably high floor, a lot of variance is tolerable for client workloads. The Q300 is noticeably less consistent than the Trion 100.
 | |||||||||
| Default | Toshiba Q300 480GBOCZ ARC 100 240GBPlextor M6V 256GBSamsung 850 EVO 500GBSamsung 850 Pro 256GBSanDisk Extreme Pro 240GBSanDisk Ultra II 240GBOCZ Trion 100 240GBOCZ Trion 100 480GBOCZ Trion 100 960GBCorsair Neutron XT 480GBCrucial BX100 500GBCrucial MX100 512GBCrucial MX200 500GBOCZ Vector 180 480GBSamsung SSD 850 Pro 512GBSanDisk Extreme Pro 480GB | ||||||||
| 25% Over-Provisioning | Toshiba Q300 480GBOCZ Trion 100 240GBOCZ Trion 100 480GBOCZ Trion 100 960GBCorsair Neutron XT 480GBCrucial BX100 500GBCrucial MX100 512GBOCZ ARC 100 240GBOCZ Vector 180 480GBSamsung 850 EVO M.2 500GBSamsung SSD 850 Pro 512GBSanDisk Extreme Pro 480GBSanDisk Ultra II 240GB | ||||||||
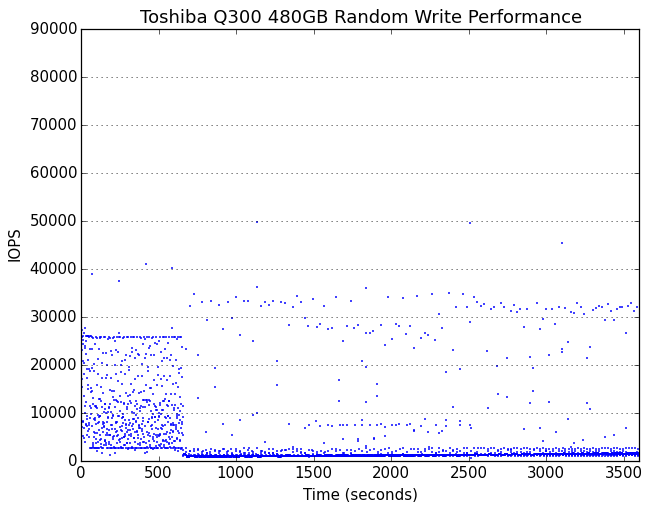
It takes about ten minutes of full-speed writing for the Q300 to burn through its spare area, which is pretty good. The steady state that it reaches is mostly consistent save for some extreme outliers.
 | |||||||||
| Default | Toshiba Q300 480GBOCZ ARC 100 240GBPlextor M6V 256GBSamsung 850 EVO 500GBSamsung 850 Pro 256GBSanDisk Extreme Pro 240GBSanDisk Ultra II 240GBOCZ Trion 100 240GBOCZ Trion 100 480GBOCZ Trion 100 960GBCorsair Neutron XT 480GBCrucial BX100 500GBCrucial MX100 512GBCrucial MX200 500GBOCZ Vector 180 480GBSamsung 850 EVO 1TBSamsung SSD 850 Pro 512GBSanDisk Extreme Pro 480GB | ||||||||
| 25% Over-Provisioning | Toshiba Q300 480GBOCZ Trion 100 240GBOCZ Trion 100 480GBOCZ Trion 100 960GBCorsair Neutron XT 480GBCrucial BX100 500GBCrucial MX100 512GBOCZ ARC 100 240GBOCZ Vector 180 480GBSamsung 850 EVO M.2 500GBSamsung SSD 850 Pro 512GBSanDisk Extreme Pro 480GBSanDisk Ultra II 240GB | ||||||||
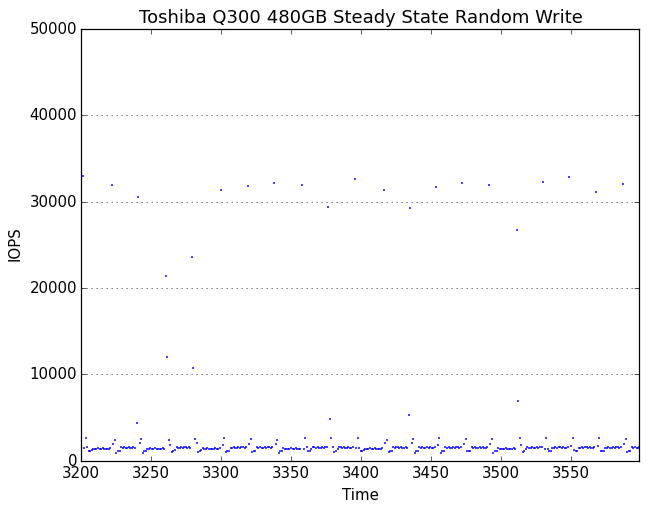
The Q300's steady-state write performance is around 1500 IOPS with several brief excursions per minute up to 30k+ IOPS. With extra space reserved, the variance increases and the steady state ranges from about 1100 IOPS to about 5500 IOPS.
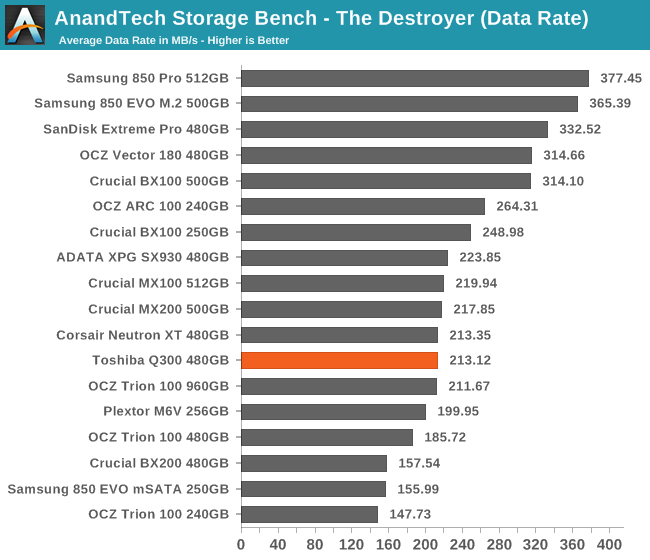
The Q300's average data rate during The Destroyer was slightly better than the Trion 100 480GB, and puts the Q300 around the middle of the pack and well ahead of the Crucial BX200. It's also slightly ahead of the Plextor M6V, a drive that uses MLC flash and prioritizes power efficiency over performance.
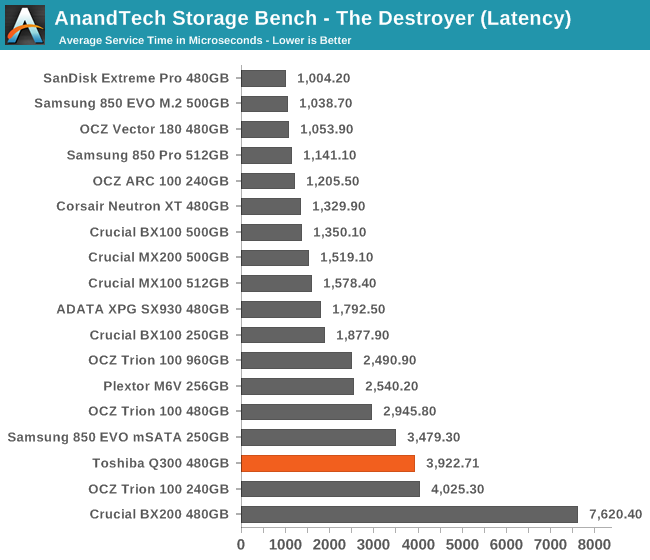
The average service time of the Q300 on The Destroyer is considerably worse than the Trion 100, and near the bottom of the chart. The performance consistency test showed the Q300 as significantly more variable than the Trion 100 before reaching steady state, so this result isn't inexplicable.
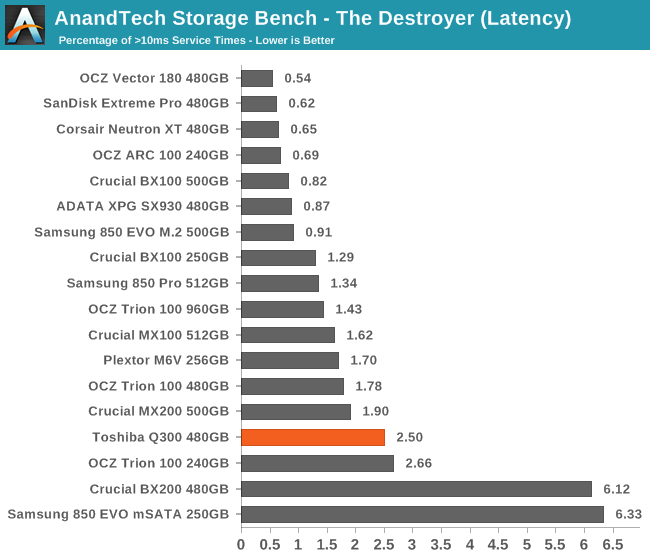
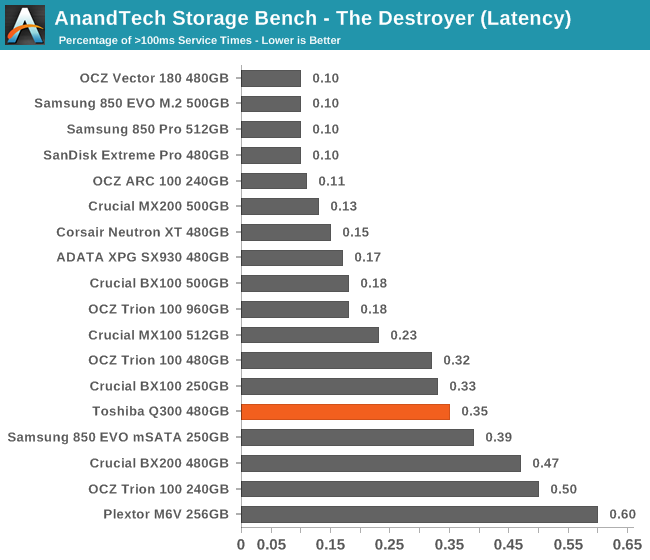
The Q300 has more severe latency outliers than the Trion 100, though neither drive is great at limiting latency.
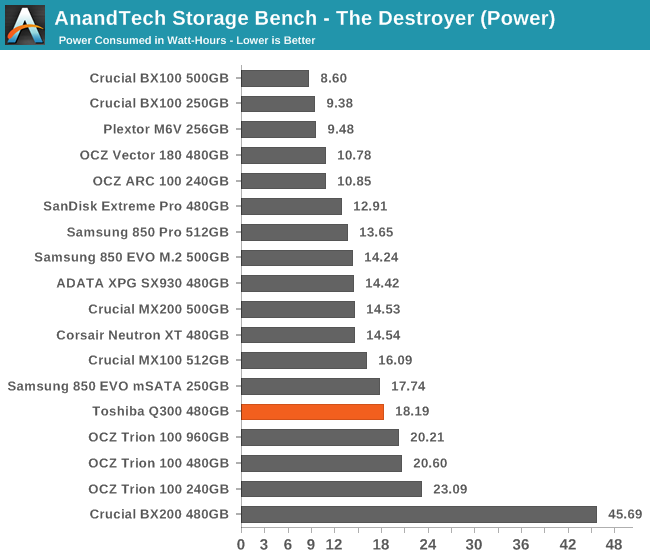
The Q300 shows improved power efficiency over the Trion 100, but the MLC drives are all better.
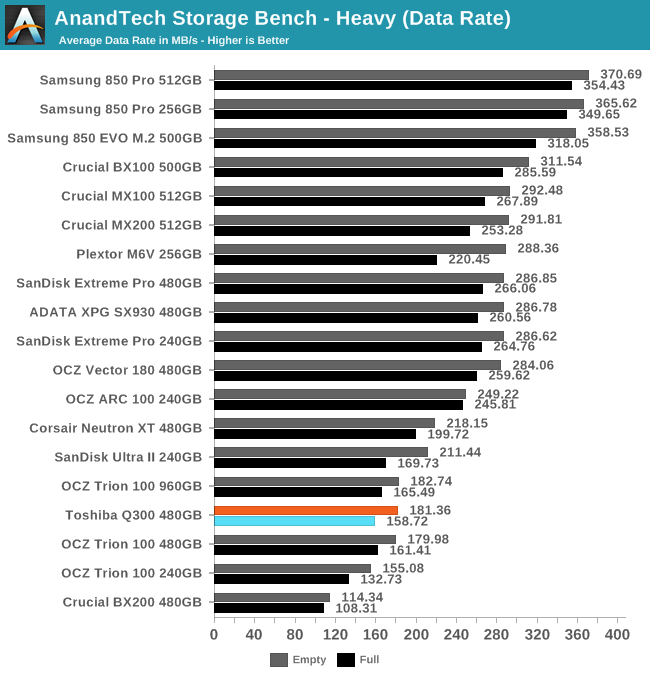
The Q300's average data rate on the ATSB Heavy test is the same as the Trion 100: low but not the worst we've seen, and about half what the Samsung 850 Pro delivers. All of the planar TLC drives perform worse than all of the MLC drives.
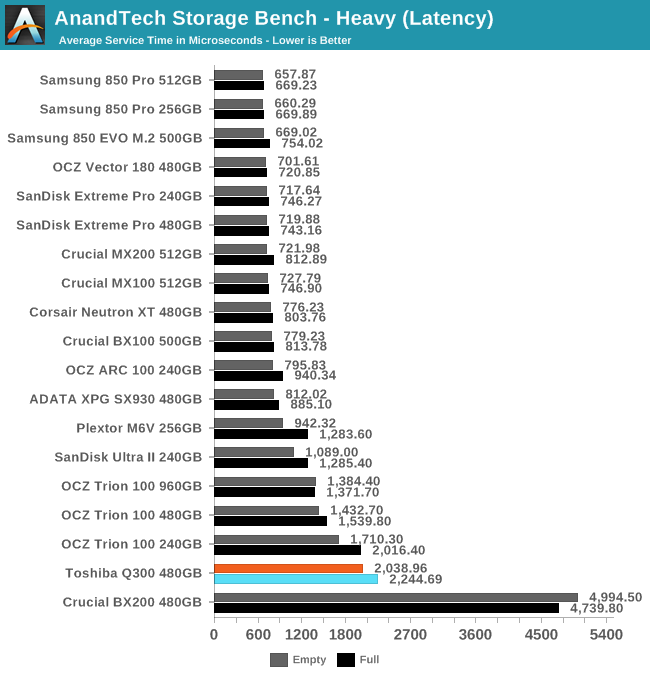
The Q300's average service time is again worse than the Trion 100, and is about twice that of the slowest MLC drive. The BX200 puts things in perspective: the Q300 is a disappointment, but isn't truly broken.
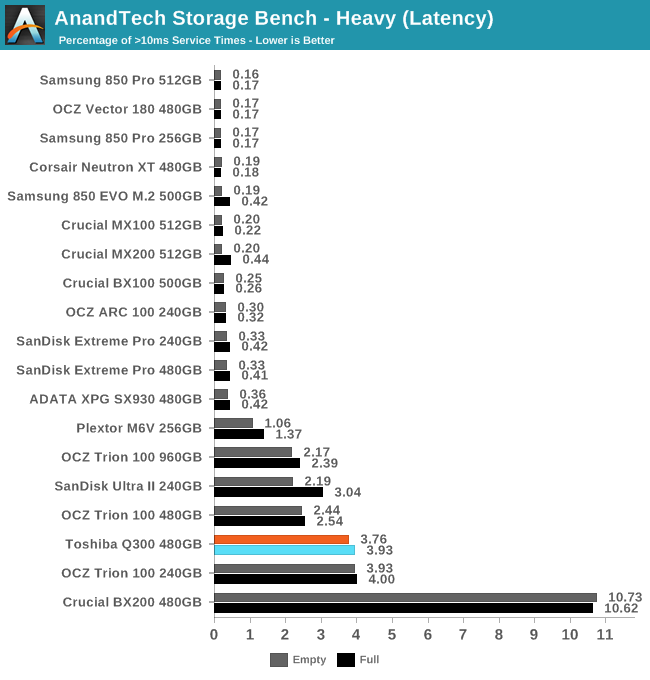
Most MLC drives are able to keep latency under 10ms almost all of the time, but the TLC drives get overwhelmed during the more intense parts of the test. The Q300 is worse than the Trion 100 480GB, but this time isn't worse than the smaller Trion 100.
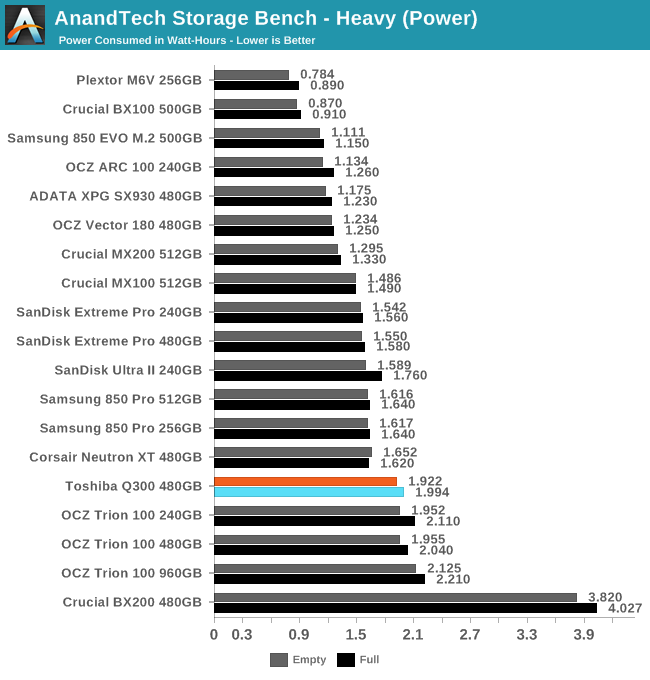
The Q300 continues to be slightly more power efficient than the Trion 100, but the gap separating it from the MLC drives is quite clear. The SanDisk Ultra II managed to get much better efficiency out of nearly-identical TLC flash.
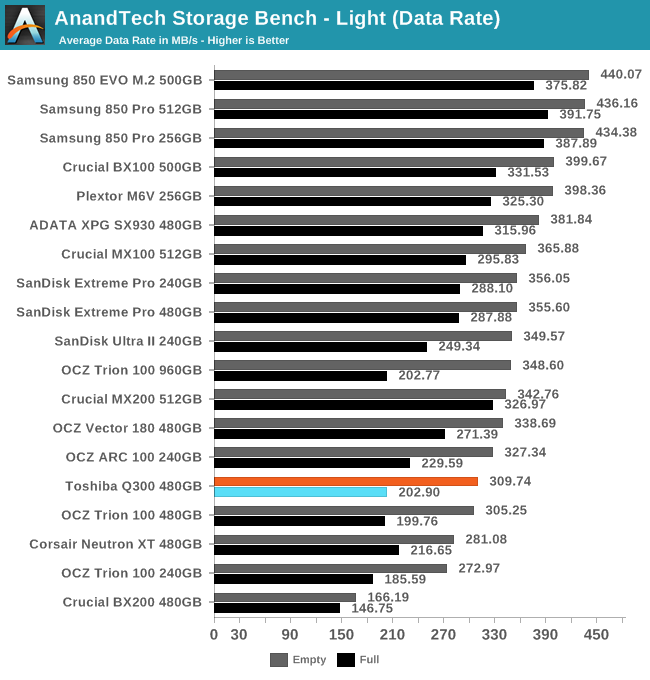
The performance rankings for the ATSB Light test are similar to the more intense tests, but the spread is much smaller and the difference between starting with an empty or full drive is much larger. A low-end MLC drive usually won't provide noticeably better performance than the Q300 on workloads this light.
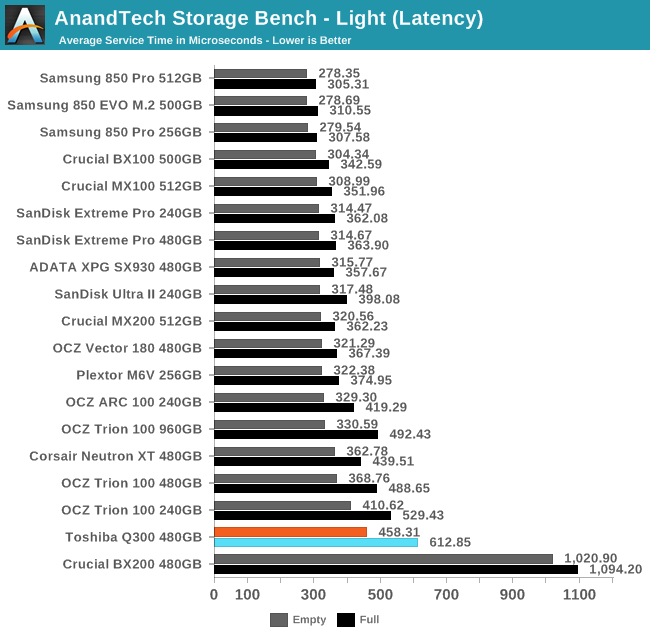
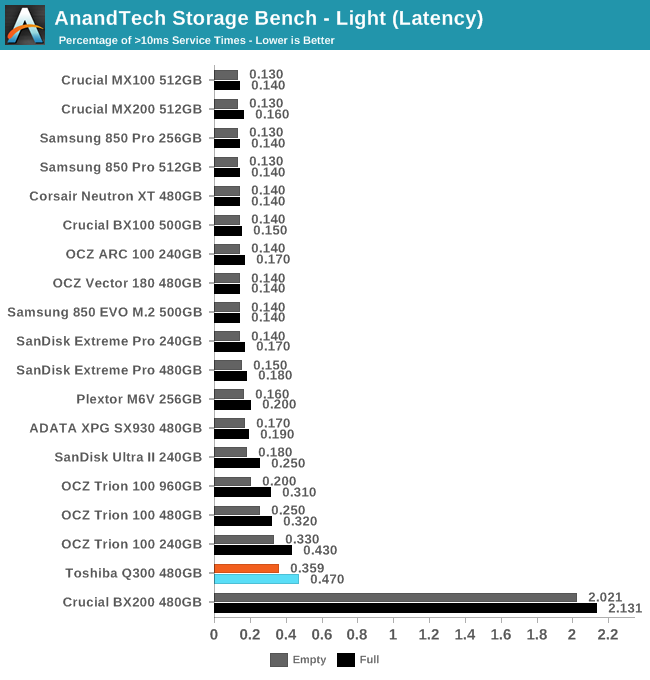
The latency of the Q300 is again near the bottom of the charts and worse than the Trion 100, but even for a full drive the average is only twice that of the best MLC SATA drives. The Q300 is underperforming for its capacity class, but is still reasonable for a SSD.
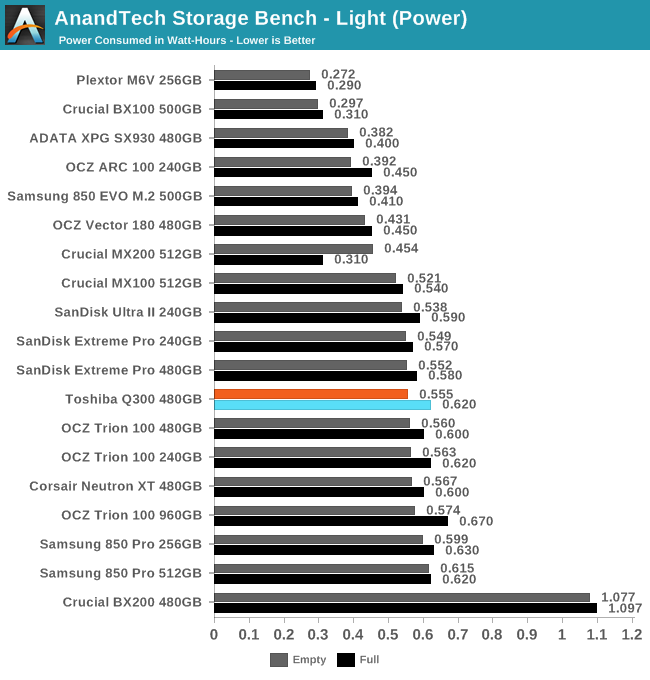
On light workloads like this, most drives don't stand out from the crowd in terms of energy efficiency. The top performers are mostly drawing proportionately more power and end up using the same amount of energy.