


 ' alt='위대한 인류최대 수퍼로켓 '스타십(Spacex Starship)' 발사 성공 by 인공지능' />


<br>")
<br>")
’ 오픈<br>")


 다운로드 및 설치<br>")

, 전세계 일자리 파괴 가속화 “육체노동만 살아남나?”<br>")


![삼성, 잃어버린 10년 [풀영상] | 창 458회 (KBS 24.03.12) by 인공지능](https://raptor-hw.net/xe/files/thumbnails/453/204/271x205.crop.jpg "삼성, 잃어버린 10년 [풀영상] | 창 458회 (KBS 24.03.12)<br>")


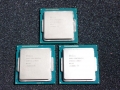
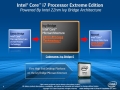
인텔이 하스웰 리프레시와 이를 지원하는 인텔 9시리즈 플랫폼 공식 발표
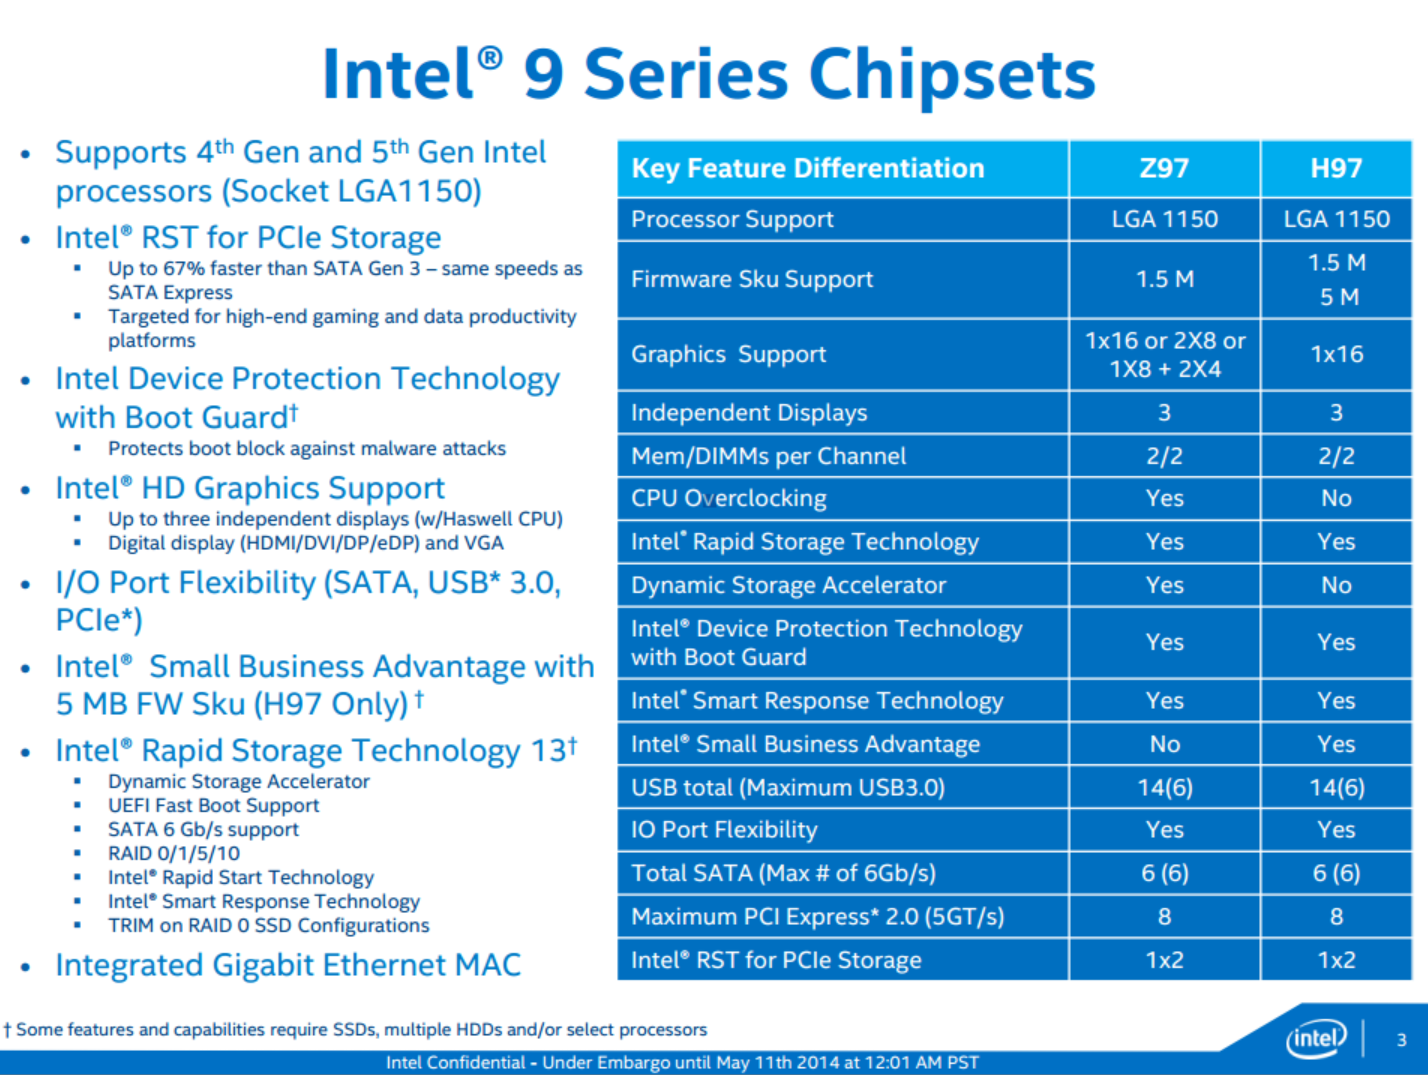
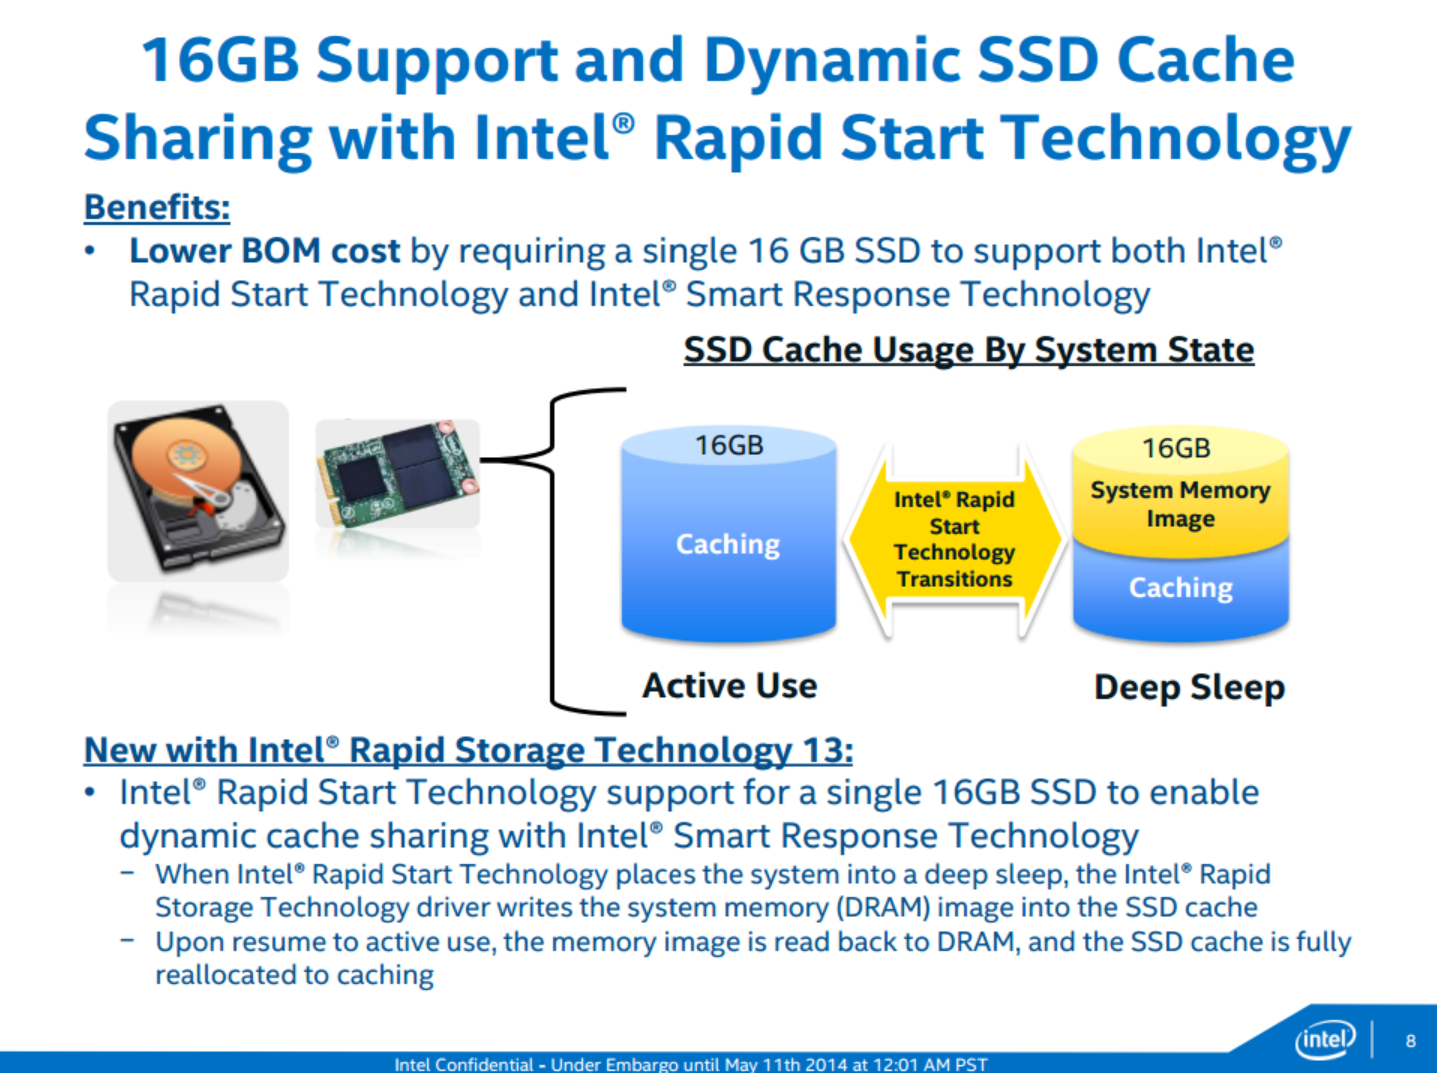
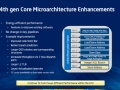
새로운 9시리즈는 구형 하스웰과 신형 하스웰 리프레시 모두 지원, 차세대 사타 익스프레스 기술 지원 / 향상된 RST 기술 / 디바이스 프로텍션 / 유연해진 IO 포트 지원, 인텔 스몰 비지니스 기술 향상, 래피드 스토리지 기술 향상 등
also routed via the CPU, not the chipset, which may be the reason).
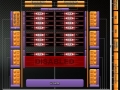
The PCIe storage on 9-series is somewhat confusing. For clarity, let us return to the Flex IO system introduced with the 8-series:
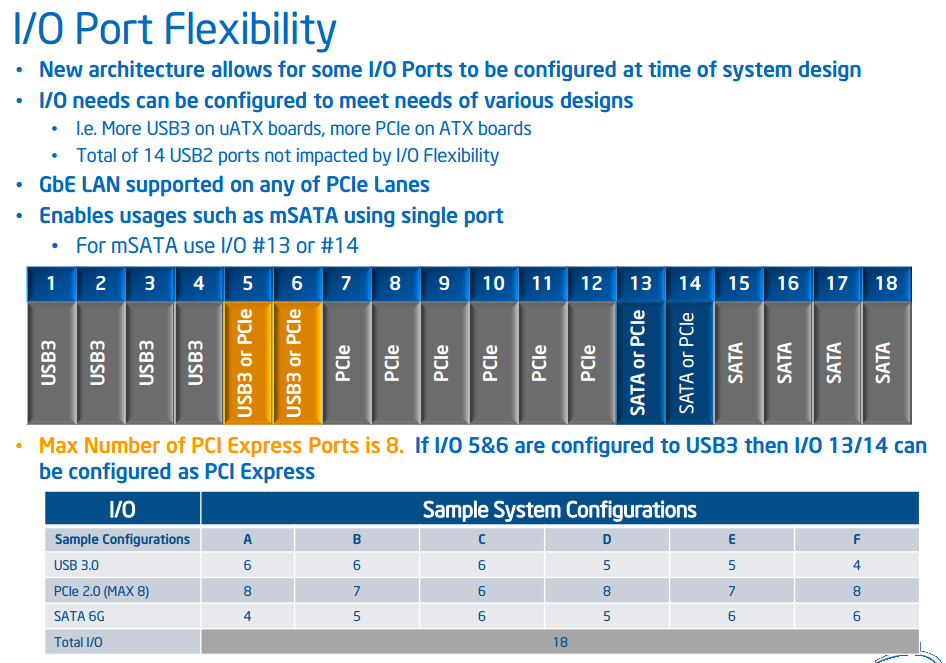
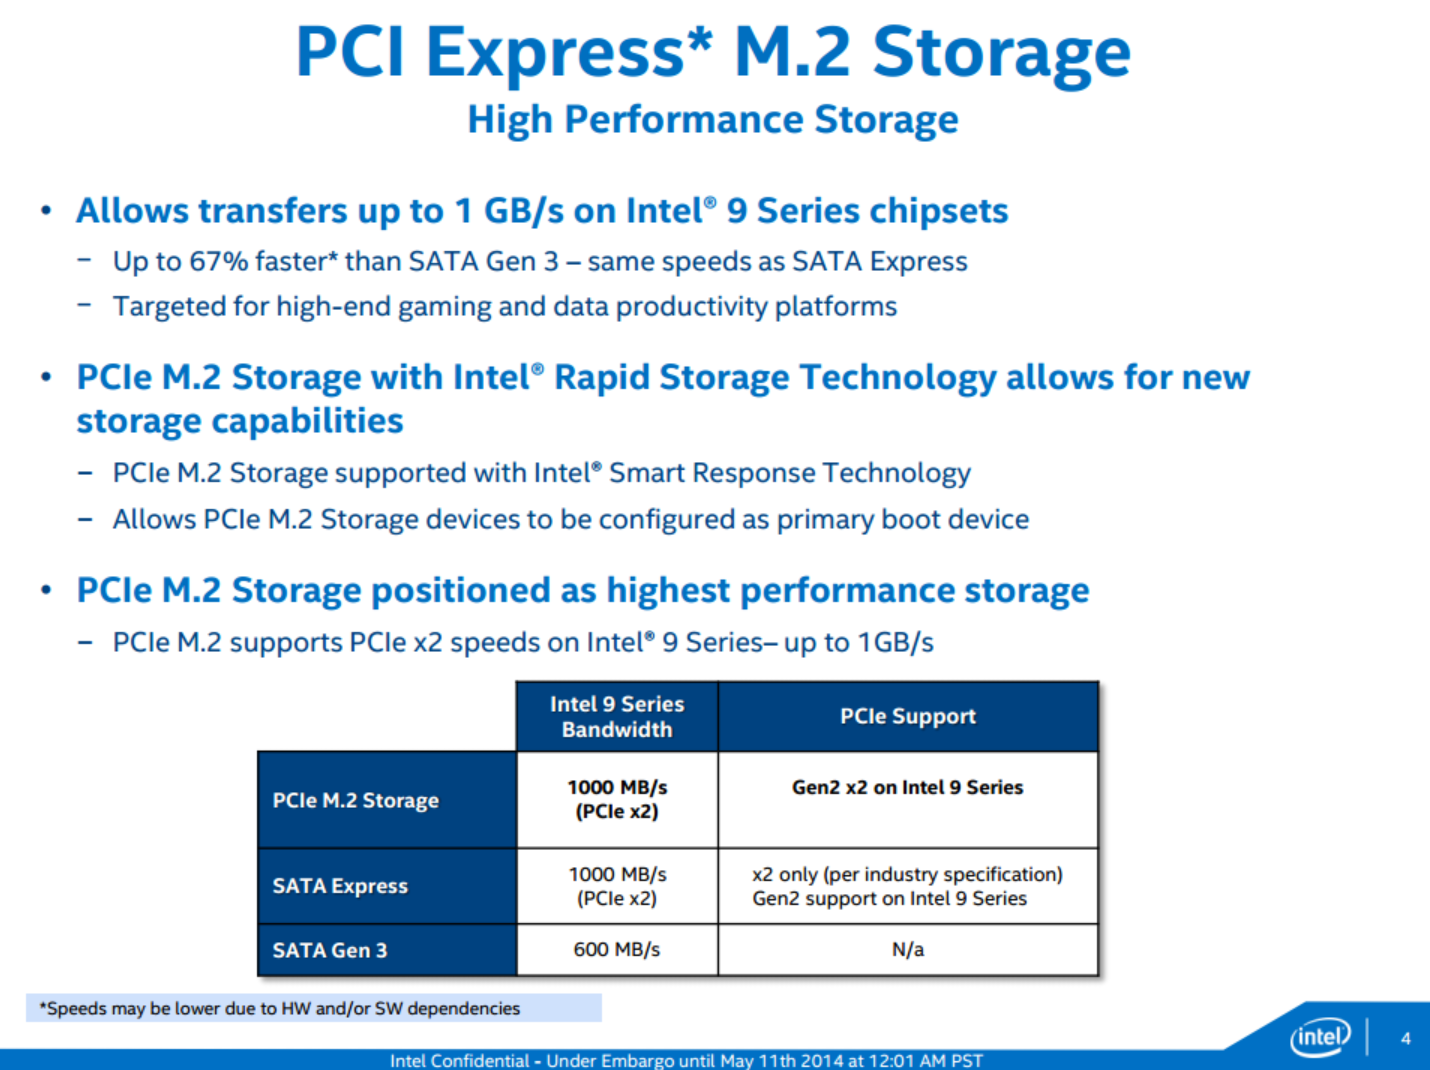
PCI-EX 방식 M.2 스토리지 지원 강화, 유연해진 IO 포트 구성
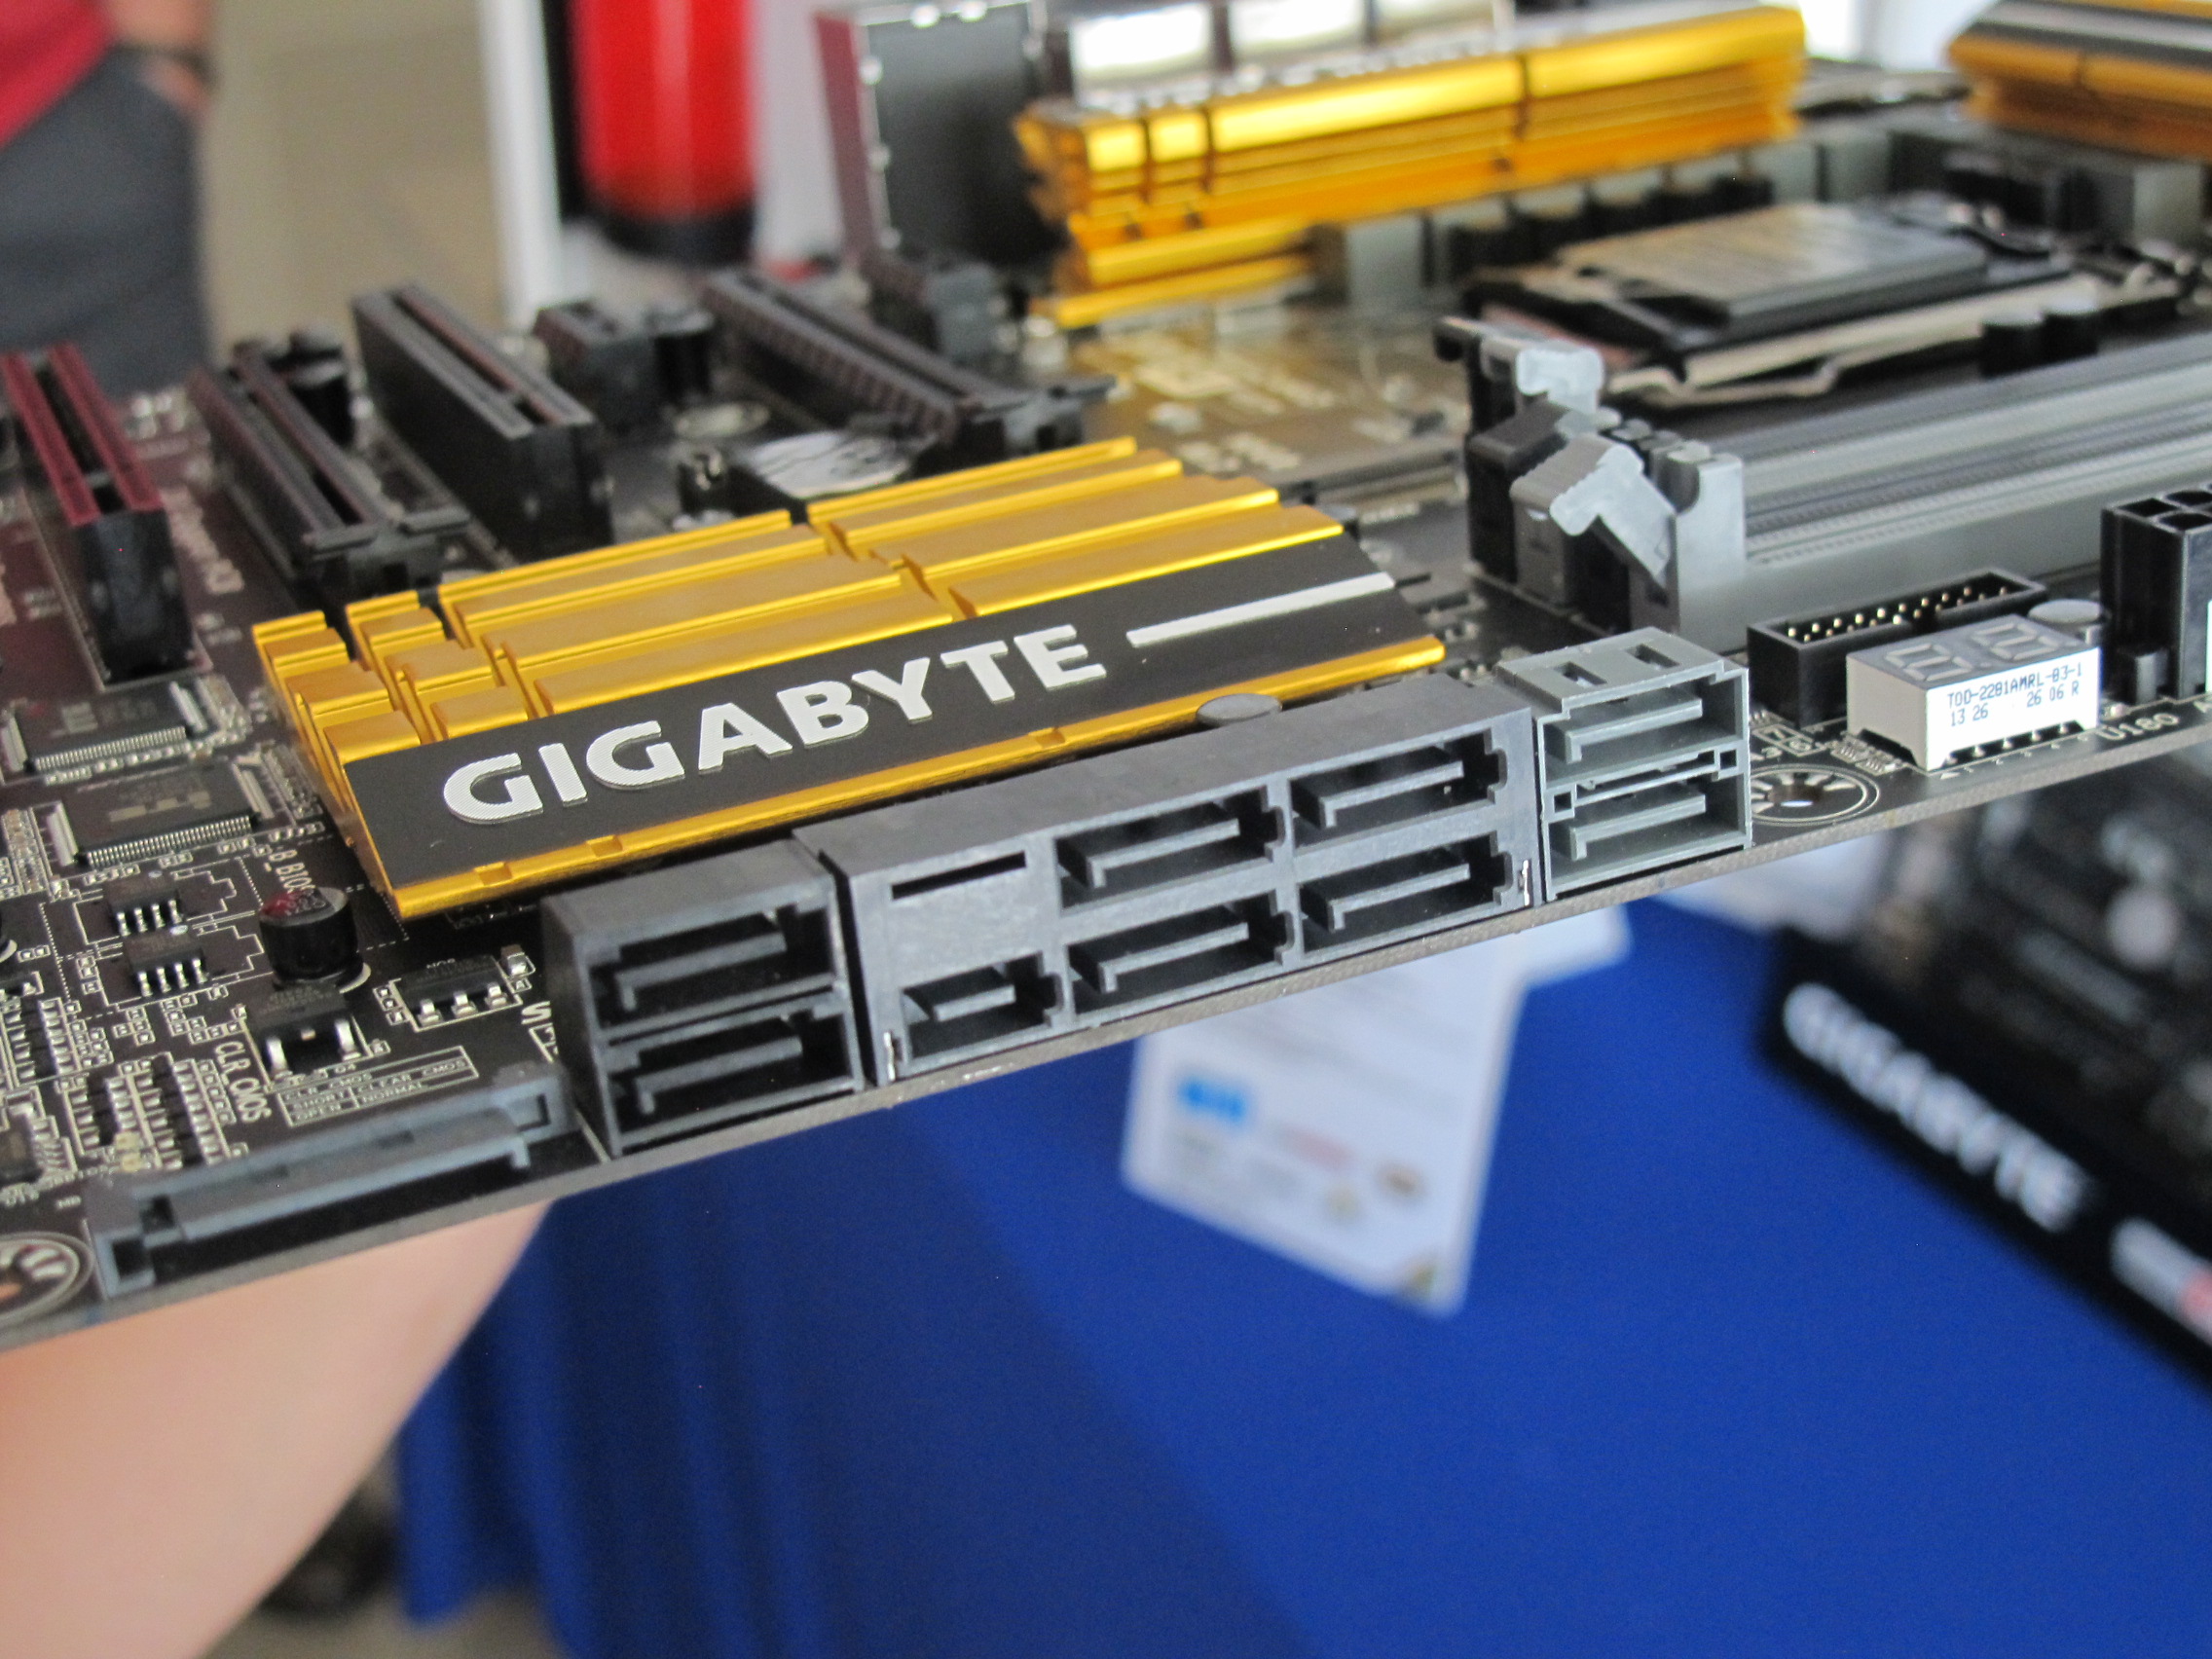
차세대 사타 익스프레스 인터페이스 지원
| Intel Haswell Refresh CPU List (Desktop) | ||||||||
| New SKU | Cores | Base | Turbo | L3 Cache | IGP | TDP / W | Intel List Price | |
| Celeron G1840 | 2 / 2 | 2800 | - | 2 MB | HD (Haswell) | 53 | $42 | |
| Celeron G1840T | 2 / 2 | 2500 | - | 2 MB | HD (Haswell) | 35 | $42 | |
| Celeron G1850 | 2 / 2 | 2900 | - | 2 MB | HD (Haswell) | 53 | $52 | |
| Pentium G3240 | 2 / 2 | 3100 | - | 3 MB | HD (Haswell) | 53 | $64 | |
| Pentium G3240T | 2 / 2 | 2700 | - | 3 MB | HD (Haswell) | 35 | $64 | |
| Pentium G3440 | 2 / 2 | 3300 | - | 3 MB | HD (Haswell) | 53 | $75 | |
| Pentium G3440T | 2 / 2 | 2800 | - | 3 MB | HD (Haswell) | 35 | $75 | |
| Pentium G3450 | 2 / 2 | 3400 | - | 3 MB | HD (Haswell) | 53 | $86 | |
| Core i3-4150 | 2 / 4 | 3500 | - | 3 MB | HD 4400 | 54 | $117 | |
| Core i3-4150T | 2 / 4 | 3000 | - | 3 MB | HD 4400 | 35 | $117 | |
| Core i3-4350 | 2 / 4 | 3600 | - | 4 MB | HD 4600 | 54 | $138 | |
| Core i3-4350T | 2 / 4 | 3100 | - | 4 MB | HD 4600 | 35 | $138 | |
| Core i3-4360 | 2 / 4 | 3700 | - | 4 MB | HD 4600 | 54 | $149 | |
| Core i5-4460 | 4 / 4 | 3200 | 3400 | 6 MB | HD 4600 | 84 | $182 | |
| Core i5-4460S | 4 / 4 | 2900 | - | 6 MB | HD 4600 | 65 | $182 | |
| Core i5-4590 | 4 / 4 | 3300 | 3700 | 6 MB | HD 4600 | 84 | $192 | |
| Core i5-4590S | 4 / 4 | 3000 | 3700 | 6 MB | HD 4600 | 65 | $192 | |
| Core i5-4590T | 4 / 4 | 2000 | - | 6 MB | HD 4600 | 35 | $192 | |
| Core i5-4690 | 4 / 4 | 3500 | 3900 | 6 MB | HD 4600 | 84 | $213 | |
| Core i5-4690S | 4 / 4 | 3200 | 3900 | 6 MB | HD 4600 | 65 | $213 | |
| Core i5-4690T | 4 / 4 | 2500 | - | 6 MB | HD 4600 | 45 | $213 | |
| Core i7-4785T | 4 / 8 | 2200 | - | 8 MB | HD 4600 | 35 | $303 | |
| Core i7-4790 | 4 / 8 | 3600 | 4000 | 8 MB | HD 4600 | 84 | $303 | |
| Core i7-4790S | 4 / 8 | 3200 | 4000 | 8 MB | HD 4600 | 65 | $303 | |
| Core i7-4790T | 4 / 8 | 2700 | - | 8 MB | HD 4600 | 45 | $303 | |
데스크탑용 하스웰 리프레시 프로세서 라인업, 가격대를 보면 기존 구형 하스웰과 동일하게 형성
| Haswell Celeron | ||
| Celeron G1840 2.8 GHz (New) |
Celeron G1830 2.8 GHz (Current) | |
| CPU Speed | 2.8 GHz | 2.8 GHz |
| Cores | 2 | 2 |
| Threads | 2 | 2 |
| L2 Cache | 512 KB | 512 KB |
| L3 Cache | 2048 KB | 2048 KB |
| IGP | HD (Haswell) | HD (Haswell) |
| IGP Frequency | ? | 1050 |
| TDP | 53W | 53W |
| Price at Launch | $42 | $52 |
신형 하스웰 셀러론 - 성능을 유지한 채 가격 다운
| Haswell Core i7 | ||
| Core i7-4790 (New) |
Core i7-4771 (Current) | |
| CPU Speed | 3600 MHz / 4000 MHz | 3500 MHz / 3900 MHz |
| Cores | 4 | 4 |
| Threads | 8 | 8 |
| L2 Cache | 1024 KB | 1024 KB |
| L3 Cache | 8192 KB | 8192 KB |
| IGP | HD 4600 | HD 4600 |
| IGP Frequency | 350 / 1200 MHz | 350 MHz / 1200 MHz |
| TDP | 84W | 84W |
| Price at Launch | $303 | $314 (OEM) / $320 (box) |
신형 하스웰 리프레시 Core i7 4790은 기존 정보대로 기본클럭과 부스트 클럭이 각각 100MHz 씩 상승했고, 가격은 오히려 감소 / 공격적인 가격 정책 확인 / 하스웰 수율 안정화
| The Intel Haswell Refresh Review | ||||||
| Core i7-4790 (New) |
Core i7-4770K | Core i7-4765T | Core i5-4690 (New) |
Core i3-4360 (New) |
Core i3-4330 | |
| Price | $303 | $340 | $303 | $225 | $149 | $140 |
| Launch | 5/2014 | 6/2013 | 6/2013 | 5/2014 | 5/2014 | 9/2013 |
| Cores / Threads | 4/8 | 4/8 | 4/8 | 4/4 | 2/4 | 2/4 |
| Base Frequency |
3600 | 3500 | 2000 | 3500 | 3700 | 3500 |
| Turbo Frequency |
4000 | 3900 | 3000 | 3900 | - | - |
| IGP | HD 4600 | HD 4600 | HD 4600 | HD 4600 | HD 4600 | HD 4600 |
| IGP Frequency |
350 | 350 | 350 | 350 | 600 | 350 |
| IGP Turbo | 1200 | 1250 | 1200 | 1200 | 1200 | 1150 |
| L3 Cache | 8 MB | 8 MB | 8 MB | 6 MB | 4 MB | 4 MB |
| TDP | 84 W | 84 W | 35 W | 84 W | 54 W | 54 W |
테스트가 진행된 신형 하스웰 리프레시 4790 / 4690 / 4360 스펙, 각각 동작 클럭 증가
[ 테스트 시스템 ]
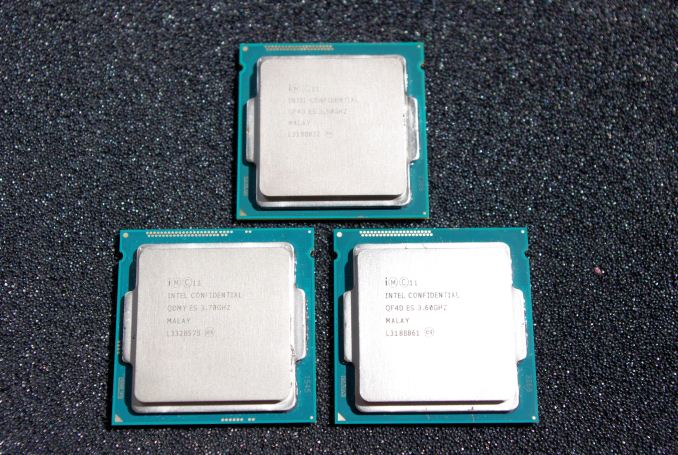
| Test Setup | |
| Processor | Intel Core i7-4790 ES (4C/8T, 3.6 GHz to 4.0 GHz) Intel Core i5-4690 ES (4C/4T, 3.5 GHz to 3.9 GHz) Intel Core i3-4360 ES (2C/4T, 3.7 GHz) |
| Motherboards | ASRock Z97 Extreme6 ASUS Z97-Deluxe |
| Cooling | Corsair H80i Thermaltake TRUE Copper |
| Power Supply | OCZ 1250W Gold ZX Series Corsair AX1200i Platinum PSU |
| Memory | G.Skill RipjawsZ 4x4 GB DDR3-1866 8-9-9 Kit ADATA XPG 2x8 GB DDR3L-1600 9-11-9 Kit |
| Memory Settings | 1600 9-11-9-27 1T tRFC 240 |
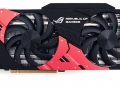
| Video Cards | MSI GTX 770 Lightning 2GB (1150/1202 Boost) ASUS HD7970 3GB (Reference) |
| Video Drivers | Catalyst 13.12 WHQL NVIDIA Drivers 335.23 WHQL |
| Hard Drive | OCZ Vertex 3 256GB |
| Optical Drive | LG GH22NS50 |
| Case | Open Test Bed |
| Operating System | Windows 7 64-bit SP1 |
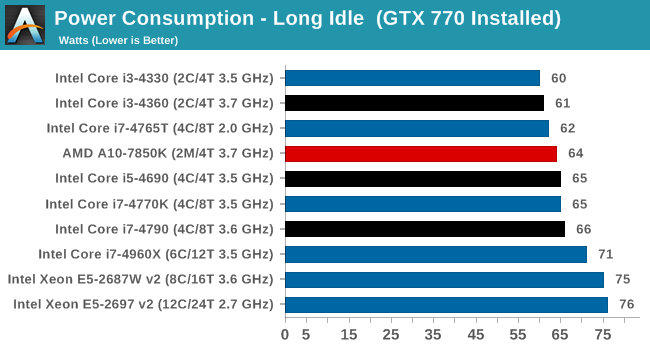
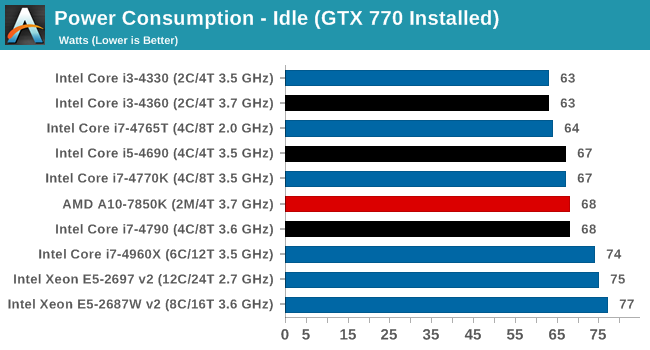
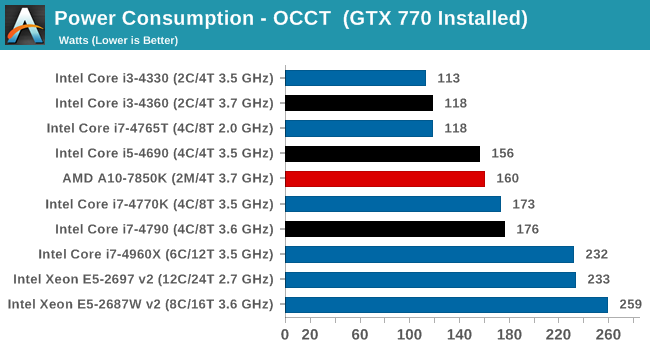
전력소모 테스트 : 아이들시 1와트 내외의 차이 / 풀로드시 3~5와트 편차
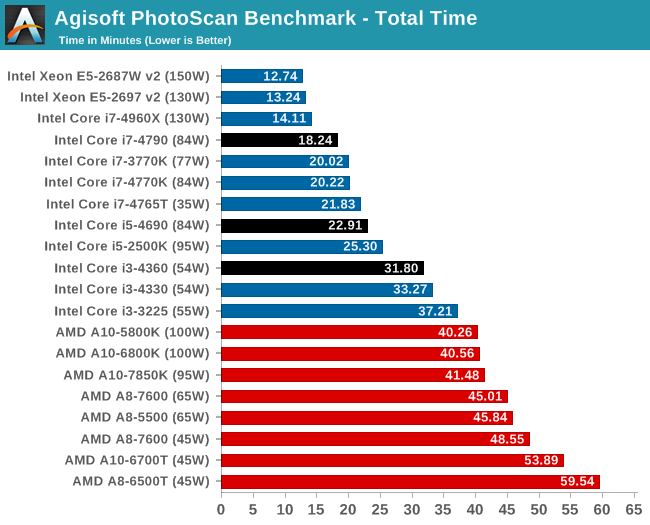
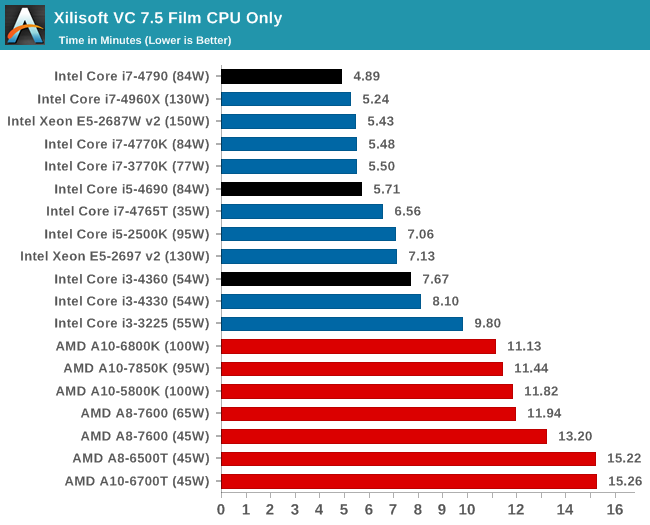
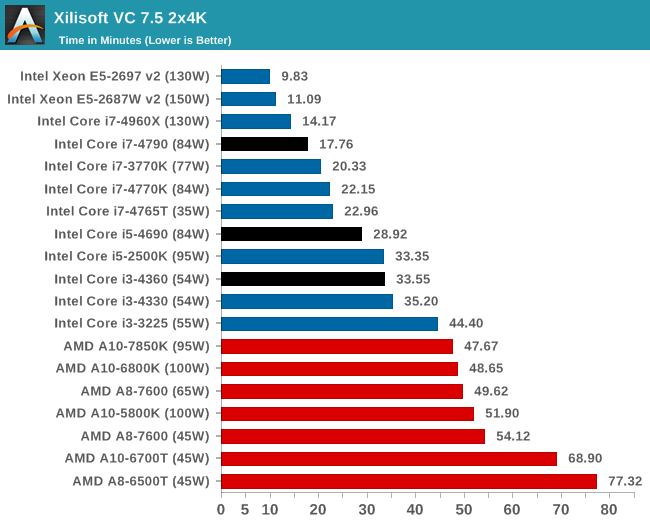
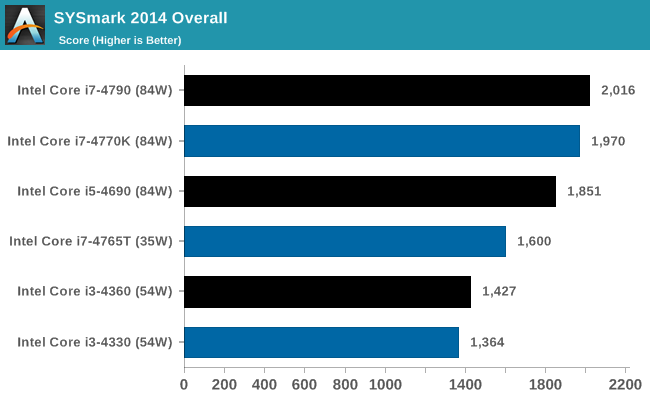
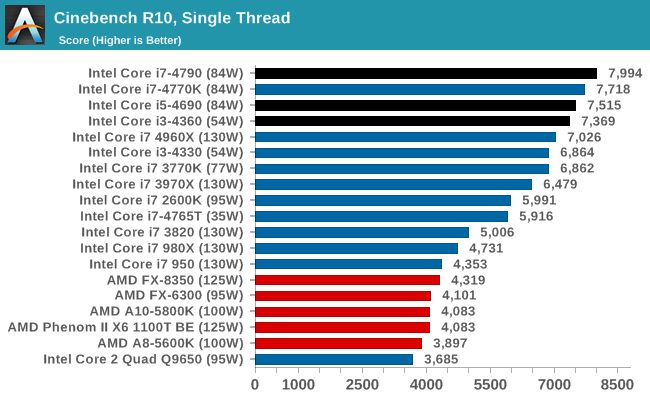
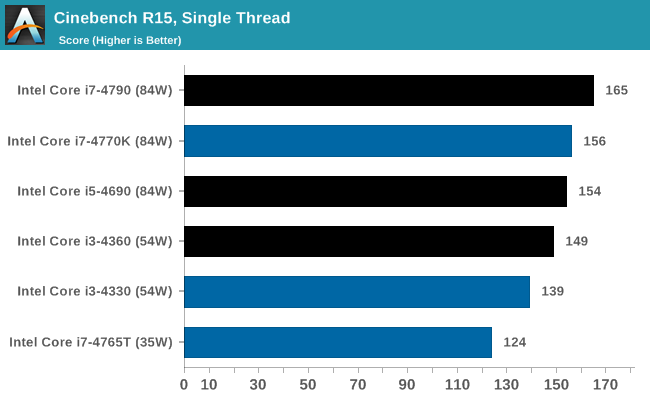
클럭이 상승된 만큼 기존 하스웰 대비 성능 향상
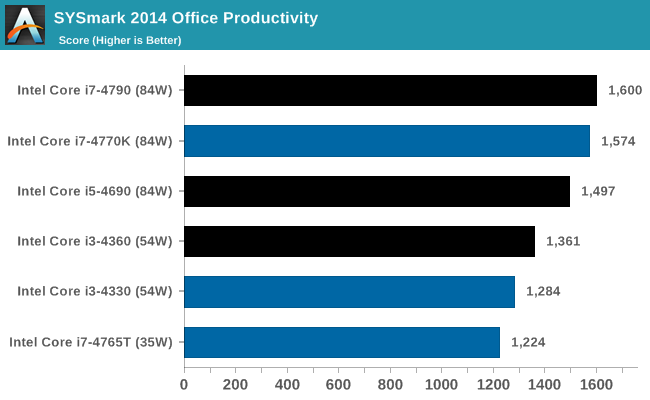
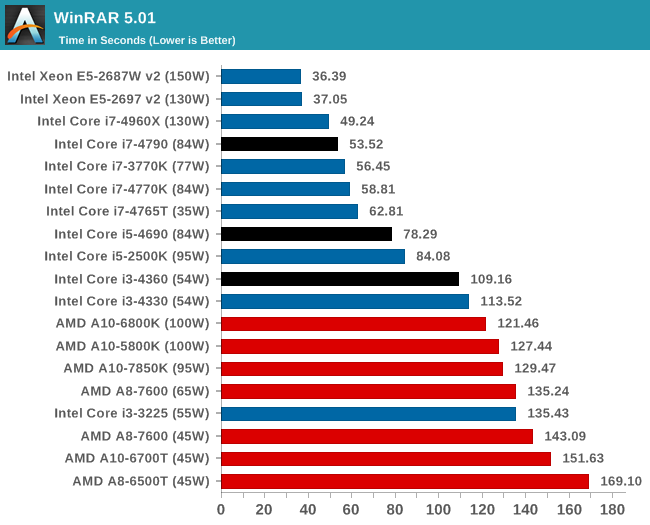
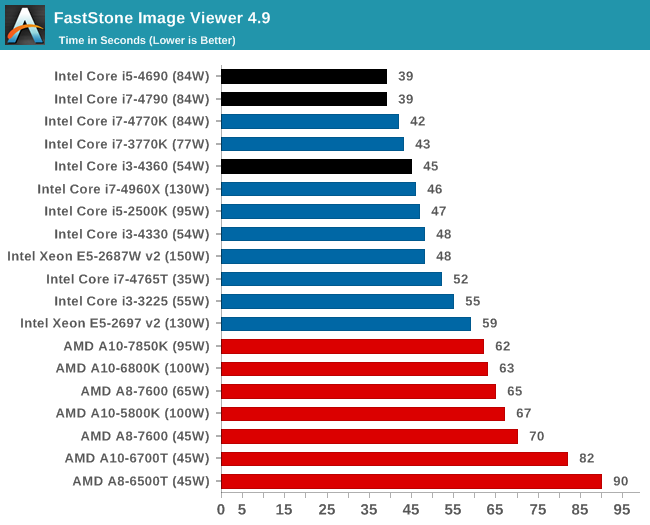
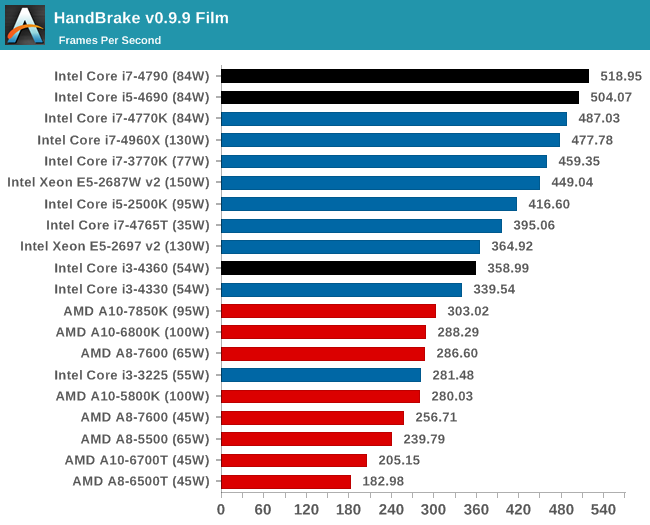
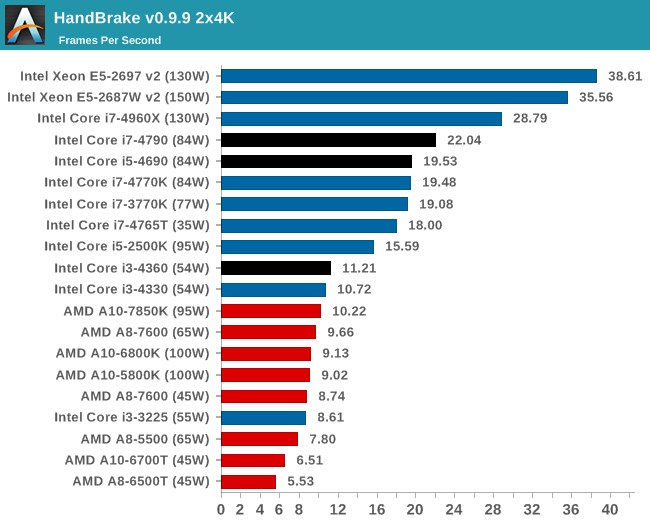
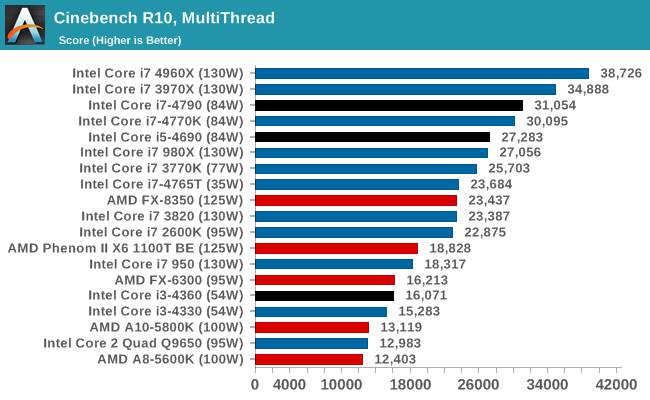
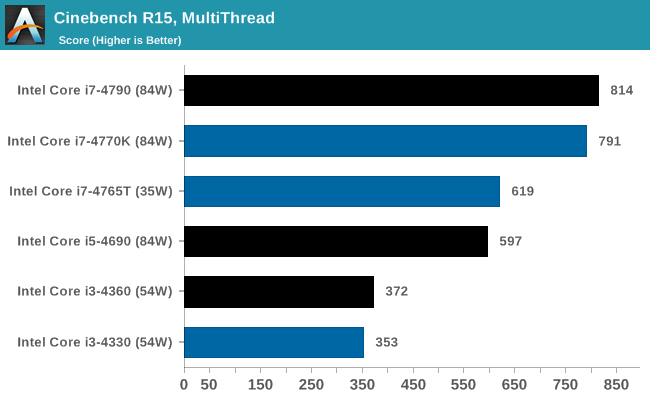
역시 성능 향상
older results we keep the version 10 results in our database.
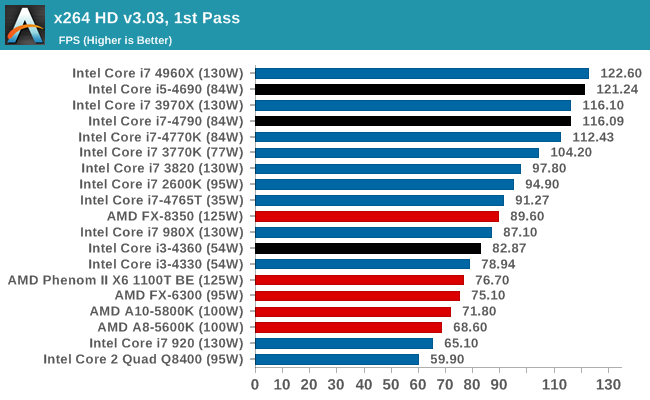
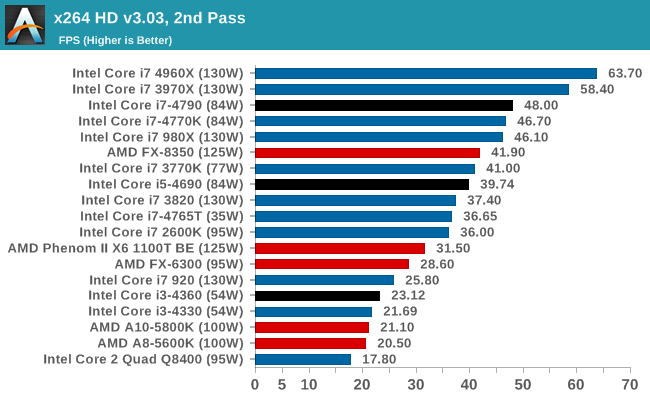
Video Conversion - x264 HD 3.03 Benchmark
Graysky's x264 HD test uses x264 to encode a 4Mbps 720p MPEG-2 source. The focus here is on quality rather than speed, thus the benchmark uses a 2-pass encode and reports the average frame rate in each pass.
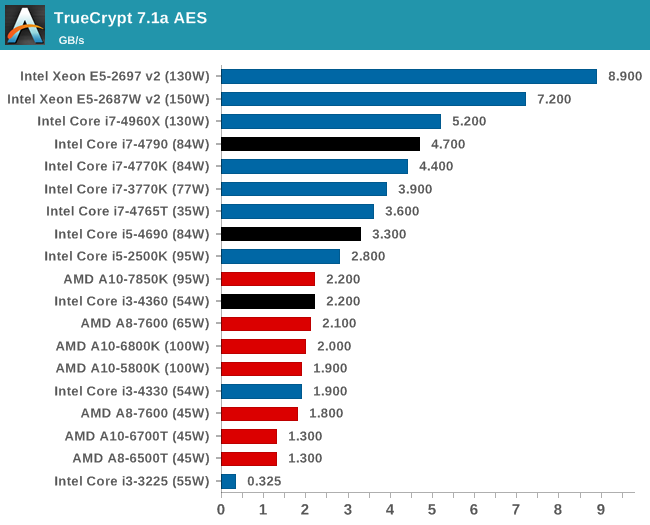
Encryption –TrueCrypt v0.7.1a: link
TrueCrypt is an off the shelf open source encryption tool for xe/files and folders. For our test we run the benchmark mode using a 1GB buffer and take the mean result from AES encryption.
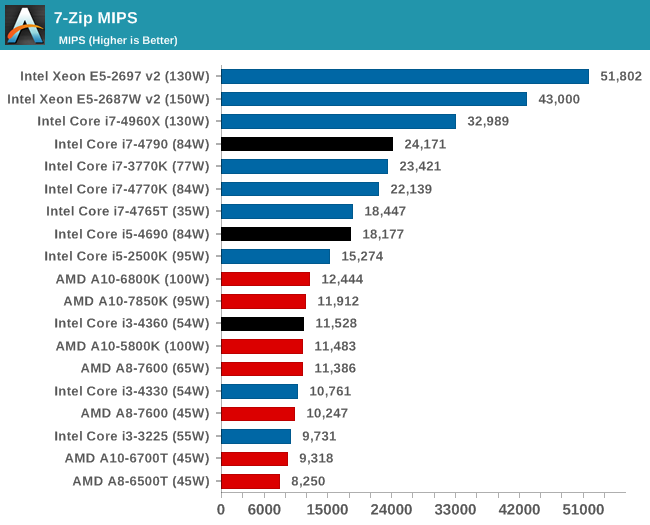
Synthetic – 7-Zip 9.2: link
As an open source compression tool, 7-Zip is a popular tool for making sets of xe/files easier to handle and transfer. The software offers up its own benchmark, to which we report the result.
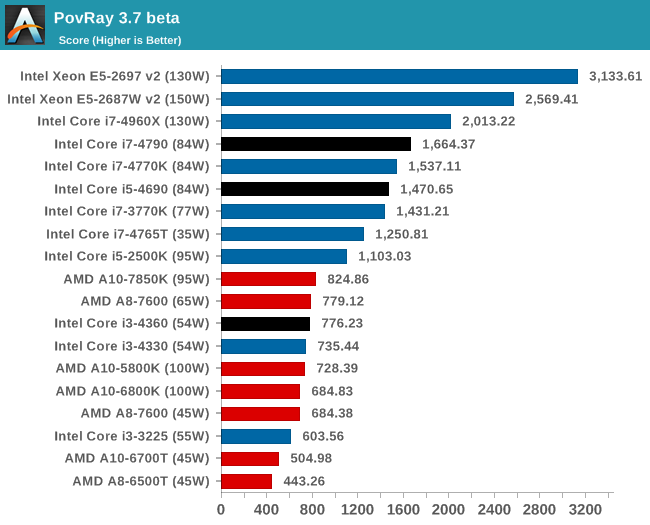
Rendering – PovRay 3.7: link
The Persistence of Vision RayTracer, or PovRay, is a freeware package for as the name suggests, ray tracing. It is a pure renderer, rather than modeling software, but the latest beta version contains a handy benchmark for stressing all processing threads on a platform. We have been using this test in motherboard reviews to test memory stability at various CPU speeds to good effect – if it passes the test, the IMC in the CPU is stable for a given CPU speed. As a CPU test, it runs for approximately 2-3 minutes on high end platforms.
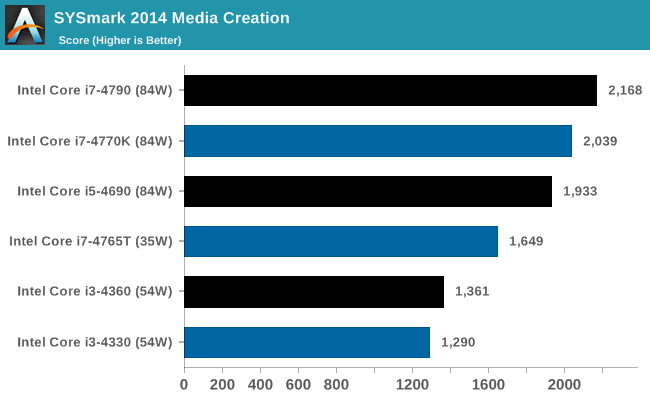
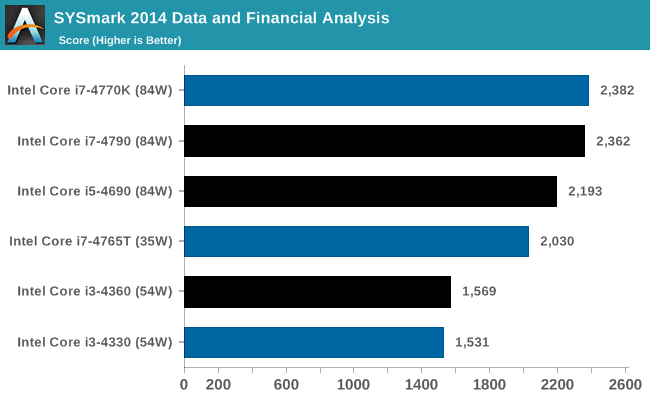
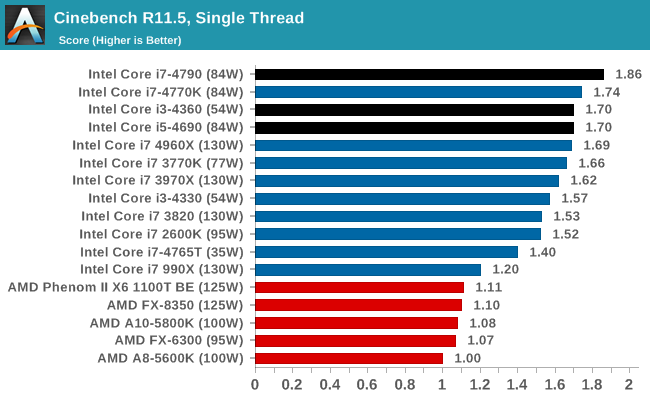
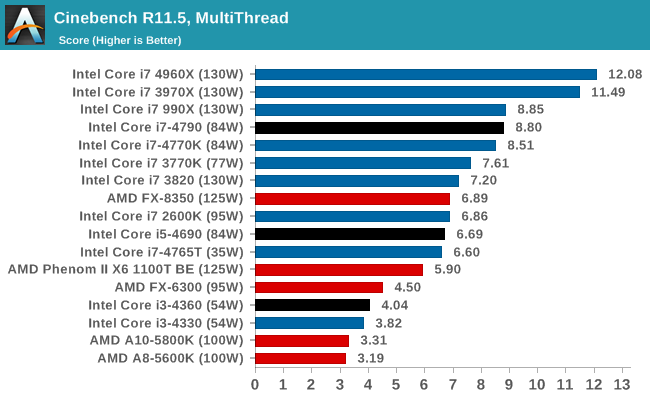
전체적으로 모두 성능 향상
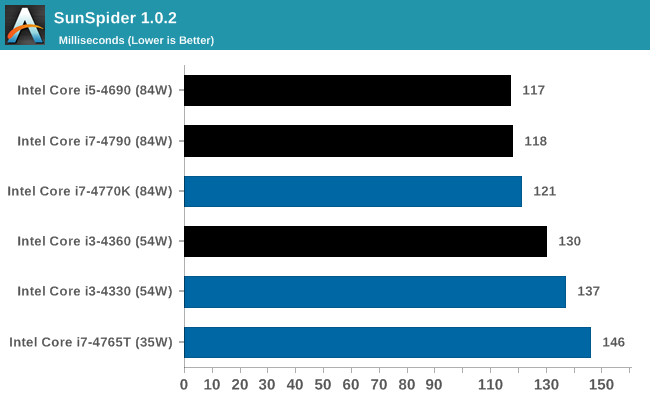
SunSpider 1.0.2: link
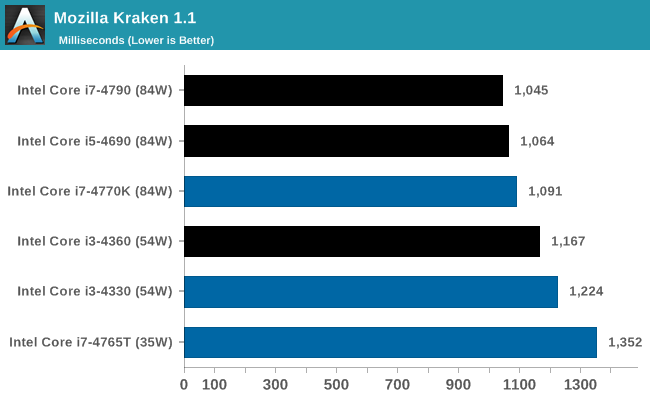
Mozilla Kraken 1.1: link
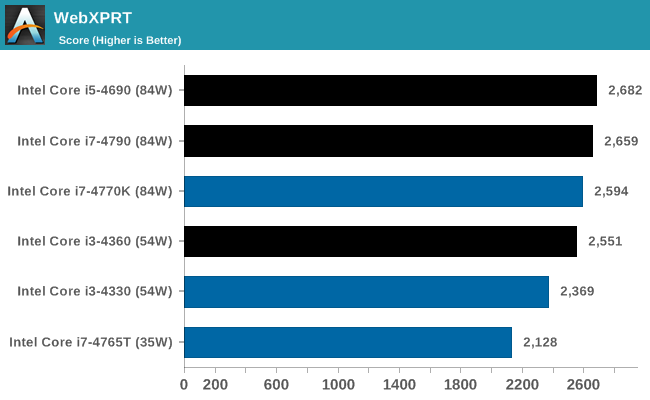
PT WebXPRT 2013: link
Google Octane 2: link
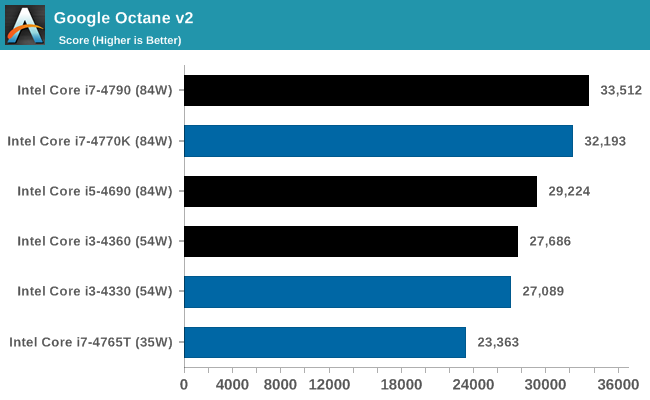
전체적으로 클럭 상승 만큰 모든 부분 성능 향상
이하 내장 그래픽 성능
F1 2013
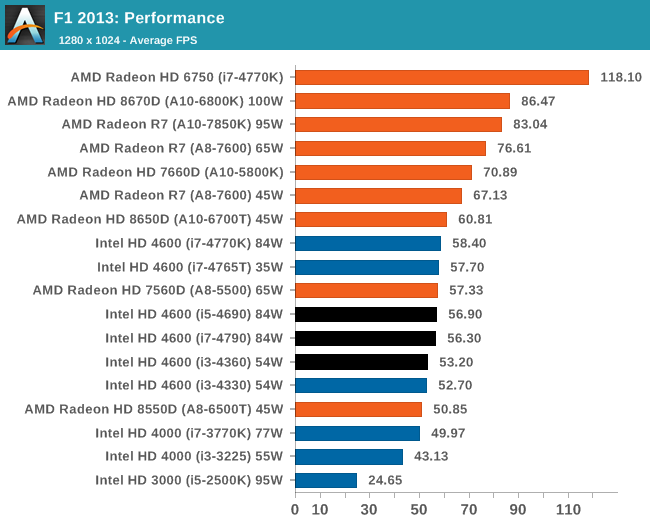
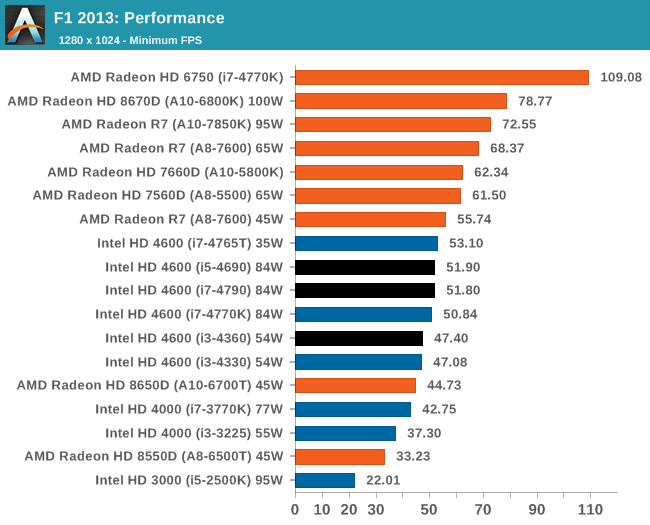
The HD 4600 at 1200 MHz falls just short of 60 FPS average on F1 2013, and moving up from the i3 seems to offer a 6% increase in minimum frame rates.
Bioshock Infinite
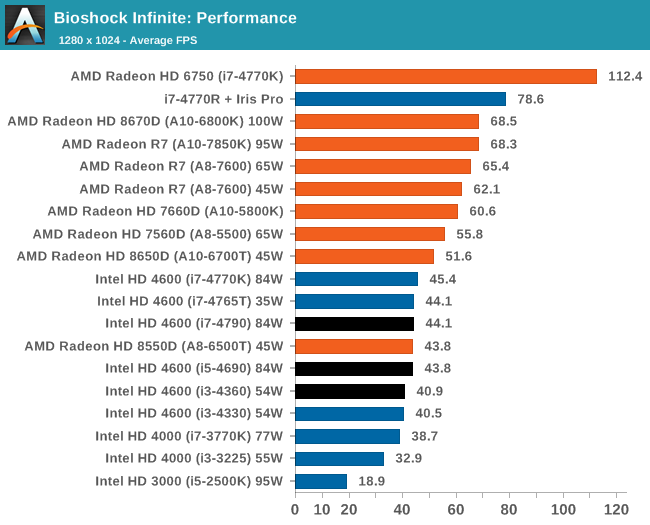
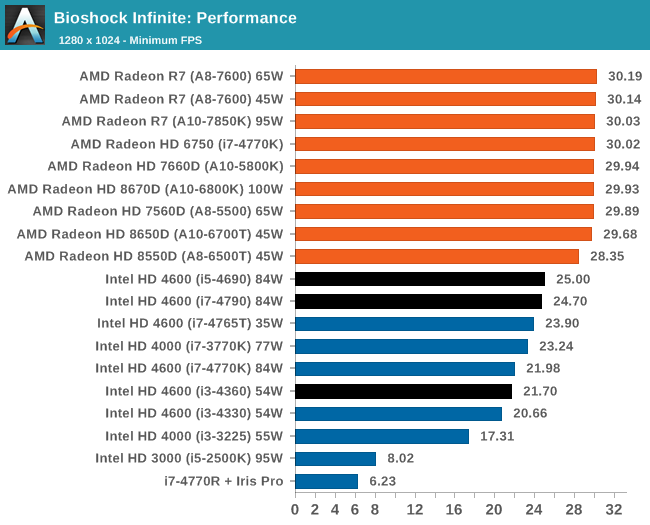
Bioshock Infinite seems memory bound a little, given how good Iris Pro is compared to the HD 4600 scores. There is almost a 10% jump from i3 to i5 here on average FPS and almost 20% in minimum FPS.
Tomb Raider
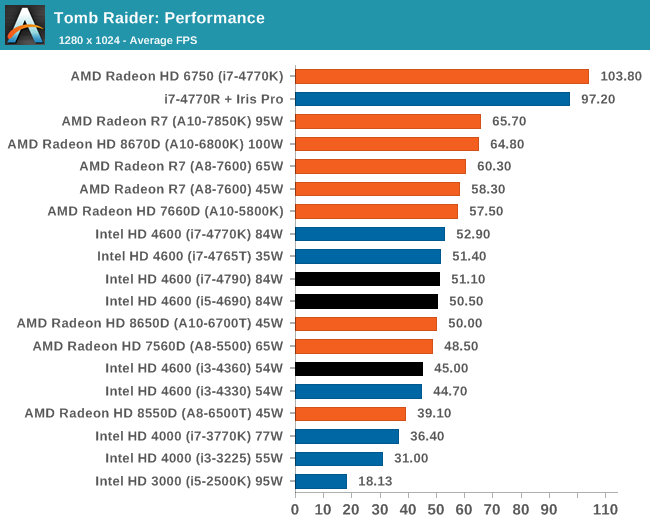
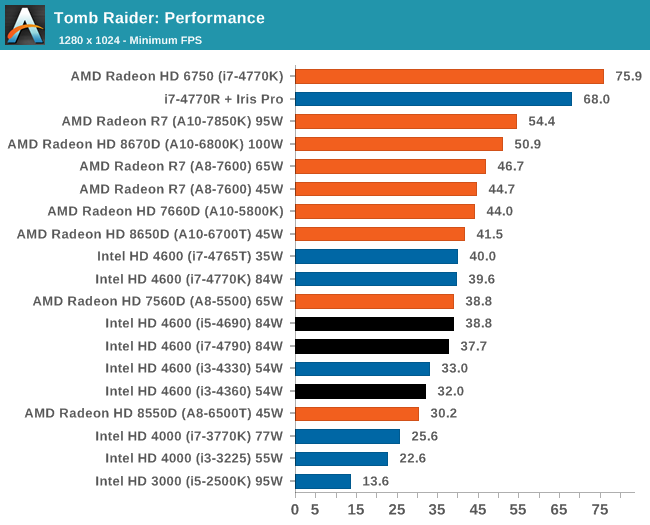
Tomb Raider with discrete GPUs is characteristally CPU agnostic, however moving from an i3 to an i5 gives and extra 5.5 FPS on average in our test.
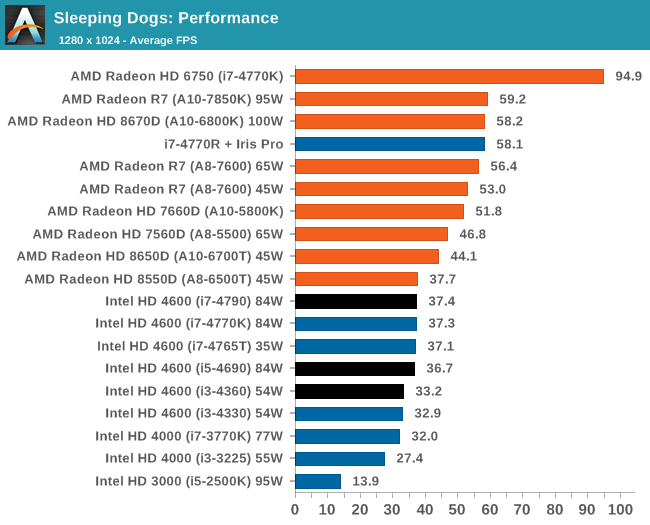
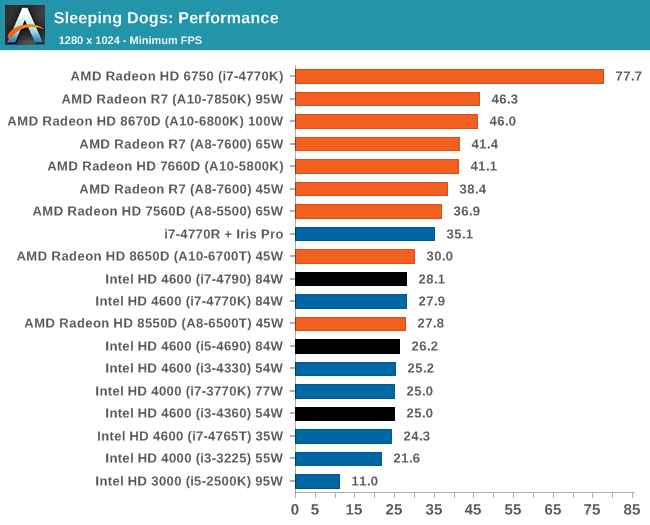
Sleeping Dogs
Company of Heroes 2
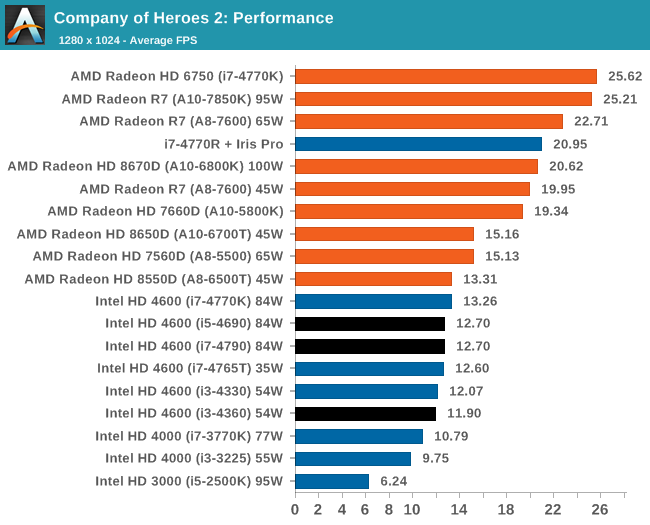
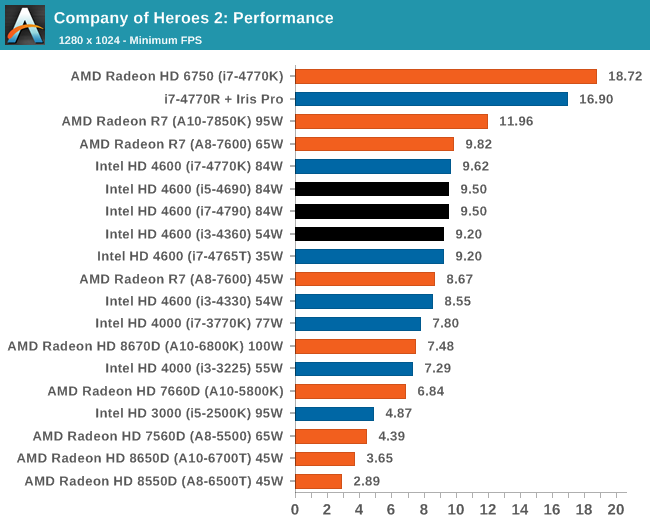
내장 그래픽 성능은 전반적으로 AMD가 우세하나 인텔의 아이리스 프로 내장 그래픽은 막강
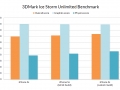
3DMark
The synthetic tools from Futuremark have been on the benchmarking landscape for over a decade, with each generation designed to tackle new problems as either the CPUs or GPUs become too powerful. Here we test 3DMark 06, 3DMark 11 (Performance) and the latest 3DMark.
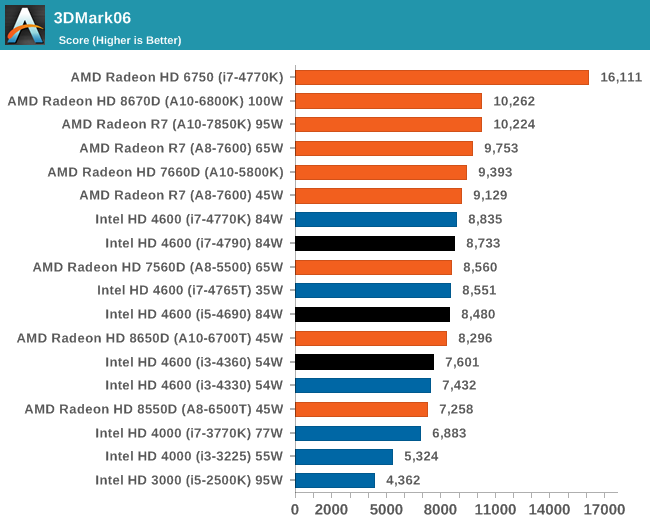
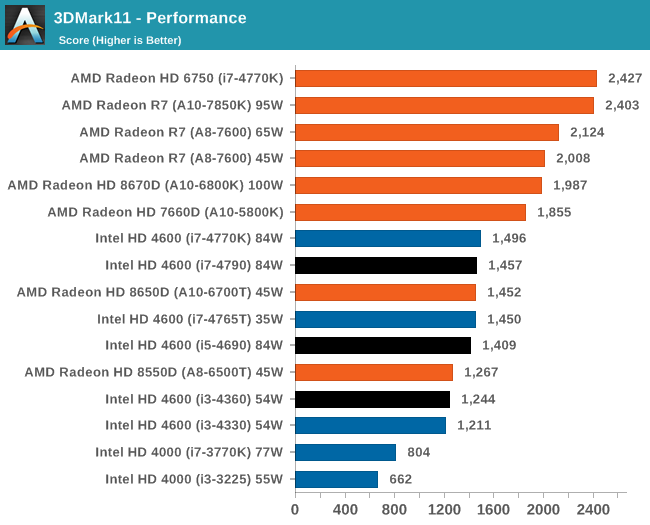
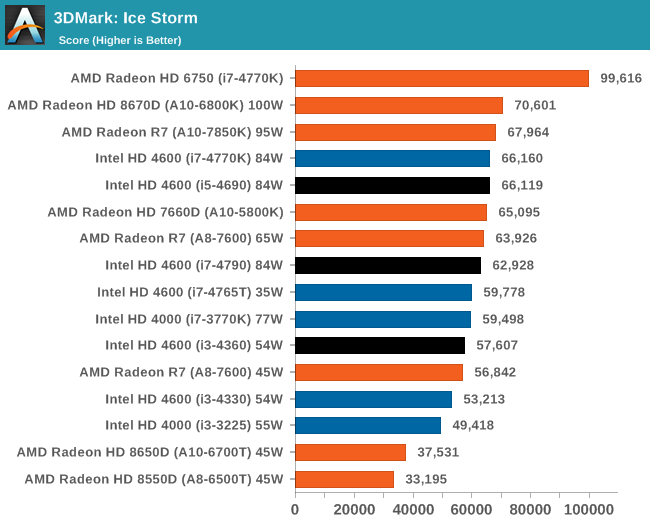
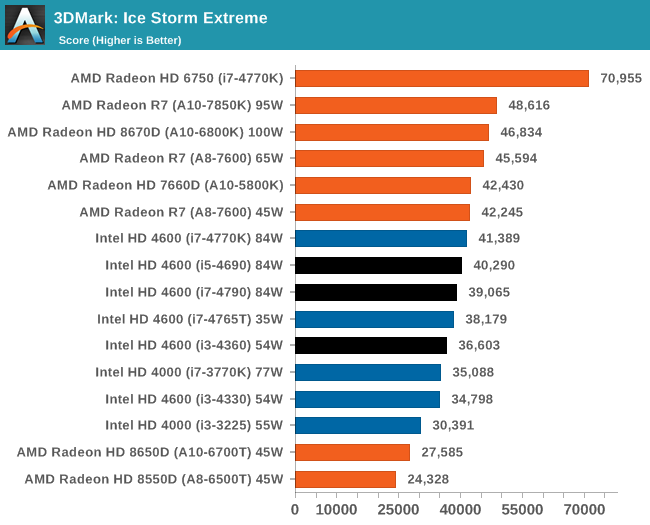
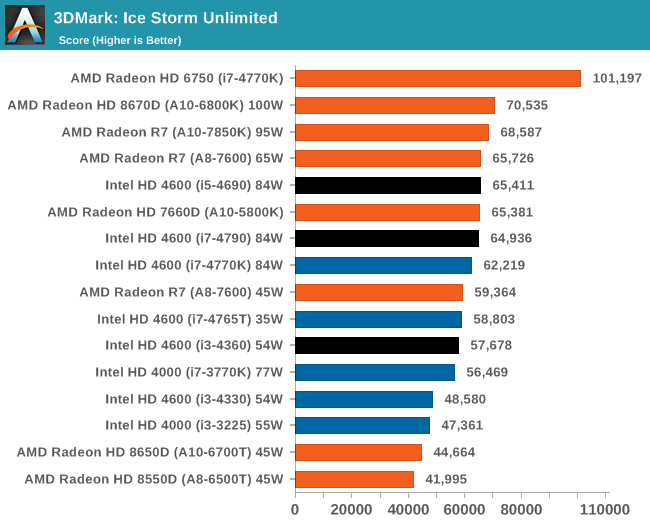
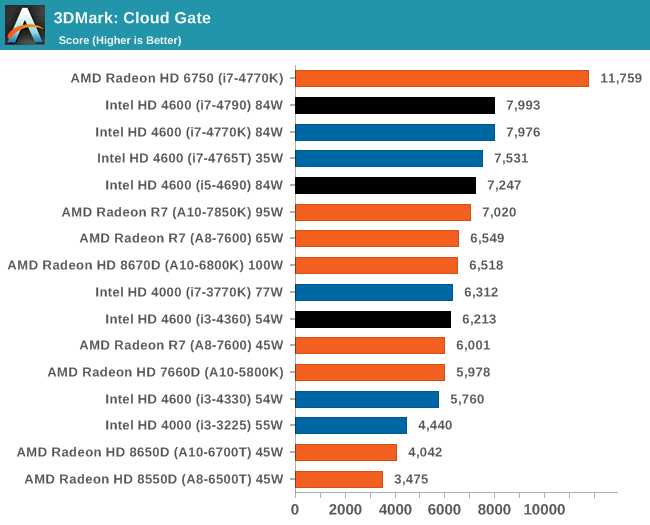
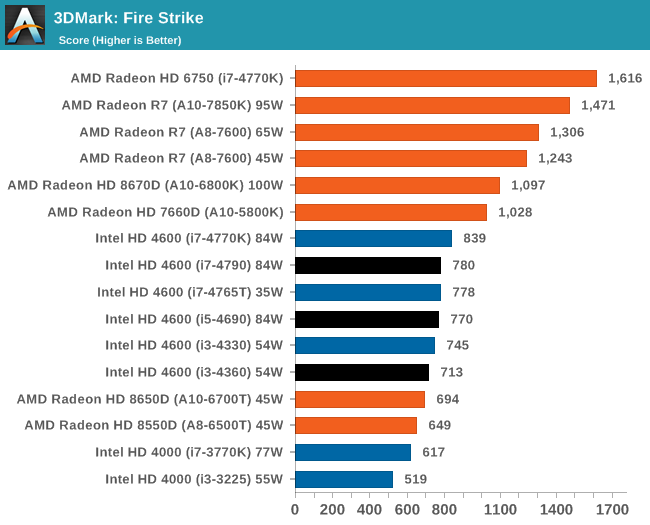
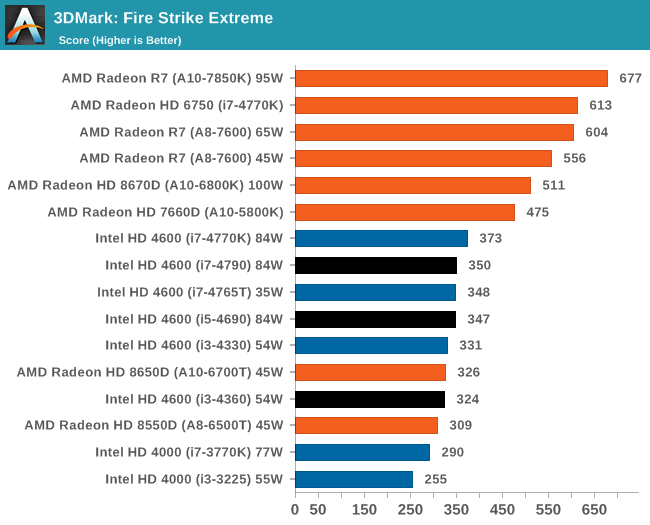
일반적인 내장 그래픽 성능은 AMD 가 우세
dGPU Benchmarks: 1x MSI GTX770 Lightning
F1 2013
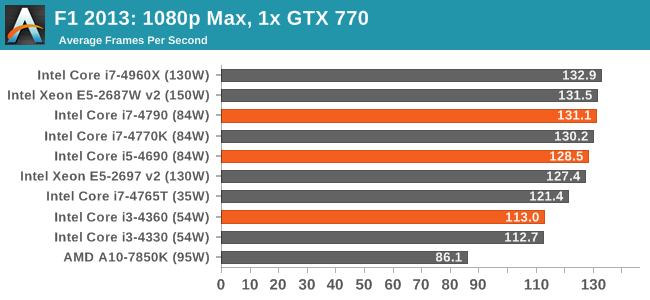
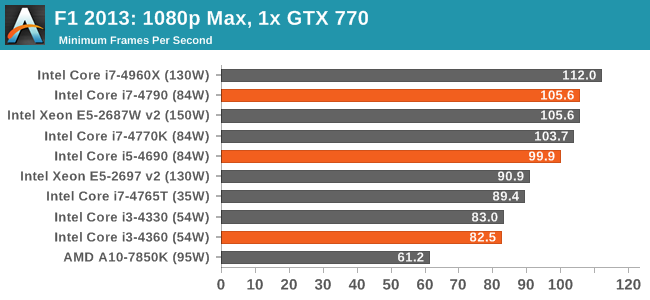
Using the i3 brings the frame rate down below 120 FPS average, with the minimum FPS up to 20% lower than the i5.
Bioshock Infinite
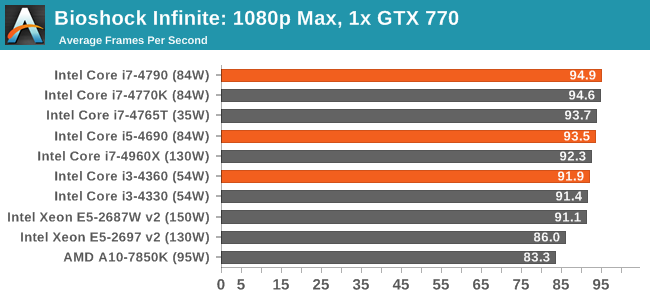
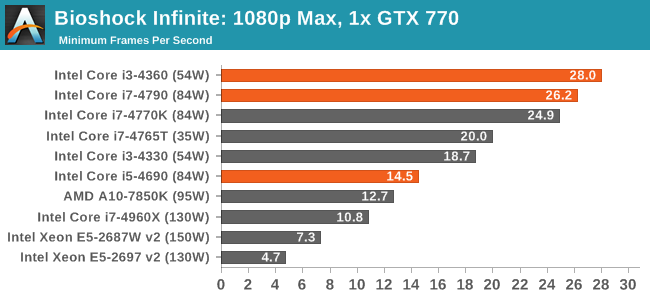
With Bioshock on single NVIDIA, it would seem that CPU power matters more in the minimum FPS values.
Tomb Raider
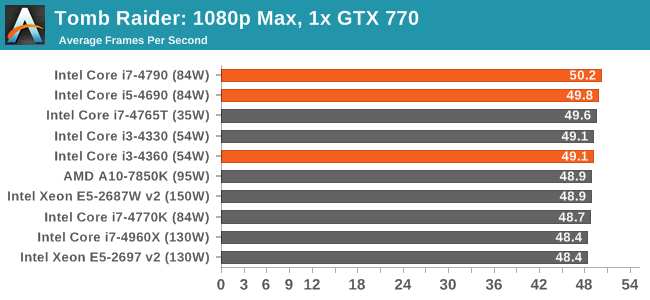
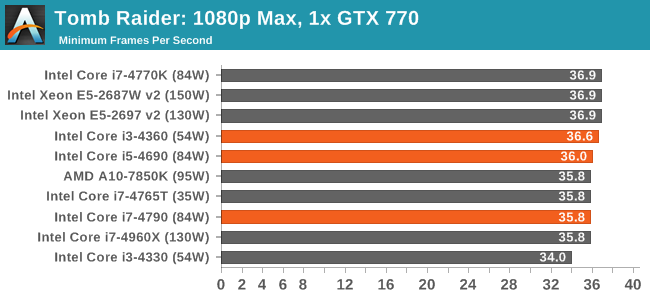
Tomb Raider is infamously CPU-agnostic, showing all CPUs hovering around or below 50 FPS average.
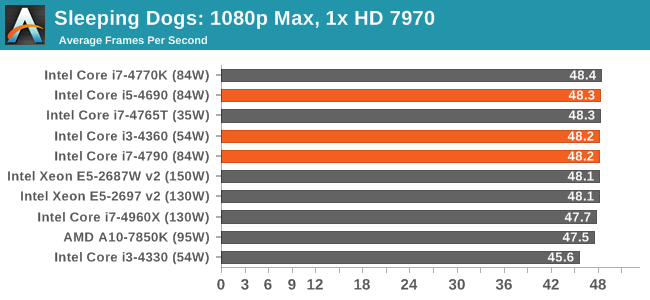
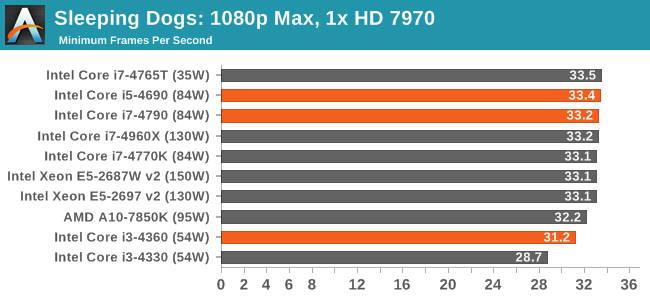
Sleeping Dogs
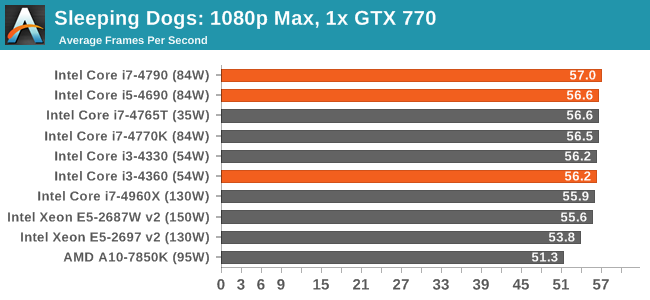
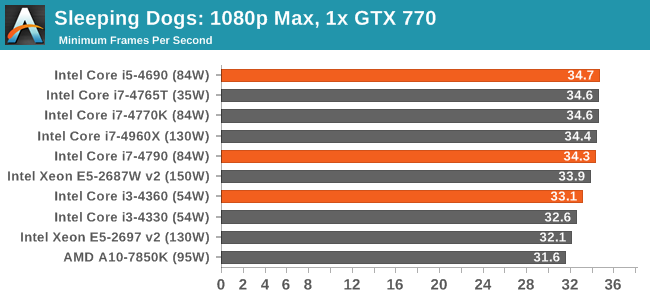
Similarly with Sleeping Dogs, it does not take much CPU power to hit peak FPS.
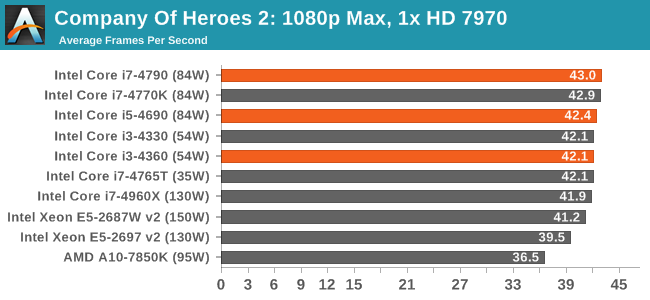
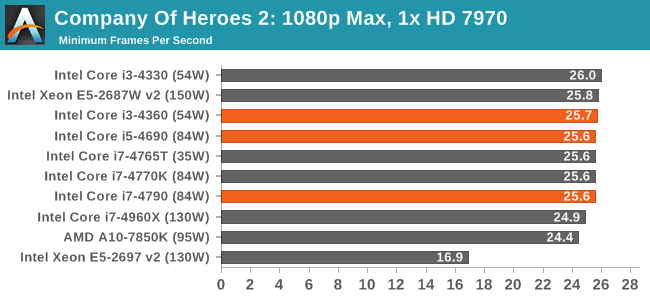
Company of Heroes 2
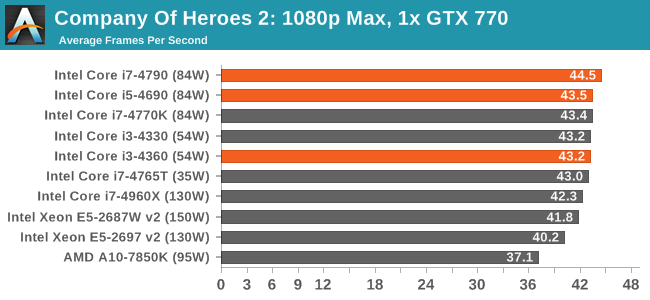
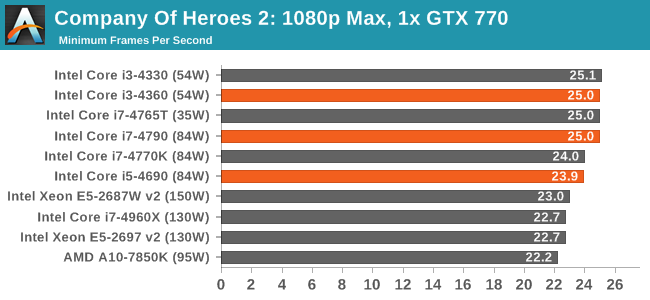
COH2 takes a strain on most graphics cards, but both average and minimum FPS are roughly the same for all three refresh CPUs.
Battlefield 4
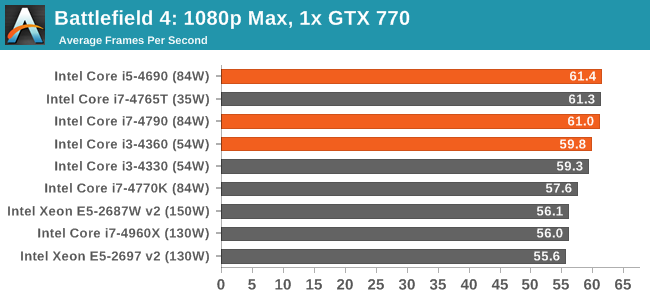
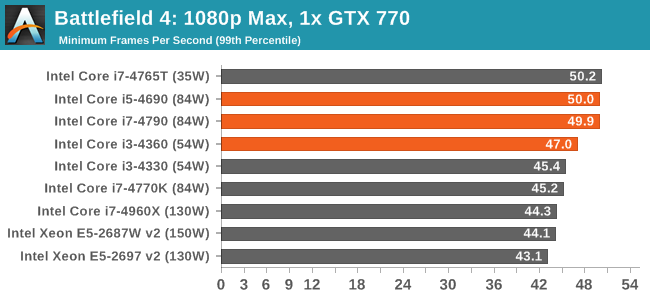
외장 그래픽(지포스 770) 탑재 비교시 인텔의 독무대
dGPU Benchmarks: 1x ASUS HD7970
F1 2013
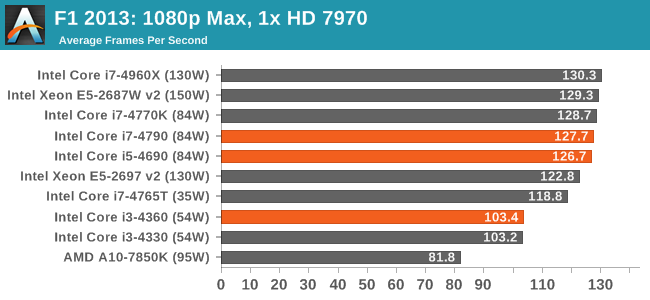
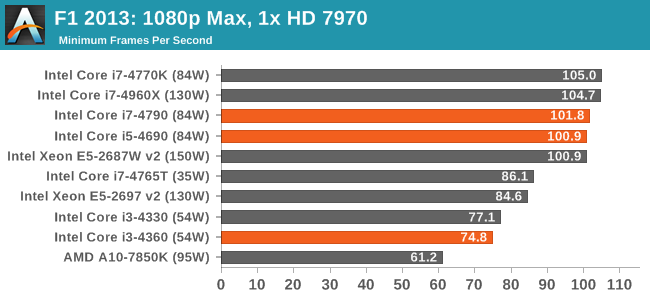
With a single 7970, the 25% minimum frame-rate difference between an i3 and an i5 is almost astonishing.
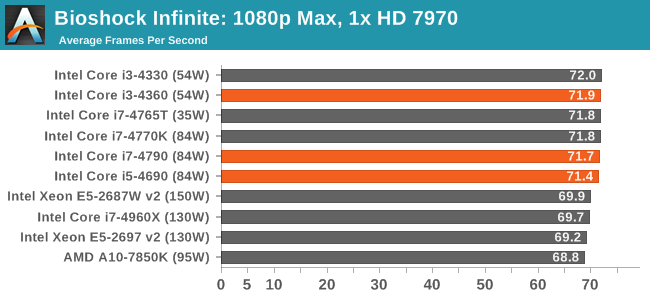
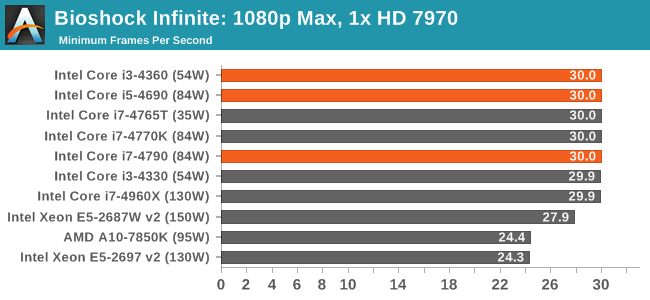
Bioshock Infinite
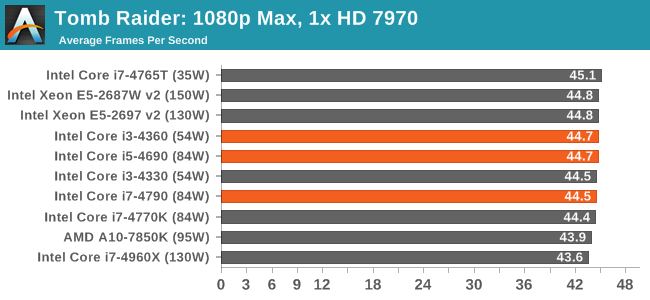
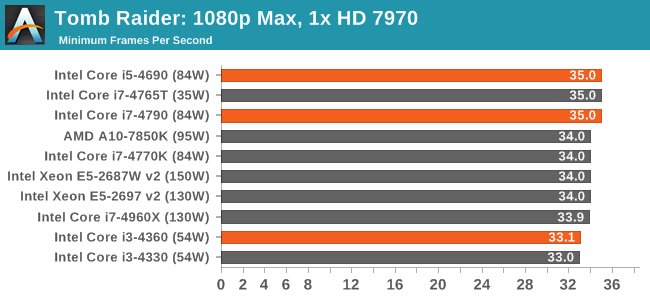
Tomb Raider
Sleeping Dogs
Company of Heroes 2
Battlefield 4
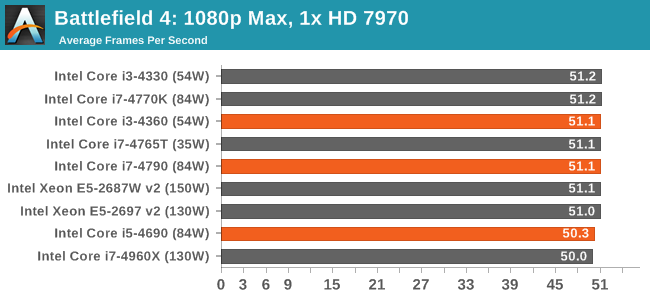
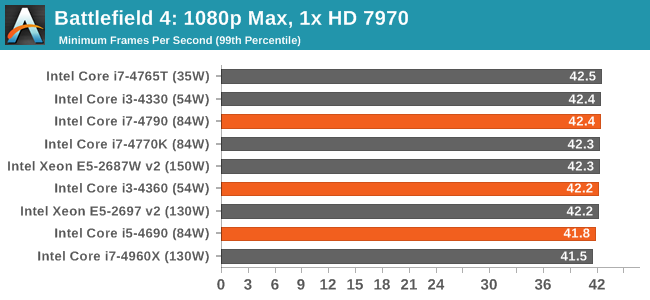
외장 그래픽(라데온 7970) 탑재 비교시 같은 결과로 인텔
하스웰 리프레시는 기존 하스웰 대비 성능 향상, 가격은 비슷하거나 저렴


오.. 이제 사타 익스프레스도 달려나오네요